Clinical Trial
. 2024 Sep 3;12(9):1221-1235.
doi: 10.1158/2326-6066.CIR-23-1073.

Blockade of IL1β and PD1 with Combination Chemotherapy Reduces Systemic Myeloid Suppression in Metastatic Pancreatic Cancer with Heterogeneous Effects in the Tumor

Affiliations
Clinical Trial

Blockade of IL1β and PD1 with Combination Chemotherapy Reduces Systemic Myeloid Suppression in Metastatic Pancreatic Cancer with Heterogeneous Effects in the Tumor

Paul E Oberstein et al. Cancer Immunol Res. .

Abstract

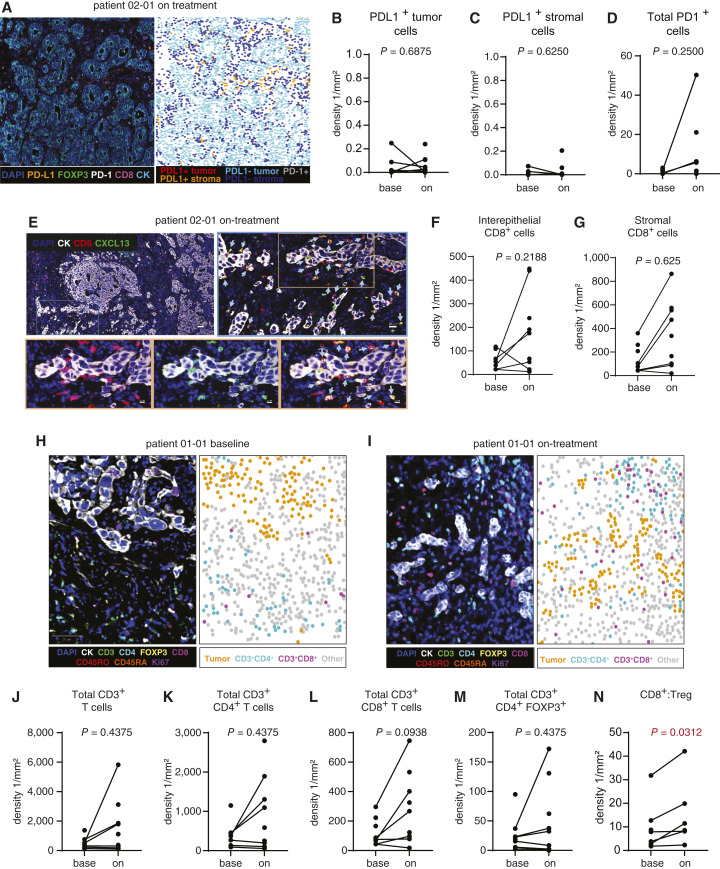
Innate inflammation promotes tumor development, although the role of innate inflammatory cytokines in established human tumors is unclear. Herein, we report clinical and translational results from a phase Ib trial testing whether IL1β blockade in human pancreatic cancer would alleviate myeloid immunosuppression and reveal antitumor T-cell responses to PD1 blockade. Patients with treatment-naïve advanced pancreatic ductal adenocarcinoma (n = 10) were treated with canakinumab, a high-affinity monoclonal human antiinterleukin-1β (IL1β), the PD1 blocking antibody spartalizumab, and gemcitabine/n(ab)paclitaxel. Analysis of paired peripheral blood from patients in the trial versus patients receiving multiagent chemotherapy showed a modest increase in HLA-DR+CD38+ activated CD8+ T cells and a decrease in circulating monocytic myeloid-derived suppressor cells (MDSC) by flow cytometry for patients in the trial but not in controls. Similarly, we used patient serum to differentiate monocytic MDSCs in vitro and showed that functional inhibition of T-cell proliferation was reduced when using on-treatment serum samples from patients in the trial but not when using serum from patients treated with chemotherapy alone. Within the tumor, we observed few changes in suppressive myeloid-cell populations or activated T cells as assessed by single-cell transcriptional profiling or multiplex immunofluorescence, although increases in CD8+ T cells suggest that improvements in the tumor immune microenvironment might be revealed by a larger study. Overall, the data indicate that exposure to PD1 and IL1β blockade induced a modest reactivation of peripheral CD8+ T cells and decreased circulating monocytic MDSCs; however, these changes did not lead to similarly uniform alterations in the tumor microenvironment.


Conflict of interest statement

P.E. Oberstein reports other support from Novartis during the conduct of the study, as well as personal fees from Ipsen and Lilly outside the submitted work. O.E. Rahma reports personal fees from Merck, Celgene, Five Prime, GSK, Bayer, Roche/Genentech, Puretech, Imvax, Sobi, Boehringer Ingelheim and hold pending patent for “Methods of using pembrolizumab and trebananib” outside the submitted work. O.E. Rahma is a full-time associate of AstraZeneca not during the time period of the submitted work. H. Singh reports grants from AstraZeneca and other support from Dewpoint Therapeutics, Merck Sharpe & Dohme, Dava Oncology, and UpToDate outside the submitted work. T.A. Abrams reports grants and personal fees from AstraZeneca and personal fees from Eisai, Elevar, HistoSonics, and Sirtex outside the submitted work. J.M. Cleary reports personal fees from Blueprint Medicines, Incyte, and AstraZeneca and grants from Amgen, Merus, Roche, Servier, BMS, Esperas Pharma, AstraZeneca, Merck, Pyxis Oncology, Arcus, and GSK outside the submitted work. B.M. Huffman reports personal fees from Lilly outside the submitted work. K.J. Perez reports personal fees from Ipsen, Novartis, and Lantheus outside the submitted work. D.A. Rubinson reports personal fees from Taiho, Sirtex, and Instylla outside the submitted work. B.L. Schlechter reports Agemis and Janssen outside the submitted work. R. Surana reports personal fees from Grupo Oncoclinicas and other support from DAVA Oncology outside the submitted work. M.B. Yurgelun reports grants from Janssen and personal fees from Nouscom and UpToDate outside the submitted work. K.M. Sullivan reports personal fees from Eli Lilly outside the submitted work. M. Dougan reports personal fees from Neoleukin, Genentech, Partner Therapeutics, SQZ Biotech, AzurRx, Eli Lilly, Mallinckrodt Pharmaceuticals, Aditum, Foghorn Therapeutics, Palleon, Sorriso Pharmaceuticals, Generate Biomedicines, Asher Bio, Alloy Therapeutics, Third Rock Ventures, DE Shaw Research, Agenus, Astellas, and Curie Bio and other support from Veravas, Monod Bio, Axxis Bio, and Cerberus Therapeutics outside the submitted work. M. Dajee is a full-time associate of Novartis Institute for Biomedical Research and reports other support from Novartis Cooperation outside the submitted work. M.R. Pelletier is a full-time associate of Novartis Institute for Biomedical Research. S. Nazeer is a full-time associate of Novartis Pharma AG and a member of the clinical study team. M. Squires is a full-time associate of Novartis Pharma AG. B.M. Wolpin reports personal fees from Mirati; grants from Novartis; grants and personal fees from Revolution Medicines and Harbinger; personal fees from GRAIL, Ipsen, EcoR1 Capital, Third Rock Ventures, and Agenus; and grants from AstraZeneca and Eli Lilly outside the submitted work. J.A. Nowak reports grants from Natera and personal fees from Leica Biosystems outside the submitted work. D.M. Simeone reports grants from Novartis during the conduct of the study; grants from Micronoma, Immunovia, ClearNote Health, Biological Dynamics, and Tempus; personal fees from ClearNote Health, Interpace, Merck & Co., Bayer, and FibroGen outside of the submitted work. S.K. Dougan reports grants from Novartis during the conduct of the study; grants from BMS and Takeda; personal fees and other support from Kojin Therapeutics; and other support from Axxis Bio outside the submitted work. No disclosures were reported by the other authors.

Figures

Figure 1.
Figure 1.
Clinical outcomes for SR1, an open-label multicenter phase Ib study evaluating gemcitabine, n(ab)-paclitaxel, canakinumab, and spartalizumab in advanced pancreatic ductal adenocarcinoma. A, Study design schema is shown. B, Waterfall plot showing best RECIST response for the 10 patients enrolled in SR1. C, Imaging scans for patient 02-004 at baseline and 8 weeks on therapy showing reduction of the primary pancreatic lesion, indicated by the red arrow. The patient also experienced a decrease in liver metastases.
Figure 2.
Figure 2.
SR1 combination therapy leads to modest reinvigoration of circulating T cells. A, Serum from patients in the SR1 trial (n = 10) or patients receiving standard-of-care gemcitabine/n(ab)paclitaxel (n = 9) were collected at baseline and on treatment as indicated in Supplementary Table S2. Concentration of serum IL1β was determined by cytokine bead array. Mean of healthy control serum (n = 6) is indicated by the dashed line. B, PBMCs from patients in the SR1 trial (n = 10) or patients receiving standard-of-care gemcitabine/n(ab)paclitaxel (n = 10) were collected at baseline and on treatment as indicated in Supplementary Table S2. PD1+ cells as a percent of total CD8 T cells were determined by flow cytometry. C, PBMCs from B were stained with antibodies against HLA-DR and CD38, and activated CD8 T cells were quantified by flow cytometry. D, Representative flow plots and gating strategy for the data shown in C. Cycle 1 day 1 (C1D1) and cycle 2 day 1 (C2D1) are shown. E–G, Serum cytokine values were determined as in A for (E) IL2 (F) IFNγ and (G) CXCL9. Statistical analysis throughout was performed using the Wilcoxon matched-pair signed rank test and a P value threshold of 0.05. Actual P values are shown.
Figure 3.
Figure 3.
SR1 combination therapy leads to a decrease in systemic myeloid suppression. A, PBMCs from patients in the SR1 trial (n = 10) or patients receiving standard-of-care gemcitabine/n(ab)paclitaxel (n = 10) were collected at baseline and on treatment as indicated in Supplementary Table S2 and analyzed by flow cytometry. Monocytic MDSCs (MoMDSC) were defined as CD45+CD14+CD33+HLA-DRlow and shown as a percent of total CD45+ cells. B, MoMDSCs as a percent of total CD14+ monocytes. C, Representative flow plots and gating strategy from data shown in (A). Cycle 1 day 1 (C1D1) and cycle 2 day 1 (C2D1) are shown. D, Diagram of serum suppression assay. Healthy monocytes are differentiated for a week in media containing 20% healthy or patient serum or recombinant IL6/GM-CSF and then cocultured with fresh CFSE-labeled T cells from a healthy donor and anti-CD3/CD28 beads. E, T-cell proliferation after 72 hours of culture with the indicated MDSC populations was measured by flow cytometry for CFSE dye dilution. Proliferation values were normalized to the mean of healthy control serum conditions. iMDSCs generated by differentiation with recombinant IL6/GM-CSF were included as a positive control shown in blue. Serum from patients in the SR1 trial (n = 10) or patients receiving standard-of-care gemcitabine/n(ab)paclitaxel (n = 9) was collected at baseline and on treatment as indicated in Supplementary Table S2. Concentration of serum IL6 (F), IL18 (G), FLT3L (H), and TNFα (I) was determined by cytokine bead array. Mean of healthy control serum (n = 6) is indicated by the dashed line. Statistical analysis throughout was performed using the Wilcoxon matched-pair signed rank test and a P value threshold of 0.1. Actual P values are displayed.
Figure 4.
Figure 4.
Single-cell transcriptional profiling reveals the effects of SR1 treatment on the myeloid compartment in the tumor microenvironment. Baseline and on-treatment biopsies from patients in the SR1 trial were analyzed by scRNA-seq. N = 7 baseline samples; N = 6 on-treatment samples. A, UMAP of all cells in the myeloid compartment, colored by cluster. B, UMAP of all cells in the myeloid compartment of baseline samples (top) or samples from patients on treatment (bottom). C, Relative expression of several genes of interest across the myeloid compartment. D, Percentage of each sample’s myeloid cells located in the TAM & MDSC cluster, separated by baseline/treated and responder/nonresponder (Kruskal–Wallis test). The box extends from the first to the third quartile of the variable, with the line in the middle representing the median. Whiskers extend to the lowest/highest data points that are within 1.5 IQR of Q1/Q3, respectively. No outliers were noted. Actual P values are shown. E, Volcano plot of genes differentially expressed between baseline and treated samples throughout the myeloid compartment. Statistical analysis performed using the Wilcoxon rank-sum test and a P value threshold of 0.01.
Figure 5.
Figure 5.
Intratumoral CD8:Treg ratio improves in patients receiving SR1 combination therapy. A, Baseline and on-treatment biopsies from patients (n = 6 paired samples) in the SR1 trial were analyzed by multiplex immunofluorescence (mIF). Representative mIF images and assigned cell phenotypes are shown for the PD1/PDL1 panel. B–D, PDL1+ cell densities were quantified for cytokeratin+ tumor regions and cytokeratin stromal regions (including immune cells). PD1+ cell density was calculated for the entire tissue region. E, On-treatment biopsy from patient 02-001, experiencing a partial response, was stained for CD8, CXCL13, 2-(4-amidinophenyl)-1H-indole-6-carboxamidine (DAPI), and cytokeratin as shown. Note the several CXCL13+CD8+ activated T cells (arrows) touching cytokeratin+ tumor cells. F, CD8 T-cell density within cytokeratin+ regions. G, Densities of CD8 T cells within cytokeratin stromal regions. H and I, Baseline and on-treatment biopsies from patients (n = 6 paired samples) in the SR1 trial were analyzed by mIF using the indicated antibodies. Representative images from the T lymphocyte panel are shown. Entire tissue region densities of (J) CD3+ T cells (K) CD4+ T cells; (L) CD8+ T cells, (M) Tregs, and (N) CD8+:FOXP3+ ratios are shown. Statistical analysis throughout was performed using the Wilcoxon matched-pair signed rank test and a P value threshold of 0.05. Actual P values are shown.
Figure 6.
Figure 6.
Intratumoral myeloid populations are not substantially altered in patients receiving SR1 combination therapy. A, Baseline and on-treatment biopsies from patients (n = 6 paired samples) in the SR1 trial were analyzed by multiplex immunofluorescence using the indicated antibodies. Representative image of the MDSC panel is shown. B, Densities of CD14+ cells. C, Densities of CD15+ cells. D, Densities of CD15+ARG1+ cells. E, Densities of MoMDSCs as defined using the same markers used for peripheral blood in Fig. 3. F, Correlation of peripheral blood and tumor MoMDSC frequencies using the tumor MoMDSC values from E. G, Densities of MoMDSCs as defined by CD14+ARG1+. Statistical analysis throughout was performed using the Wilcoxon matched-pair signed rank test and a P value threshold of 0.05. Actual P values are shown. H, Correlation of peripheral blood and tumor MoMDSC frequencies using the tumor MoMDSC values from G. Statistical analysis performed using a simple linear regression.

References

    1. Dougan M, Li D, Neuberg D, Mihm M, Googe P, Wong KK, et al. A dual role for the immune response in a mouse model of inflammation-associated lung cancer. J Clin Invest 2011;121:2436–46. - PMC - PubMed
    1. Lowenfels AB, Maisonneuve P, Cavallini G, Ammann RW, Lankisch PG, Andersen JR, et al. Pancreatitis and the risk of pancreatic cancer. International Pancreatitis Study Group. N Engl J Med 1993;328:1433–7. - PubMed
    1. Baron JA, Cole BF, Sandler RS, Haile RW, Ahnen D, Bresalier R, et al. A randomized trial of aspirin to prevent colorectal adenomas. N Engl J Med 2003;348:891–9. - PubMed
    1. Sandler RS, Halabi S, Baron JA, Budinger S, Paskett E, Keresztes R, et al. A randomized trial of aspirin to prevent colorectal adenomas in patients with previous colorectal cancer. N Engl J Med 2003;348:883–90. - PubMed
    1. Walsh MJ, Ali LR, Lenehan P, Kureshi CT, Kureshi R, Dougan M, et al. Blockade of innate inflammatory cytokines TNFα, IL-1β, or IL-6 overcomes virotherapy-induced cancer equilibrium to promote tumor regression. Immunother Adv 2023;3:ltad011. - PMC - PubMed

Publication types

MeSH terms