. 2024 Sep 2;223(9):e202312091.
doi: 10.1083/jcb.202312091. Epub 2024 Jul 11.

Mmp14-dependent remodeling of the pericellular-dermal collagen interface governs fibroblast survival

Affiliations

Mmp14-dependent remodeling of the pericellular-dermal collagen interface governs fibroblast survival

Farideh Sabeh et al. J Cell Biol. .

Abstract

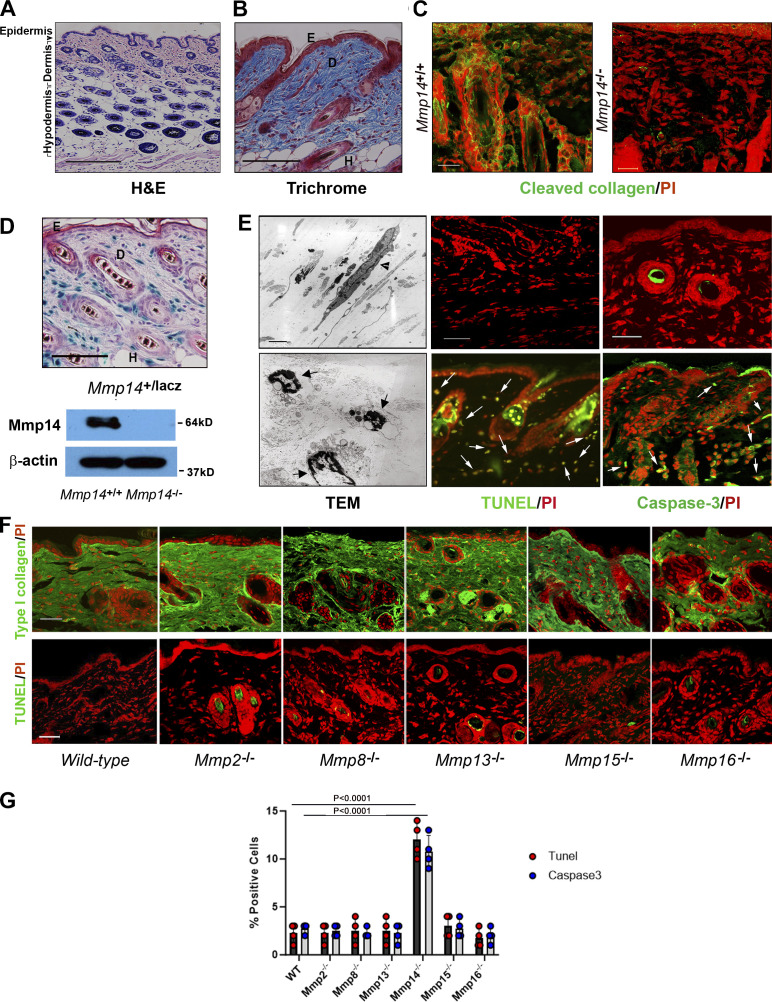
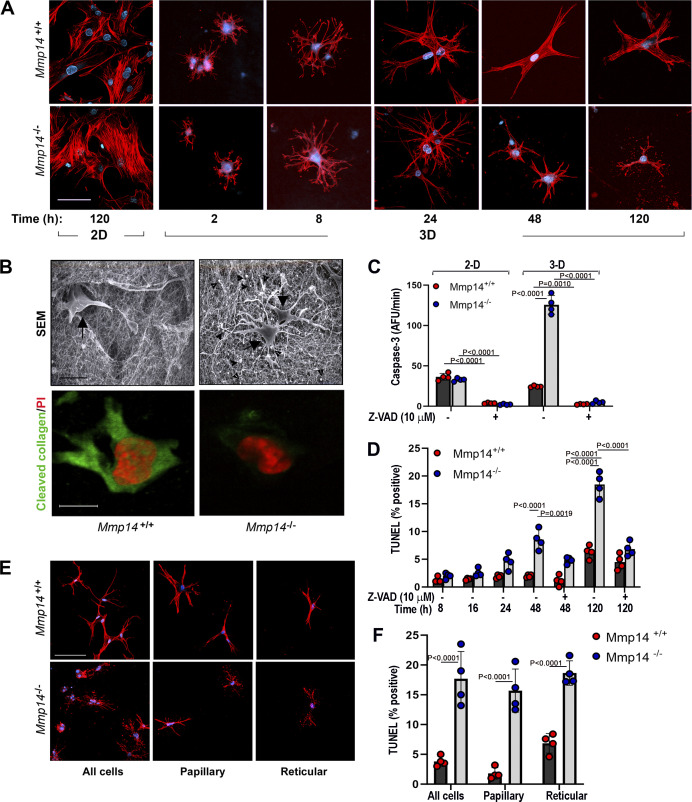
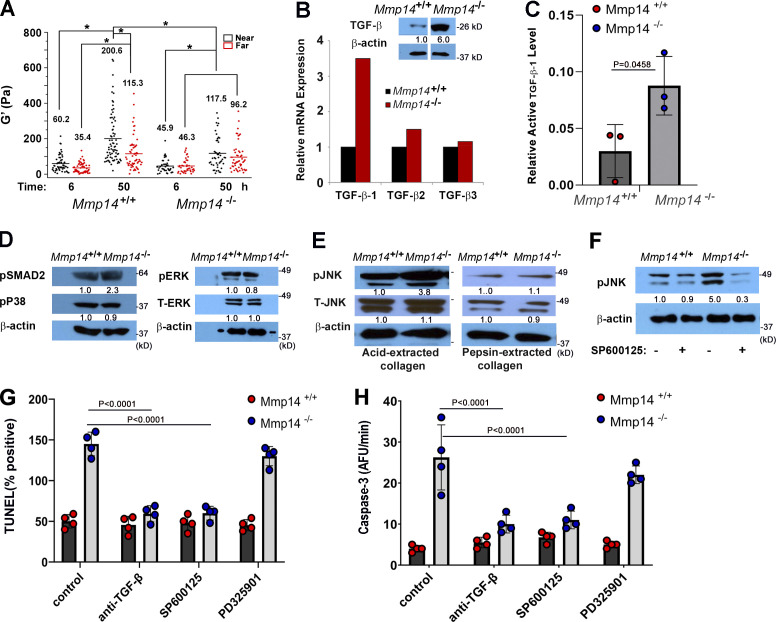
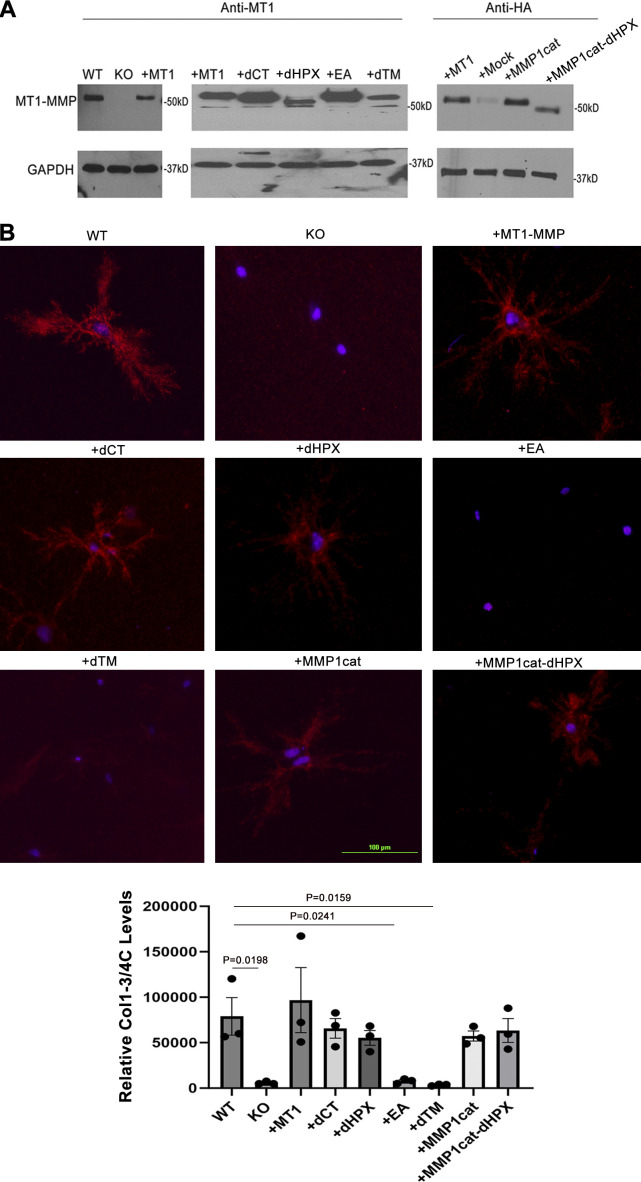
Dermal fibroblasts deposit type I collagen, the dominant extracellular matrix molecule found in skin, during early postnatal development. Coincident with this biosynthetic program, fibroblasts proteolytically remodel pericellular collagen fibrils by mobilizing the membrane-anchored matrix metalloproteinase, Mmp14. Unexpectedly, dermal fibroblasts in Mmp14-/- mice commit to a large-scale apoptotic program that leaves skin tissues replete with dying cells. A requirement for Mmp14 in dermal fibroblast survival is recapitulated in vitro when cells are embedded within, but not cultured atop, three-dimensional hydrogels of crosslinked type I collagen. In the absence of Mmp14-dependent pericellular proteolysis, dermal fibroblasts fail to trigger β1 integrin activation and instead actuate a TGF-β1/phospho-JNK stress response that leads to apoptotic cell death in vitro as well as in vivo. Taken together, these studies identify Mmp14 as a requisite cell survival factor that maintains dermal fibroblast viability in postnatal dermal tissues.


Conflict of interest statement

Disclosures: The authors declare no competing interests exist.

Figures

Figure 1.
Figure 1.
Mmp14-dependent control of dermal fibroblast viability. (A and B) Cross-sections of dorsal skin from 4-wk-old wild-type mice. Tissues were stained with either H&E (A) or Trichrome (B). Bar = 100 µm. (C) Cleaved collagen was visualized in wild-type or Mmp14−/− by immunofluorescence (bar = 25 µm). Results representative of three experiments performed. (D) Cross-section of dorsal skin from 4-wk-old Mmp14+/lacZ processed for β-galactosidase activity with Mmp14 protein levels assessed by western blot (bar = 100 µm). E, epidermis; D, dermis; and H, hair follicle. (E) Skin isolated from 4-wk-old Mmp14+/+ or Mmp14−/− mice was fixed for TEM with live/dead fibroblasts indicated by arrowheads and arrows, respectively (bar = 2 µm), or stained for either active caspase-3 or TUNEL with PI counterstaining (positive cells are marked by arrows). Bar = 50 µm. TEM results are representative of two independent experiments performed while staining results are representative of three independent experiments performed. (F) Representative type I collagen immunostaining and TUNEL staining with nuclei counterstained red with PI of dorsal skin harvested from 4-wk-old wild-type mice versus that of Mmp2−/−, Mmp8−/−, Mmp13−/−, Mmp15−/−, and Mmp16−/− mice. Bar = 100 µm. Results representative of three independent experiments performed. (G) Percent TUNEL- and caspase-3–positive cells in dermal tissues recovered from dorsal skin of 4-wk-old wild-type and Mmp14 knockout mice. Results are expressed as the mean ± SEM of four independent experiments with P values determined by one-way ANOVA and Dunnett’s post-test. Source data are available for this figure: SourceData F1.
Figure S1.
Figure S1.
Mmp14-dependent control of dermal fibroblast senescence. (A) Representative micrographs of β-galactosidase staining (pH 6.0) of dorsal skin isolated from 18-day-old Mmp14+/+ or Mmp14−/− littermates (black arrows demarcate senescent cells) (bar = 200 µm). (B) Senescent cells were quantified in 10 or more randomly selected high power fields in three pairs of Mmp14+/+ or Mmp14−/− littermates (mean ± SEM).
Figure 2.
Figure 2.
Regulation of cell shape and survival by Mmp14 in 3-D culture. (A) Dermal fibroblasts isolated from newborn Mmp14+/+ or Mmp14−/− mice were cultured atop (2-D) or embedded within (3-D) type I collagen hydrogels for 2–120 h, fixed and stained for F-actin (phalloidin) with nuclear counterstaining (DAPI). Wild-type and knockout fibroblasts in 2-D culture are indistinguishable at the 120-h time point. In 3-D culture, wild-type and Mmp14-null fibroblasts display divergent shape changes with Mmp14−/− cells shedding F-actin–positive vesicles (bar = 100 µm). Results are representative of three independent experiments performed. (B) Mmp14+/+ or Mmp14−/− fibroblasts were embedded in 3-D collagen hydrogels for 120 h, fixed, and the cell–collagen interface visualized by SEM (bar = 10 µm) with pericellular collagen degradation products identified by immunofluorescence with anti-cleaved type I collagen antibody (bar = 20 µm). Results are representative of two independent experiments performed. (C) Caspase-3 activity of Mmp14+/+ versus Mmp14−/− fibroblasts cultured atop (2-D) or embedded within (3-D) type I collagen hydrogels in the absence or presence of 10 µM Z-VAD (mean ± SEM; n = 4 independent experiments) with P values determined by two-way ANOVA and Tukey post-test. AFU, active fluorescent units. (D) Time-dependent increase in TUNEL staining in Mmp14+/+ versus Mmp14−/− fibroblasts cultured in the absence or presence of 10 µM Z-VAD (mean ± SEM; n = 4 independent experiments) with P values determined by two-way ANOVA and Tukey post-test. (E and F) Fibroblasts were isolated from newborn Mmp14+/+ or Mmp14−/− skin and embedded in type I collagen hydrogels as either an unsorted population (all cells) or following FACS into papillary or reticular fibroblast fractions. Following a 5-day culture period, cells were stained for F-actin with DAPI counterstaining (bar = 100 μm) (E) or TUNEL-stained and quantified (F) (mean ± SEM; n = 4 independent experiments) with P values determined by two-way ANOVA and Tukey post-test.
Figure S2.
Figure S2.
Mmp14-dependent regulation of fibroblast function in 2-D culture. (A) Confocal images of Mmp14+/+ and Mmp14−/− fibroblasts were cultured atop cover glass slips and stained for F-actin with phalloidin (DAPI counterstain), vimentin, or lamin A/C (bar = 50 µm). (B) Western blot analysis of lamin A/C expression in Mmp14+/+ fibroblasts relative to Mmp14−/− fibroblasts with GAPDH used as the loading control. Relative expression levels are shown as determined by densitometry. (C) p21 expression levels as assessed by western blot analysis in Mmp14+/+ versus Mmp14−/− fibroblasts with GAPDH used as the loading control. Relative expression levels are shown as determined by densitometry. (D) Mmp14+/+ and Mmp14−/− fibroblasts were cultured atop type I collagen hydrogels (identical to those used for 3-D culture) for 5 days and monitored for TUNEL staining (mean ± SEM; n = 3 independent experiments) as determined by Student’s t test. (E and F) Immunofluorescence staining of γ-H2AX in fibroblasts isolated from Mmp14+/+ and Mmp14−/− littermates (bar = 50 μm) (E) with the percentage of γ-H2AX–positive nuclei (mean ± SEM with P value determined by Student’s t test) quantified in 10 randomly selected high-powered fields from three independent experiments (F). (G) γ-H2AX protein expression levels in Mmp14+/+ or Mmp14−/− fibroblasts in 2-D culture as quantified by western blot, using β-actin as the loading control. Relative expression levels are shown as determined by densitometry. (H) Mmp14 wild-type and knockout cells were cultured in 3-D collagen hydrogels and the percent dendritic and blebbing cells quantified in 10 random fields in four independent experiments with results presented as mean ± SEM with P value determined by Student’s t test. Source data are available for this figure: SourceData FS2.
Figure 3.
Figure 3.
Mmp14-dependent pericellular proteolysis and the regulation of fibroblast survival. (A) Schematic diagram of Mmp14 with prodomain, an RXKR-furin recognition sequence that directs proenzyme activation, catalytic, linker, hemopexin, transmembrane as well as cytosolic tail domains highlighted. MMP14 mutants were engineered with an inactivating point mutation (E240→A) inserted in the catalytic domain (MMP14EA), the hemopexin or cytosolic tail deleted (i.e., MMP14ΔHPX and MMP14ΔCT), the MMP14 pro– and catalytic domains replaced with the pro- and catalytic domains of human MMP-1 wherein an RXKR sequence was inserted at the terminus of the pro-domain and the MMP14 hemopexin domain retained or deleted (i.e., MMP14MMP-1CAT and MMP14MMP1/CAT/ΔHPX) or the MMP14 transmembrane and cytosolic tail deleted (i.e., MMP14ΔTM). (B) Mmp14−/− fibroblasts were transduced with control, wild-type MMP14, or mutant MMP14 constructs, embedded in 3-D collagen hydrogels, and cultured for 5 days in the absence or presence of TIMP-2 (3 µg/ml). TUNEL-positive cells were then enumerated (mean ± SEM; n = 4 independent experiments) with P values determined by one-way ANOVA and Tukey post-test. (C and D) Mmp14+/+ or Mmp14−/− fibroblasts were embedded in 3-D type I collagen hydrogels prepared from borohydride-reduced or pepsin-hydrolyzed collagen trimers and cultured for 5 days in the absence or presence of TIMP-2 (3 µg/ml). Cells were then phalloidin-stained with DAPI counterstaining (C) (bar = 50 µm) and the percent TUNEL-positive fibroblasts determined in D (mean ± SEM; n = 4 independent experiments) with P values determined by two-way ANOVA and Tukey post-test. (E) Mmp14+/+ or Mmp14−/− fibroblasts were embedded in Mmp14-degradable or non-degradable PEG-based hydrogels for 5 days and then stained for F-actin and TUNEL (bar = 50 µm). The percentage of TUNEL-positive cells is shown in panel D (mean ± SEM; n = 4 independent experiments).
Figure S3.
Figure S3.
Mmp14-dependent pericellular proteolysis and the regulation of fibroblast survival. (A) Mmp14−/− fibroblasts were transduced with a control expression vector, wild-type, or mutant MMP14 constructs as described in Fig. 3 and cultured for 5 days in 3-D collagen hydrogels prior to in situ F-actin/nuclear staining (bar = 100 μm). Results are representative of three experiments performed. (B and C) Dermal fibroblasts isolated from Mmp14f/f mice were transduced with adeno-βgal or adeno-Cre expression vectors and embedded in collagen hydrogels for 5 day before F-actin (B) (bar = 100 µm) or TUNEL staining/quantification (mean ± SEM; n = 3 independent experiments) (C). The ability of TIMP-2 (3 µg/ml) to induce apoptosis in Mmp14+/+ fibroblasts is shown in panel C. Mean ± SEM (n = 3 independent experiments). One-way ANOVA and Dunett’s post-test.
Figure 4.
Figure 4.
Postnatal maturation of the dermal extracellular matrix. (A and B) (A) Dorsal skin was harvested from 1-, 7-, 14-, and 28-day-old Mmp14+/+ or Mmp14−/− mice, and type I collagen was visualized by immunofluorescence (with PI counterstaining) and apoptotic cells were detected as TUNEL-positive cells (bar = 50 µm). Results are representative of three independent experiments performed. In panel B, results are quantified as the percentage of positive cells in 10 random fields of tissue sections isolated from three mice (mean ± SEM; n = 3 independent experiments) with P values determined by two-way ANOVA and Tukey post-test. (C) Collagen levels were quantified by hydroxyproline assay (mean ± SEM; n = 3) with P values determined by two-way ANOVA and Tukey post-test. (D) The left panel is a schematic of the injection of wild-type or Mmp14 knockout dermal fibroblasts injected into wild-type skin explants and cultured atop the chick chorioallantoic membrane (CAM). In the panel to the right, Mmp14+/+ or Mmp14−/− dermal fibroblasts (labeled with green microspheres) were injected into normal skin explants harvested from 1-, 7-, 14-, and 28-day-old wild-type mice and cultured atop the chorioallantoic membrane of live chick embryos for 5 days. TUNEL-positive cells in explant cross-sections (red) are marked by white arrows (bar = 20 µm). (E) Number of TUNEL-positive cells as quantified in high power fields taken from 10 randomly selected sections. Results are expressed as the mean ± SEM (n = 4 independent experiments) with P values determined by two-way ANOVA and Tukey post-test. (F and G) Mmp14+/+ or Mmp14−/− fibroblasts were embedded in increasingly dense type I collagen hydrogels (0.5–3.5 mg/ml) and stained for F-actin (bar = 100 µm) (F) or TUNEL-positive cells (G). Results are expressed as the mean ± SEM (n = 4 independent experiments) with P values determined by two-way ANOVA and Tukey post-test.
Figure S4.
Figure S4.
Postnatal maturation of the dermal extracellular matrix. (A) Second harmonic generation (SHG) imaging (backward and forward scatter) of type I collagen in skin cross-sections recovered from 2-wk-old Mmp14+/+ or Mmp14−/− mice (bar = 20 μm). SEM and TEM imaging of the dermis illustrates an extensive array of collagen bundles surrounding fibroblasts (bar = 2 μm). (B) Higher magnification of SEM and TEM images highlight similar architecture of collagen bundles and size in dermal tissue recovered Mmp14+/+ and Mmp14−/− mice (SEM, bar = 1 µm; TEM, bar = 200 nm). (C) Diameter of collagen fibers was quantified in five random fields of captured TEM images in a wild-type versus a null littermate. Results are representative of two experiments.
Figure 5.
Figure 5.
Transcriptional profiling and functional analyses identify defects in β1 integrin signaling in Mmp14−/− fibroblasts. (A) Heatmap displaying a scaled expression of differentially expressed genes (DEGs; P value <0.05; fold change [FC] > 1.5 or less-than −1.5; average expression >25 counts) between wild-type (WT) and Mmp14 knockout (KO) fibroblasts embedded in 3D type I collagen for 48 h. (B) Heatmap displaying differentially expressed genes grouped by pathways identified as downregulated in Mmp14-null fibroblasts via pathway analysis of Gene Ontology biological processes and Kyoto Encyclopedia of Genes and Genomes pathway gene sets. (C) Mmp14+/+ or Mmp14−/− fibroblasts were embedded in type I collagen hydrogels, and after a 36-h culture period, stained for total β1 integrin, activated β1 integrin (bar = 25 µm), or pFAK and F-actin (bar = 50 µm). Results are representative of three or more experiments. (D) Rho-GTP levels were determined by immunocapture and western blot (results representative of two independent experiments performed). Relative expression levels are shown as determined by densitometry. (E and F) Wild-type (WT), Mmp14 knockout (KO) cells, or MMp14 KO cells were transduced with a constitutively active G429N β1 integrin mutant, embedded in 3-D collagen hydrogels for 120 h, and the percent TUNEL-positive and caspase-3–positive cells determined. Data are presented as mean ± SEM (n = 6 independent experiments) with P values determined by one-way ANOVA and Tukey post-test. Source data are available for this figure: SourceData F5.
Figure 6.
Figure 6.
A TGF-β/JNK cascade induces fibroblast apoptosis. (A) Mmp14+/+ or Mmp14−/− fibroblasts were embedded in type I collagen hydrogels, and the pericellular rigidity of the matrices was monitored by optical tweezer-based active microrheology either near (<5 µm) or distant (>100 µm) from the fibroblasts. Elastic modulus values (G′) of beads at 6 and 50 h are shown. Each point represents the average G′ (across frequencies) for each bead. Results are presented as mean ± SEM, *P < 0.05; two-way ANOVA and Tukey post test. (B and C) Relative mRNA levels of TGF-β isoforms (B), TGF-β protein levels (B inset), and active TGF-β1 levels (C) expressed in Mmp14+/+ or Mmp14−/− fibroblasts embedded in 3-D type I collagen hydrogels for 24 h. Results are representative of two independent experiments performed in panel B and three independent experiments with mean ± SEM as assessed by Student’s t test in panel C. Relative expression levels for western blot (B) are shown as determined by densitometry. (D) Western blot of pSMAD2, p-p38, pERK, and total ERK (T-ERK) levels in Mmp14+/+ or Mmp14−/− fibroblasts cultured in 3-D collagen for 24 h (results representative of three independent experiments performed). Relative expression levels for western blots are shown as determined by densitometry. (E) pJNK1,2 and total JNK1,2 (T-JNK) levels in Mmp14+/+ versus Mmp14−/− fibroblasts embedded in 3-D native or pepsin-extracted collagen hydrogels for 24 h as determined by western blot analysis. Relative expression levels for western blots are shown as determined by densitometry. Results are representative of three independent experiments performed. (F) pJNK levels in Mmp14+/+ or Mmp14−/− fibroblasts embedded in 3-D type I collagen hydrogels in the absence or presence of the JNK inhibitor, SP600125, for 24 h as determined by western blot. Relative expression levels for western blots are shown as determined by densitometry. Results are representative of three independent experiments performed. (G and H) Mmp14+/+ or Mmp14−/− fibroblasts were cultured in native, 3-D collagen hydrogels in the absence or presence of either anti-TGF-β antibodies, the MEK inhibitor, PD325901, or SP600125 for 5 days and TUNEL-positive cells (G) and caspase-3 activity (H) quantified. Results are expressed as a mean ± SEM (n = 4 independent experiments) with P values determined by two-way ANOVA and Turkey post-test. AFU, active fluorescent units. Source data are available for this figure: SourceData F6.
Figure S5.
Figure S5.
A TGF-β/JNK cascade induces fibroblast apoptosis. (A) Western blot of pJNK expression levels as assessed by western blot in lysates prepared from Mmp14+/+ or Mmp14−/− fibroblasts cultured atop (2-D) type I collagen hydrogels with β-actin used as the loading control. Results representative of two experiments performed. Relative expression levels are shown as determined by densitometry. (B) pJNK immunostaining and TUNEL staining of wild-type versus null fibroblasts in 2-D relative to 3-D collagen hydrogel culture (bar = 25 μm). Results representative of three experiments performed. (C and D) Mmp14+/+ or Mmp14−/− fibroblasts were embedded in collagen hydrogels in the absence or presence of exogenous TGF-β1 (10 ng/ml) for 5 days with JNK activation and TUNEL staining monitored by fluorescent imaging (bar = 25 µm) (C) and quantified in D (mean ± SEM; n = 3 independent experiments). Two-way ANOVA and Tukey post-test. (E) pJNK levels in dermal tissue lysates recovered from 3-wk-old wild-type versus Mmp14−/− mice (n = 2). Relative expression levels are shown as determined by densitometry. (F) TGF-β protein levels in 3-D cultures of Mmp14+/+ fibroblasts under stressed or stressed/relaxed conditions in the absence or presence of SP600125 as assessed by western blot. Results representative of three experiments performed. Relative expression levels are shown as determined by densitometry. (G) Mmp14+/+ fibroblasts were cultured in 3-D collagen hydrogels under stressed or stressed/relaxed conditions in the absence or presence of SP600125 and the number of pJNK- and TUNEL-positive cell quantified in five or more randomly selected cross-sections of the gel in three independent experiments (mean ± SEM). Two-way ANOVA and Tukey post-test. Source data are available for this figure: SourceData FS5.
Figure 7.
Figure 7.
A TGF-β/JNK axis regulates Mmp14−/− dermal apoptosis in vivo. (A and B) Active and total β1 integrin expression in skin cross-sections of 3-wk-old wild-type versus Mmp14-null mice as assessed by immunofluorescence in panel A (red; bar = 50 µm) and following quantitative image analysis (B). Results are expressed as the mean ± SEM; n = 4 independent experiments as assessed by Student’s t test. (C) Western blot of Rho-GTP levels in skin extract of 3-wk-old wild-type versus Mmp14-null mice. Relative expression levels for western blots are shown as determined by densitometry. Results representative of two independent experiments performed. (D and E) pJNK and TUNEL in cross-sections of dorsal skin excised from 3-wk-old wild-type versus Mmp14-null mice treated with either IgG or anti-TGF-β neutralizing antibody (D; all bars = 50 µm) or SP600125 for 3 wk (E; pJNK, bars = 5 µm and TUNEL, bars = 50 µm). Data are representative of two independent experiments performed, each with n = 3 mice. (F) Quantification of pJNK- and TUNEL-positive cells from C and D (n = 3 independent experiments). Data are presented as mean ± SEM (n = 4 independent experiments) with P values determined by two-way ANOVA and Turkey post-test. Source data are available for this figure: SourceData F7.
Figure S6.
Figure S6.
Fibroblast-mediated degradation of r/r collagen. Mouse dermal fibroblasts recovered from wild-type or Mmp14 knockout mice were cultured atop acid-solubilized mouse tail wild-type or r/r type I collagen matrices for 48 h in the absence or presence of 5 µg of TIMP-1 or TIMP-2 for 48 h. At the end of the culture period, fibroblasts were lysed and the collagen gel stained and destained with Coomassie blue. Wild-type, but not Mmp14 knockout, fibroblasts degraded the subjacent wild-type collagen matrix via a process sensitive to TIMP-2, but not TIMP-1. By contrast, wild-type, but not Mmp14 knockout, fibroblasts degraded r/r collagen via a process inhibitable by both TIMP-1 and TIMP-2. Results representative of four independent experiments.
Figure 8.
Figure 8.
Schematic overview of the Mmp14 dermal fibroblast survival program. During early postnatal development of the dermis, type I collagen–embedded fibroblasts undergo shape changes driven by Mmp14-dependent pericellular proteolysis of the surrounding matrix that coincidentally triggers β1 integrin activation, thereby setting in motion a cascade of mechanotransduction-linked events, including increased pFAK and Rho-GTP kinase levels, and increased cytoskeletal tension as well as matrix rigidity that together maintain cell survival. By contrast, in the absence of Mmp14-dependent pericellular collagenolysis, dermal fibroblasts are encased in a matrix that limits cell spreading and all of the associated mechanotransduction-linked steps, resulting in the loss of cytoskeletal tension and an inability to increase ECM rigidity. Via unknown mechanisms similar to those observed in wound healing, the absence of cell–matrix tension triggers an increase in TGF-β expression and activation that then actuates a pJNK-dependent apoptotic program.
Figure S7.
Figure S7.
Expression and collagenolytic activity of MMP14 mutant constructs. (A) Wild-type, Mmp14-null, or transduced Mmp14-null fibroblasts expressing various MMP14 expression vectors were subjected to western blot analysis with a polyclonal anti-MT1-MMP antibody directed against the catalytic domain of MMP14 or an anti-HA antibody to detect HA-tagged MMP14 mutant constructs. Following transduction, MMp14-null fibroblasts expressed MT1-MMP at levels comparable to wild-type levels of endogenous Mp14 (far left panel). In the middle panel, Mmp14-null fibroblasts were transduced with each of the listed mutants, demonstrating comparable expression levels, save for the transmembrane-deleted construct (dTM) where the bulk of the protein is secreted into the medium. In the far right panel, Mmp14 knockout fibroblasts were transduced with HA-tagged MT1-MMP or HA-tagged MMP1 chimera expression vectors (the polyclonal MT1-MMP antibody used in the preceding blots is primarily directed against the MT1-MMP catalytic domain, which has been replaced with that of MMP1). In this case, both of the MMP1 chimeric mutants, with or without the Mmp14 hemopexin domain, are expressed at near normal levels. Results are representative of two or more experiments performed. (B) Wild-type (WT), Mmp14 knockout (KO), or transduced Mmp14 mouse dermal fibroblasts were embedded in 3-D type I collagen hydrogels and cultured for 48 h. At the end of the culture period, Col1 3/4C staining was performed and degradation quantified using ImageJ (bar = 100 μm). Immunostaining results are representative of three independent experiments performed while degradation results are presented as the mean ± SEM of three independent experiments. One-way ANOVA and Dunnett post-test. Source data are available for this figure: SourceData FS7.

Similar articles

References

    1. Alabi, A., Xia X.-D., Gu H.-M., Wang F., Deng S.-J., Yang N., Adijiang A., Douglas D.N., Kneteman N.M., Xue Y., et al. . 2021. Membrane type 1 matrix metalloproteinase promotes LDL receptor shedding and accelerates the development of atherosclerosis. Nat. Commun. 12:1889. 10.1038/s41467-021-22167-3 - DOI - PMC - PubMed
    1. Andrews, S. 2010. FastQC: A Quality Control Tool for High Throughput Sequence Data.
    1. Arai, K.Y., Hara T., Nagatsuka T., Kudo C., Tsuchiya S., Nomura Y., and Nishiyama T.. 2017. Postnatal changes and sexual dimorphism in collagen expression in mouse skin. PLoS One. 12:e0177534. 10.1371/journal.pone.0177534 - DOI - PMC - PubMed
    1. Birukawa, N.K., Murase K., Sato Y., Kosaka A., Yoneda A., Nishita H., Fujita R., Nishimura M., Ninomiya T., Kajiwara K., et al. . 2014. Activated hepatic stellate cells are dependent on self-collagen, cleaved by membrane type 1 matrix metalloproteinase for their growth. J. Biol. Chem. 289:20209–20221. 10.1074/jbc.M113.544494 - DOI - PMC - PubMed
    1. Bouffard, N.A., Cutroneo K.R., Badger G.J., White S.L., Buttolph T.R., Ehrlich H.P., Stevens-Tuttle D., and Langevin H.M.. 2008. Tissue stretch decreases soluble TGF-beta1 and type-1 procollagen in mouse subcutaneous connective tissue: Evidence from ex vivo and in vivo models. J. Cell. Physiol. 214:389–395. 10.1002/jcp.21209 - DOI - PMC - PubMed