. 2024 Aug 19;37(8):1246-1268.
doi: 10.1021/acs.chemrestox.3c00312. Epub 2024 Jul 11.

Nicotinamide riboside Induced Energy Stress and Metabolic Reprogramming in BEAS-2B Cells

Affiliations

Nicotinamide riboside Induced Energy Stress and Metabolic Reprogramming in BEAS-2B Cells

Everson Willian Fialho Cordeiro et al. Chem Res Toxicol. .

Abstract

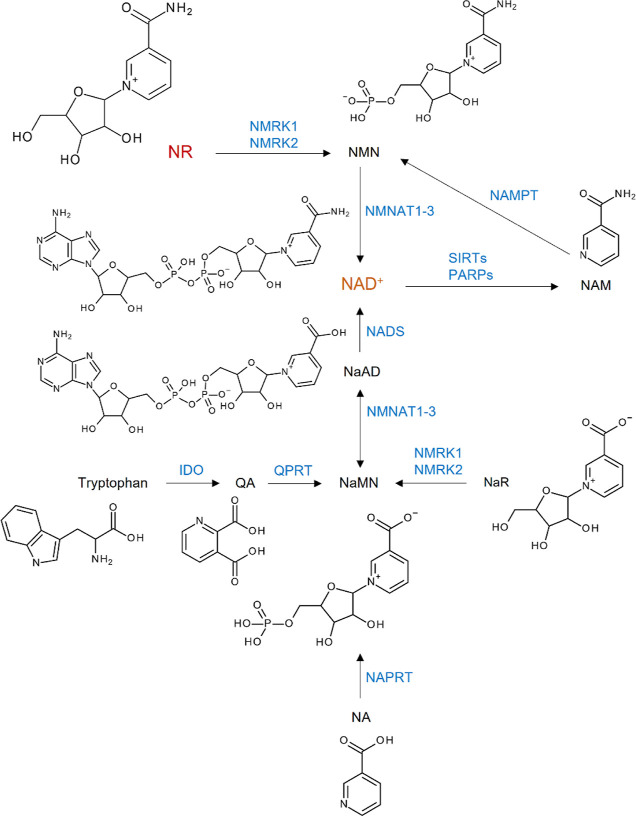
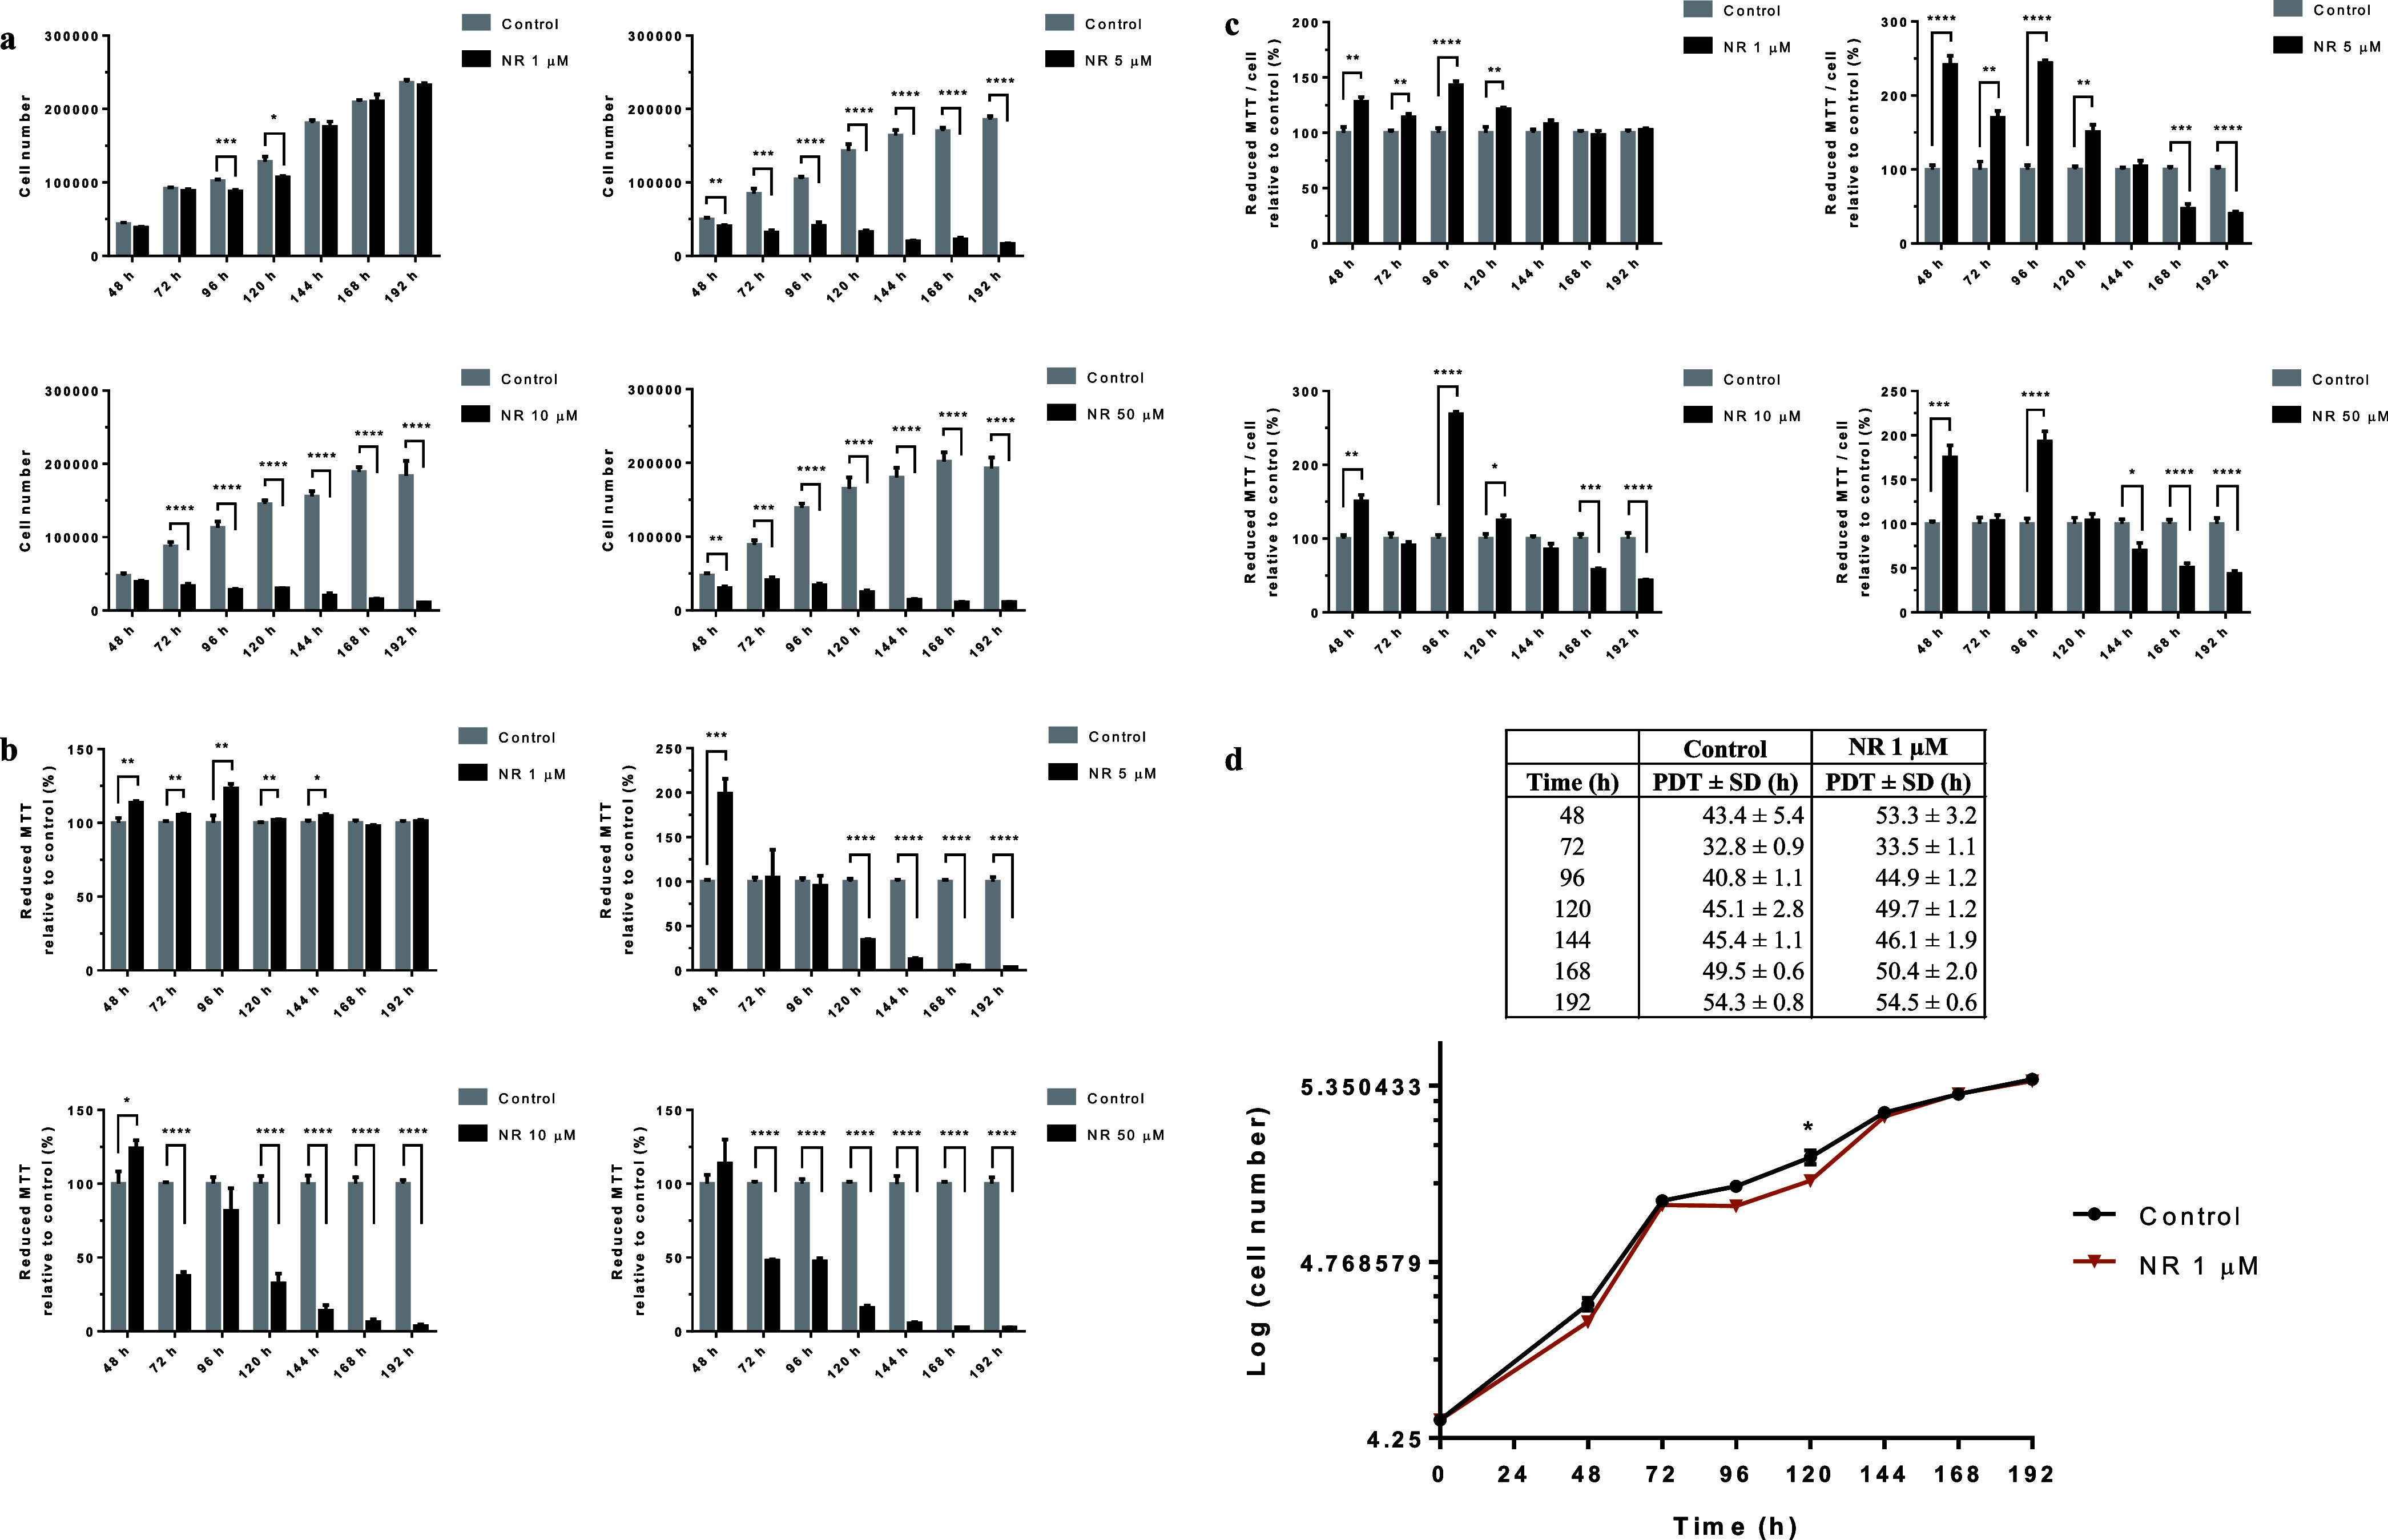
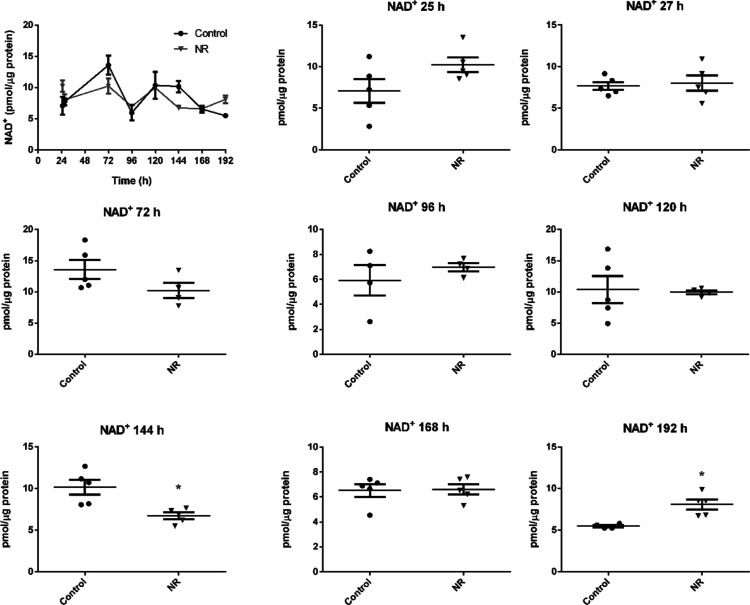
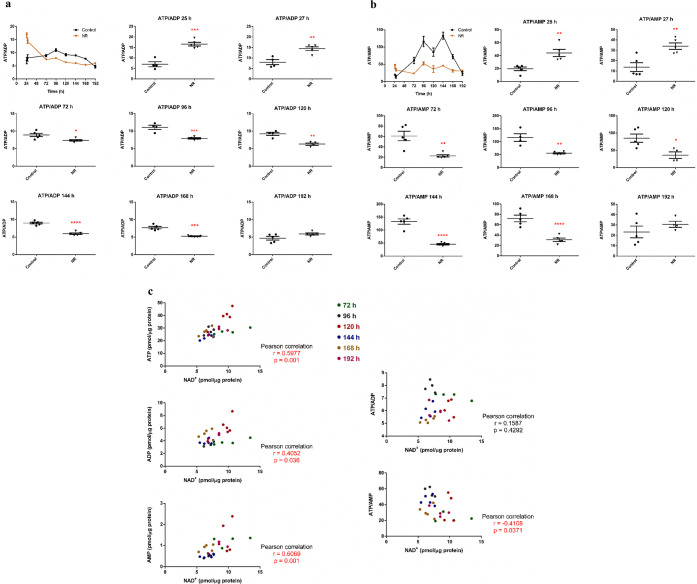
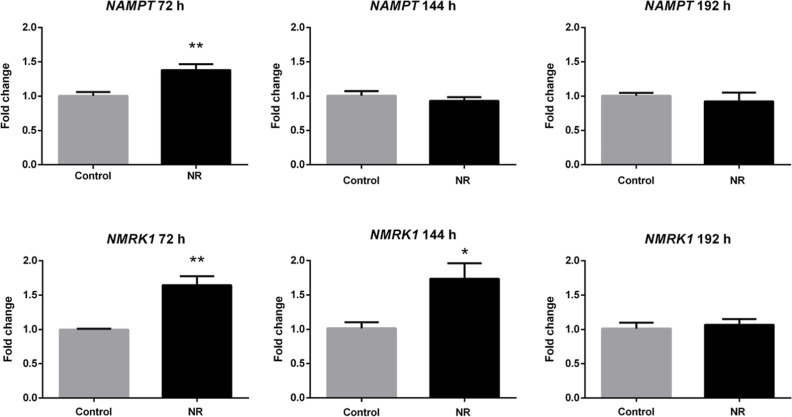
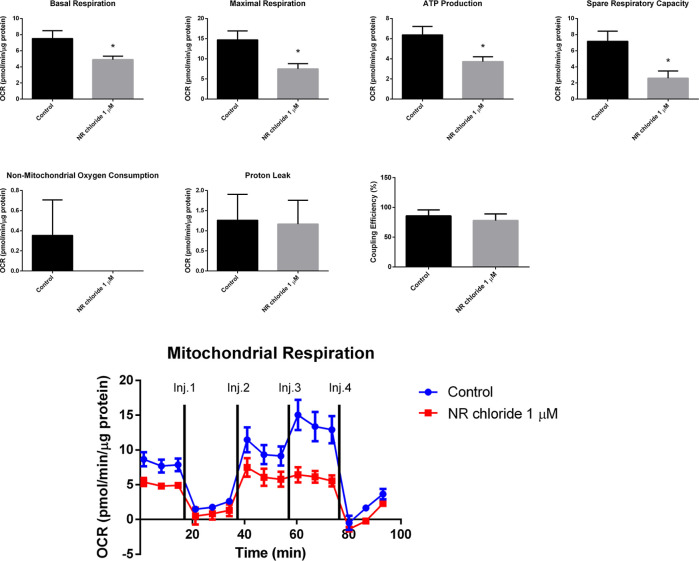
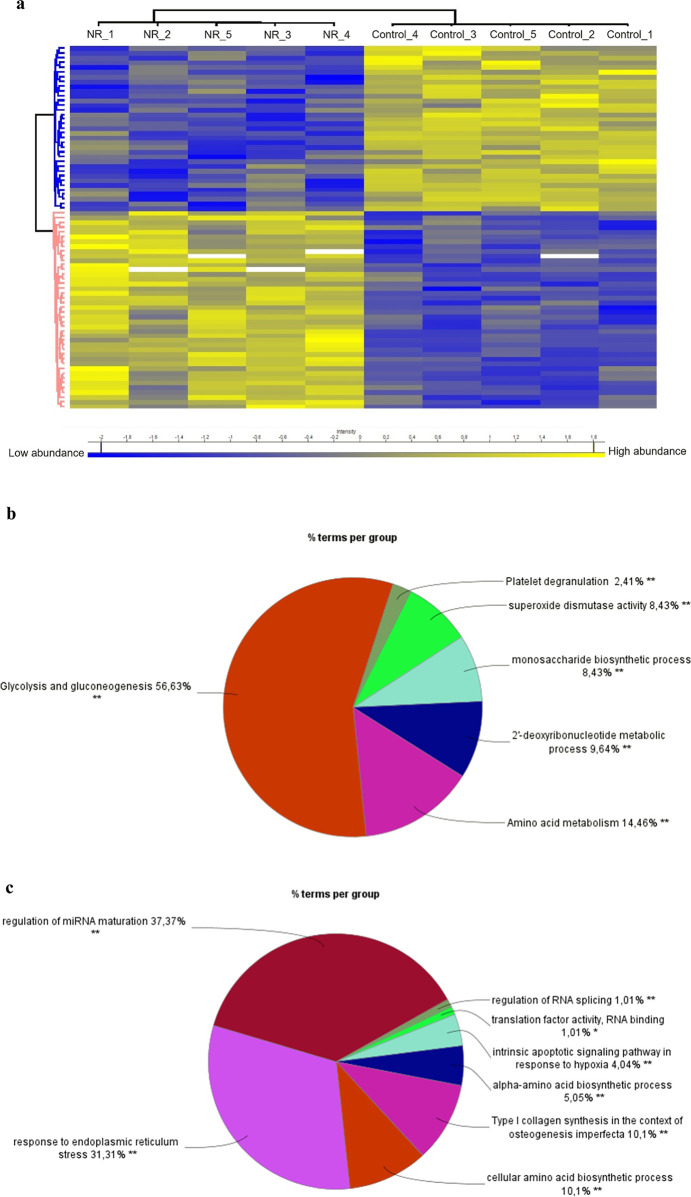
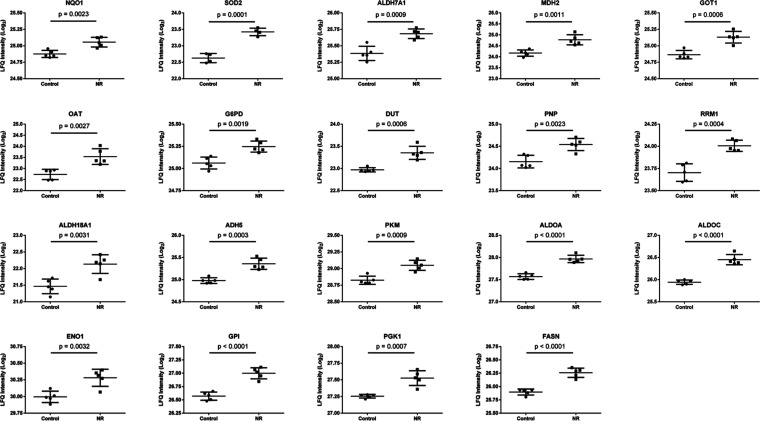
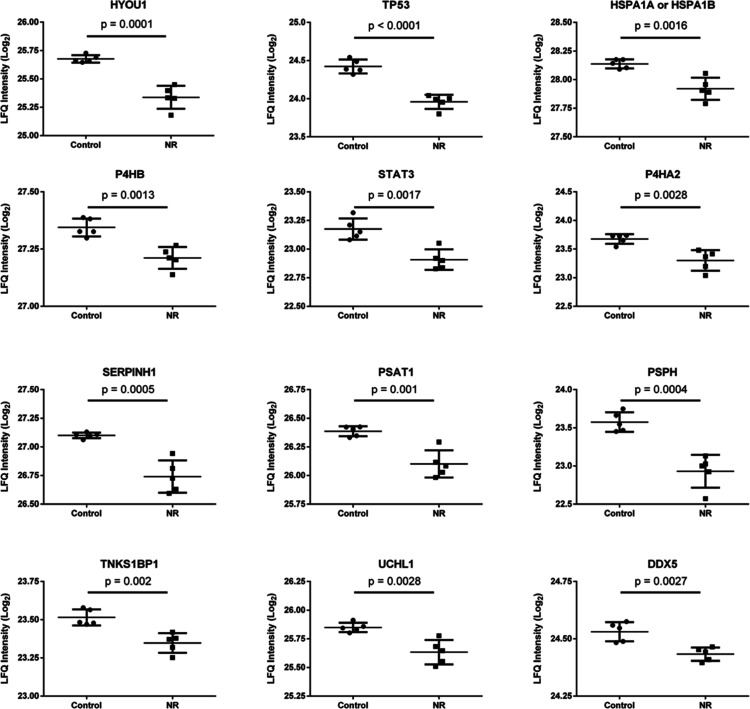
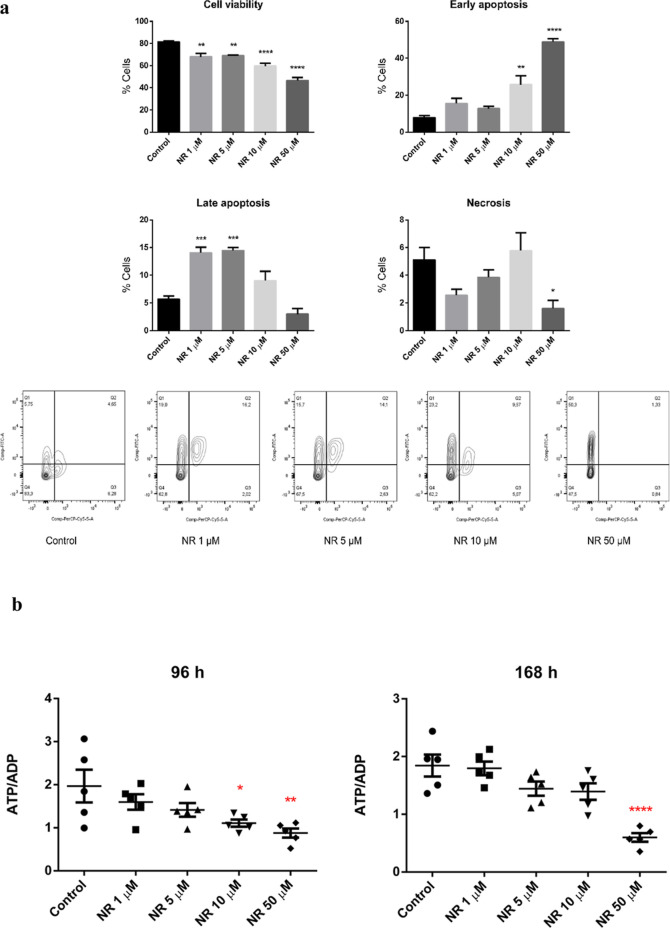
Nicotinamide riboside (NR), a NAD+ precursor, has received attention due to several health benefits it has induced in experimental models. Studies in cultured cells, animals, and humans consistently show increased NAD+ availability after NR supplementation, which is considered the only mode of NR action that leads to health benefits. In the present study, we show that a persistently low NR concentration (1 μM) in the growth medium of BEAS-2B human cells, grown in a monolayer, induces energy stress, which precedes a cellular NAD+ increase after 192 h. NR concentrations greater than 1 μM under the specified conditions were cytotoxic in the 2D cell culture model, while all concentrations tested in the 3D cell culture model (BEAS-2B cell spheroids exposed to 1, 5, 10, and 50 μM NR) induced apoptosis. Shotgun proteomics revealed that NR modulated the abundance of proteins, agreeing with the observed effects on cellular energy metabolism and cell growth or survival. Energy stress may activate pathways that lead to health benefits such as cancer prevention. Accordingly, the premalignant 1198 cell line was more sensitive to NR cytotoxicity than the phenotypically normal parent BEAS-2B cell line. The role of a mild energy stress induced by low concentrations of NR in its beneficial effects deserves further investigation. On the other hand, strategies to increase the bioavailability of NR require attention to toxic effects that may arise.


Conflict of interest statement

The authors declare no competing financial interest.

Figures

Figure 1
Figure 1
Pathways for NAD+ generation. QA, quinolinic acid; NaMN, NA mononucleotide; NA, nicotinic acid; NaR, NA riboside; NaAD, NA adenine dinucleotide; NAM, nicotinamide; NMN, NAM mononucleotide; NR, NAM riboside; NAD+, NAM adenine dinucleotide; IDO, indoleamine 2,3-dioxygenase; QPRT, quinolinic acid phosphoribosyl transferase; NAPRT, NA phosphoribosyltransferase; NMRK, NAM riboside kinase; NMNAT, NAM mononucleotide adenylyltransferase; NADS, NAD synthase; NAMPT, NAM phosphoribosyltransferase; SIRTs, sirtuins; PARPs, poly(ADP-ribose)polymerases.
Figure 2
Figure 2
NR obtained from alkaline phosphatase hydrolysis of the NAM mononucleotide. (a) Chromatogram of the purified NR (λ = 266 nm) and its absorbance spectrum. (b) NR high-resolution mass spectra obtained in MS1 and MS2. (c) NR stability assessment in the cell-free culture medium at 37 °C.
Figure 3
Figure 3
NR affects BEAS-2B cell growth at concentrations above 1 μM in the culture grown in a monolayer. (a) CVD assay of the cells exposed to the indicated NR concentrations in the time range from 48 to 192 h. (b) Cell viability assessed by the MTT assay. (c) Reductive capacity of MTT in each cell. (d) Growth curves of the cells exposed or not to 1 μM NR. PDT, cell population doubling time. Statistics of (a–c): unpaired t-test, N = 4 or 5. The experiments with the different NR concentrations were performed independently in different periods. Statistics of (d): multiple t tests. *p < 0.05, **p < 0.01, ***p < 0.001, ****p < 0.0001.
Figure 4
Figure 4
NR arrests BEAS-2B cell cycle in the G2/M phase depending on the concentration and the exposure duration in the culture grown in monolayer. Effects of (a) 1 μM NR and (b) 10 μM NR on the cell cycle at the indicated time points. Only cells adhered to the culture plates were used. Asterisks indicate the significant differences between the exposed and control cells in each cell cycle phase. Multiple t tests in each time point, N = 4, *p < 0.05.
Figure 5
Figure 5
NR at the daily concentration of 1 μM increases BEAS-2B cells NAD+ content only after 192 h in the culture grown in a monolayer. The first panel gives the general view in the 24–192 h range. The other panels show the comparisons between the control and the NR exposed cells in each time point. Unpaired t-test with Welch’s correction, N = 4 or 5. *p < 0.05. The experiment results are representative of two independent experiments performed in the interval of 6 months.
Figure 6
Figure 6
NR at the daily concentration of 1 μM induces energy stress in BEAS-2B cells from 72 to 168 h of exposure in the culture grown in a monolayer. The first panel in (a,b) gives the general view in the 24–192 h range. The other panels show the comparisons between the control and the NR exposed cells in each time point. (a) ATP/ADP ratios. Unpaired t-test with Welch’s correction, N = 4 or 5. (b) ATP/AMP ratios. Unpaired t-test with Welch’s correction, N = 4 or 5. (c) Correlation analyses of the levels of ATP, ADP, AMP, ATP/ADP, and ATP/AMP with the NAD+ content in the NR-exposed cells in the 72–192 h interval. The significant correlations are shown in red. *p < 0.05, **p < 0.01, ***p < 0.001, ****p < 0.0001. The experiment results are representative of two independent experiments performed in the interval of 6 months.
Figure 7
Figure 7
NR at the daily concentration of 1 μM induces the expression of NAM phosphoribosyltransferase (NAMPT) and NAM riboside kinase 1 (NMRK1) genes in BEAS-2B cells grown in a monolayer. Unpaired t-test, N = 5, *p < 0.05, **p < 0.01.
Figure 8
Figure 8
NR chloride at the daily concentration of 1 μM decreases mitochondrial respiration in BEAS-2B cells after 96 h of exposure in the culture grown in a monolayer. Oxygen consumption rate was detected under basal conditions followed by the sequential addition of oligomycin (Inj. 1), CCCP (two injections, Inj. 2 and Inj. 3), and rotenone + antimycin A (Inj. 4). Basal respiration, maximal respiration, ATP production rate, spare respiratory capacity, nonmitochondrial oxygen consumption, proton leak, and coupling efficiency were calculated using the Wave Desktop and Controller 2.6 software of the Seahorse analyzer. Unpaired t-test; control, N = 3; NR chloride, N = 4. *p < 0.05.
Figure 9
Figure 9
NR at the daily concentration of 1 μM modulates the abundance of proteins in BEAS-2B cells after 144 h of exposure in the culture grown in a monolayer. (a) Heatmap showing the 77 differentially abundant proteins (42 proteins more abundant in the NR group and 35 proteins more abundant in the control group). The protein names and gene symbols for each row of the heatmap are displayed in the same order in Table S2. Yellow, high abundance; blue, low abundance. (b) Overview of the significant groups of biological processes and pathways that resulted from the pathway enrichment analysis of the 42 more abundant proteins in the NR group. (c) Overview of the significant groups of biological processes and pathways that resulted from the pathway enrichment analysis of the 35 less abundant proteins in the NR group. Perseus software (version 2.0.11) was used for proteomics data processing and heatmap visualization. The ClueGo tool (version 2.5.10) of the Cytoscape software (version 3.10.1) was used for pathway enrichment analyses. Ontologies selected: WikiPathways, REACTOME_Pathways, GO_BiologicalProcess.
Figure 10
Figure 10
Nineteen proteins associated with 46 representative terms and pathways selected among the significant terms and pathways of Table S3 and Figure S4). Selection criteria: at least 2 genes from the loaded list associated with a term (number genes) and representing at least 5% of the total number of genes in the term (% associated genes). The proteins belong to the cluster of 42 more abundant proteins in the NR group. See Table S4 for protein names and functions.
Figure 11
Figure 11
Twelve proteins associated with 36 representative terms and pathways selected among the significant terms and pathways of Table S5 and Figure S5. Selection criteria: at least 2 genes from the loaded list associated with a term (number genes) and representing at least 5% of the total number of genes in the term (% associated genes). The proteins belong to the cluster of 35 less abundant proteins in the NR group. See Table S6 for protein names and functions.
Figure 12
Figure 12
NR chloride (NR) induced (a) apoptosis and (b) energy stress in BEAS-2B cell spheroids. The spheroids were exposed daily to the indicated concentrations of NR chloride. The viability and type of cell death were assessed after 168 h of exposure. Q1, early apoptosis; Q2, late apoptosis; Q3, necrosis; Q4, viable cells. The ATP/ADP ratio was assessed after 96 and 168 h of exposure. Statistics of (a): one-way ANOVA with Dunnett’s multiple comparisons test, N = 4 (control, NR 1, 5, 10 μM) or N = 3 (NR 50 μM). Statistics of (b): one-way ANOVA with Dunnett’s multiple comparisons test, N = 5. *p < 0.05, **p < 0.01, ***p < 0.001, ****p < 0.0001.
Figure 13
Figure 13
NR is preferentially toxic to the premalignant 1198 cell line in the cultures grown in a monolayer. The first two panels show the cell number obtained by the CVD assay for each NR concentration and time point of daily exposure. The calculated lethal concentration for 50% of the cells (LC50) is shown above each time point. The last panel shows the growth curves of BEAS-2B and 1198 cell lines exposed or not to 2 μM NR. Asterisks indicate the significant differences between the exposed and control cells of each cell line. First two panels’ statistics: two-way ANOVA with Dunnett’s multiple comparisons test, N = 4 or 5. Last panel’s statistics: two-way ANOVA with Tukey’s multiple comparisons test, N = 5, *p < 0.05, **p < 0.01, ****p < 0.0001.

Similar articles

References

    1. Yang T.; Chan N. Y.; Sauve A. A. Syntheses of nicotinamide riboside and derivatives: effective agents for increasing nicotinamide adenine dinucleotide concentrations in mammalian cells. J. Med. Chem. 2007, 50 (26), 6458–6461. 10.1021/jm701001c. - DOI - PubMed
    1. Bieganowski P.; Brenner C. Discoveries of nicotinamide riboside as a nutrient and conserved NRK genes establish a Preiss-Handler independent route to NAD+ in fungi and humans. Cell 2004, 117 (4), 495–502. 10.1016/S0092-8674(04)00416-7. - DOI - PubMed
    1. Trammell S. A.; Yu L.; Redpath P.; Migaud M. E.; Brenner C. Nicotinamide riboside is a major NAD+ precursor vitamin in cow milk. J. Nutr. 2016, 146 (5), 957–963. 10.3945/jn.116.230078. - DOI - PMC - PubMed
    1. Bogan K. L.; Brenner C. Nicotinic acid, nicotinamide, and nicotinamide riboside: a molecular evaluation of NAD+ precursor vitamins in human nutrition. Annu. Rev. Nutr. 2008, 28, 115–130. 10.1146/annurev.nutr.28.061807.155443. - DOI - PubMed
    1. Rajman L.; Chwalek K.; Sinclair D. A. Therapeutic potential of NAD-boosting molecules: the in vivo evidence. Cell Metab. 2018, 27 (3), 529–547. 10.1016/j.cmet.2018.02.011. - DOI - PMC - PubMed

LinkOut - more resources