. 2024 Jul 11;22(7):e3002638.
doi: 10.1371/journal.pbio.3002638. eCollection 2024 Jul.

Multicellular magnetotactic bacteria are genetically heterogeneous consortia with metabolically differentiated cells

Affiliations

Multicellular magnetotactic bacteria are genetically heterogeneous consortia with metabolically differentiated cells

George A Schaible et al. PLoS Biol. .

Abstract

Consortia of multicellular magnetotactic bacteria (MMB) are currently the only known example of bacteria without a unicellular stage in their life cycle. Because of their recalcitrance to cultivation, most previous studies of MMB have been limited to microscopic observations. To study the biology of these unique organisms in more detail, we use multiple culture-independent approaches to analyze the genomics and physiology of MMB consortia at single-cell resolution. We separately sequenced the metagenomes of 22 individual MMB consortia, representing 8 new species, and quantified the genetic diversity within each MMB consortium. This revealed that, counter to conventional views, cells within MMB consortia are not clonal. Single consortia metagenomes were then used to reconstruct the species-specific metabolic potential and infer the physiological capabilities of MMB. To validate genomic predictions, we performed stable isotope probing (SIP) experiments and interrogated MMB consortia using fluorescence in situ hybridization (FISH) combined with nanoscale secondary ion mass spectrometry (NanoSIMS). By coupling FISH with bioorthogonal noncanonical amino acid tagging (BONCAT), we explored their in situ activity as well as variation of protein synthesis within cells. We demonstrate that MMB consortia are mixotrophic sulfate reducers and that they exhibit metabolic differentiation between individual cells, suggesting that MMB consortia are more complex than previously thought. These findings expand our understanding of MMB diversity, ecology, genomics, and physiology, as well as offer insights into the mechanisms underpinning the multicellular nature of their unique lifestyle.


Conflict of interest statement

The authors have declared that no competing interests exist.

Figures

Fig 1
Fig 1. Morphology and structure of MMB.
(A) Cartoon depicting the morphology and internal organization of an MMB consortium. At the center of each MMB consortium lies an acellular space that is surrounded by a single layer of cells. Each cell harbors magnetosome organelles (black polygons aligned along cytoskeleton-like filaments), compartments for carbon or energy storage (gray circles), as well as other, currently unidentified structures. Scale bar ca. 1 μm. (B) SEM image of 2 MMB magnetically enriched from LSSM, possibly undergoing division. Scale bar, 1 μm. (C) Backscatter electron microscopy image of magnetosome chains within MMB cells (arrow). Magnetosome minerals appear to have 4–8 visible facets and are approximately 30–60 nm in diameter. Scale bar, 300 nm. Contrast and brightness of image (C) was increased for better visualization. LSSM, Little Sippewissett Salt Marsh; MMB, multicellular magnetotactic bacteria; SEM, scanning electron microscopy.
Fig 2
Fig 2. Genomic and phylogenetic analysis of all publicly available MMB MAGs and the 22 SCMs generated in this study.
(A) Maximum-likelihood tree, inferred with FastTree, using a concatenated set of 6 conserved COGs present in all entries. Ultrafast bootstrap support values and selected genome statistics are listed. The color codes for the SCM Groups remain the same throughout all figures. (B) Average full-length 16S rRNA gene identity and (C) average genome nucleotide identity heat maps of the 8 newly identified MMB species compared to 2 available MMB reference genomes (Ca. M. multicellularis and Ca. Magnetomorum sp. HK-1). For a phylogenetic tree of all publicly available MMB 16S rRNA gene sequences, see S2 Fig. For an exhaustive sequence identity analyses of 16S rRNA and whole genomes of MMB, see S3–S5 Figs. The data underlying this figure can be found in Tables A and C in S2 Appendix. MAG, metagenome assembled genome; MMB, multicellular magnetotactic bacteria; SCM, Single Consortium Metagenome.
Fig 3
Fig 3. Clonality analysis of individual MMB consortia.
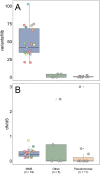
(A) Individual reads were mapped to the same genome bin for each of the 22 SCMs. This analysis revealed that the genomes of cells within MMB consortia have a higher SNP rate (SNP expressed as variations per Mb) as compared to a clonal Pseudomonas sp. control (p < 7.3 × 10⁻⁹, n = 10, 30, 60, and 100 Pseudomonas cells) and other environmental cells (p < 2.4 × 10⁻⁶, e.g., “Other”). (B) The 3 sample categories showed no statistically significant difference in terms of their overall ratio of non-synonymous to synonymous substitutions (dN/dS). Most values were between 0 and 0.5, indicating that there is predominantly strong negative (purifying) selection and that SNPs typically do not lead to changes in the amino acid sequence. S6 Fig provides additional details on genes affected by positive and negative selection. The color of each SCM corresponds to the color identifying each unique species in Fig 2. Statistical analyses were performed using a pairwise t test with the Bonferroni p-adjusted method. The data underlying this figure can be found in Tables E and F in S2 Appendix. MMB, multicellular magnetotactic bacteria; SCM, Single Consortium Metagenome; SNP, single-nucleotide polymorphism.
Fig 4
Fig 4. Metabolic potential of the 8 MMB species in LSSM.
Arrows without circles indicate presence of the respective enzyme or pathway in all bins. Circles indicate complete presence (black), partial presence (gray), or missing (white) genes in each species. A full list of genes used to construct this figure can be found in Table G in S2 Appendix. LSSM, Little Sippewissett Salt Marsh; MMB, multicellular magnetotactic bacteria.
Fig 5
Fig 5. NanoSIMS analysis of the cellular 13C-content of MMB consortia after in situ incubation with isotopically light or heavy carbon sources, specifically 1,2-13C2-acetate, 13C-bicarbonate, 1,2-13C2-propionate, or 1,2-13C2-succinate, for 24 h.
The kill control contained magnetically enriched MMB that had been fixed in 4% paraformaldehyde prior to 13C-acetate addition. The negative control was sediment containing MMB without substrate addition. The dotted line shows the natural abundance of 13C. For further description of boxplots, see S1 Appendix. Inset images show representative NanoSIMS HSIs for each 13C-labeled substrate analyzed. Color scales in HSI images are 1.1%–5% atom percent 13C. Scale bars are 5 μm. S1C and S1D Fig show the incubation setup. For a comparison of the anabolic activity of MMB groups 1, 3, and 4, see S11 Fig. S12 Fig provides an example for correlative microscopy analysis of MMB. SI Materials and Methods detail the calculation of atom percent. The data underlying this figure can be found in Table J in S2 Appendix. For ROIs, see S13 Fig. HSI, hue saturated image; MMB, multicellular magnetotactic bacteria; NanoSIMS, nano-scale secondary ion mass spectrometry.
Fig 6
Fig 6. NanoSIMS analysis of MMB consortia incubated with 1,2-13C2-acetate and 2H2O.
To avoid human bias, ROIs for hotspots within individual consortia were auto-segmented in ImageJ and the isotope ratios of hotspots compared to the value for the whole consortium and negative controls. The 13C and 2H hotspots showed significantly higher isotopic enrichment when compared to the values for the respective whole consortium (p < 1.3 × 10⁻³ and <5.2 × 10⁻⁹, respectively), indicating they are metabolically differentiated. For further description of boxplots, see S1 Appendix. NanoSIMS HSI images of the same MMB consortia analyzed using mass ratio 13C12C/12C2 and 2H/1H, revealing cell-to-cell differentiation. The HSI are scaled to show the atom percent of the respective isotope. Scale bars in HSI images equal 5 μm. For an example of the correlative microscopy workflow used to study MMB, see S12 Fig. The data underlying this figure can be found in Table K in S2 Appendix. For ROIs of all consortia, see S14 Fig. Statistical analyses were performed using a pairwise t test with the Bonferroni p-adjusted method. HSI, hue saturated image; MMB, multicellular magnetotactic bacteria; NanoSIMS, nano-scale secondary ion mass spectrometry.
Fig 7
Fig 7. Heterogeneity in anabolic activity within individual MMB consortia as revealed by BONCAT.
(A) The averaged intensity profile across the diameter of 57 rotationally averaged BONCAT-labeled MMB with standard deviation shown in gray. RFI and diameter of each MMB was scaled as a ratio (0 to 1) to account for differences in fluorescence intensity between consortia and size of consortia. The boxplots show the averaged RFI for each quarter section of the radius with a pairwise statistical difference of p < 1.0 × 10⁻¹⁰. For further description of boxplots, see S1 Appendix. (B) Gray scale confocal microscopy image of a BONCAT-labeled MMB showing proteins that had been synthesized over a 24-h period. (C) Image of the MMB shown in (B) that has been rotationally averaged prior to quantification in Eman2. The red dotted line shows each quarter analyzed for the boxplots shown in (A). For raw and rotationally averaged images of all 57 MMB, see S16 Fig. Statistical analyses were performed using a pairwise t test with the Bonferroni p-adjusted method. The data underlying this figure can be found in Table L in S2 Appendix. BONCAT, bioorthogonal noncanonical amino acid tagging; MMB, multicellular magnetotactic bacteria; RFI, relative fluorescence intensity.

Update of

Comment in

References

    1. Kaiser D. Building a multicellular organism. Annu Rev Genet. 2001;35(1):103–123. doi: 10.1146/annurev.genet.35.102401.090145 - DOI - PubMed
    1. Grosberg RK, Strathmann RR. The Evolution of Multicellularity: A Minor Major Transition? Annu Rev Ecol Evol Syst. 2007;38(1):621–654.
    1. Niklas KJ, Newman SA. The origins of multicellular organisms. Evol Dev. 2013;15(1):41–52. doi: 10.1111/ede.12013 - DOI - PubMed
    1. Umen J, Herron MD. Green algal models for multicellularity. Annu Rev Genet. 2021;55:603–632. doi: 10.1146/annurev-genet-032321-091533 - DOI - PubMed
    1. Rokas A. The origins of multicellularity and the early history of the genetic toolkit for animal development. Annu Rev Genet. 2008;42:235–251. doi: 10.1146/annurev.genet.42.110807.091513 - DOI - PubMed