

An image quality assessment index based on image features and keypoints for X-ray CT images
- PMID: 38990930
- PMCID: PMC11238976
- DOI: 10.1371/journal.pone.0304860
An image quality assessment index based on image features and keypoints for X-ray CT images
Abstract
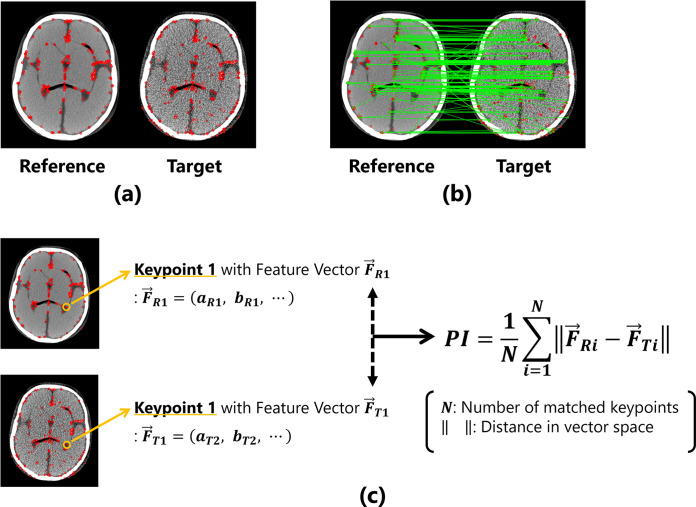
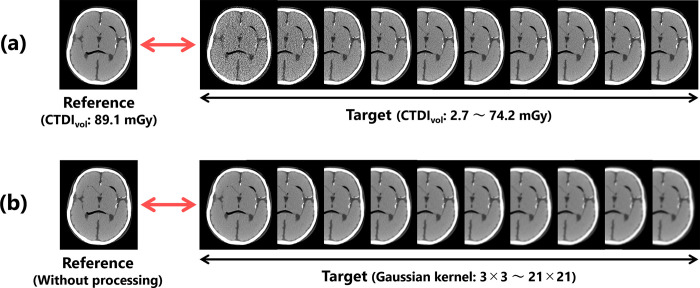
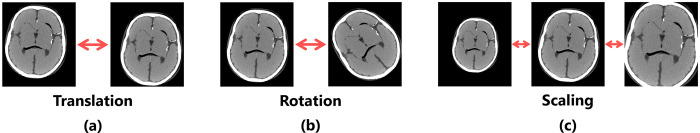
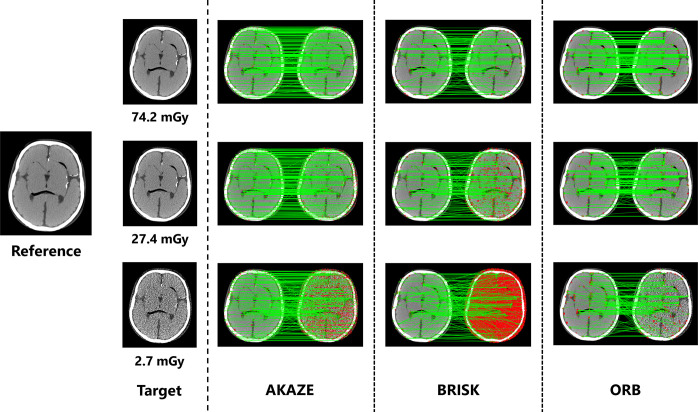
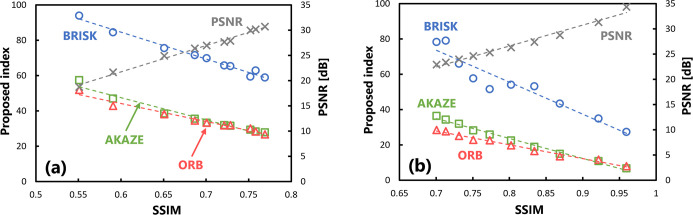
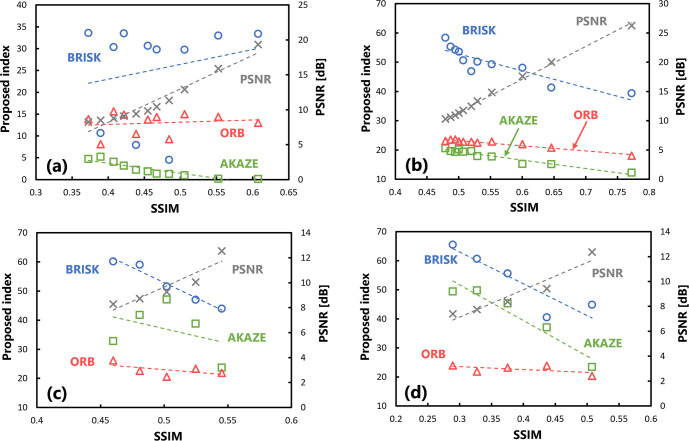
Optimization tasks in diagnostic radiological imaging require objective quantitative metrics that correlate with the subjective perception of observers. However, although one such metric, the structural similarity index (SSIM), is popular, it has limitations across various aspects in its application to medical images. In this study, we introduce a novel image quality evaluation approach based on keypoints and their associated unique image feature values, focusing on developing a framework to address the need for robustness and interpretability that are lacking in conventional methodologies. The proposed index quantifies and visualizes the distance between feature vectors associated with keypoints, which varies depending on changes in the image quality. This metric was validated on images with varying noise levels and resolution characteristics, and its applicability and effectiveness were examined by evaluating images subjected to various affine transformations. In the verification of X-ray computed tomography imaging using a head phantom, the distances between feature descriptors for each keypoint increased as the image quality degraded, exhibiting a strong correlation with the changes in the SSIM. Notably, the proposed index outperformed conventional full-reference metrics in terms of robustness to various transformations which are without changes in the image quality. Overall, the results suggested that image analysis performed using the proposed framework could effectively visualize the corresponding feature points, potentially harnessing lost feature information owing to changes in the image quality. These findings demonstrate the feasibility of applying the novel index to analyze changes in the image quality. This method may overcome limitations inherent in conventional evaluation methodologies and contribute to medical image analysis in the broader domain.
Copyright: © 2024 Maruyama et al. This is an open access article distributed under the terms of the Creative Commons Attribution License, which permits unrestricted use, distribution, and reproduction in any medium, provided the original author and source are credited.
Conflict of interest statement
The authors have declared that no competing interests exist.
Figures
References
-
- ICRP, The 2007 Recommendations of the International Commission on Radiological Protection, ICRP Publication; 103, 2007. - PubMed
-
- ICRP, Diagnostic reference levels in medical imaging. ICRP Publication; 135, 2017. - PubMed
-
- Samei E, Järvinen H, Kortesniemi M, Simantirakis G, Goh C, Wallace A, et al.. Medical imaging dose optimization from ground up: expert opinion of an international summit. J Radiol Prot. 2018;38(3): 967–989. - PubMed
MeSH terms
LinkOut - more resources
Full Text Sources
Medical
