. 2024 Jul 16;121(29):e2320470121.
doi: 10.1073/pnas.2320470121. Epub 2024 Jul 11.

A transient radial cortical microtubule array primes cell division in Arabidopsis

Affiliations

A transient radial cortical microtubule array primes cell division in Arabidopsis

Isaty Melogno et al. Proc Natl Acad Sci U S A. .

Abstract

Although the formation of new walls during plant cell division tends to follow maximal tensile stress direction, analyses of individual cells over time reveal a much more variable behavior. The origin of such variability as well as the exact role of interphasic microtubule behavior before cell division have remained mysterious so far. To approach this question, we took advantage of the Arabidopsis stem, where the tensile stress pattern is both highly anisotropic and stable. Although cortical microtubules (CMTs) generally align with maximal tensile stress, we detected a specific time window, ca. 3 h before cell division, where cells form a radial pattern of CMTs. This microtubule array organization preceded preprophase band (PPB) formation, a transient CMT array predicting the position of the future division plane. It was observed under different growth conditions and was not related to cell geometry or polar auxin transport. Interestingly, this cortical radial pattern correlated with the well-documented increase of cytoplasmic microtubule accumulation before cell division. This radial organization was prolonged in cells of the trm678 mutant, where CMTs are unable to form a PPB. Whereas division plane orientation in trm678 is noisier, we found that cell division symmetry was in contrast less variable between daughter cells. We propose that this "radial step" reflects a trade-off in robustness for two essential cell division attributes: symmetry and orientation. This involves a "reset" stage in G2, where an increased cytoplasmic microtubule accumulation transiently disrupts CMT alignment with tissue stress.

Keywords: cell division; cell geometry; mechanical stress; microtubules; robustness.


Conflict of interest statement

Competing interests statement:The authors declare no competing interest.

Figures

Fig. 1.
Fig. 1.
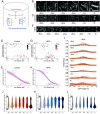
A transient pre-PPB radial pattern of CMTs in the meristem and the stem. (A) Top view of the SAM expressing the pPDF1::mCitrine-MBD marker. Red arrows indicate a predicted isotropic tensile stress pattern in the central zone. (B) Time-lapse of a premitotic cell of the SAM, showing the CMT dynamics before the formation of the PPB, using the pPDF1::mCitrine-MBD marker line. CMT organization changes from coaligned arrays (−10 h to −7 h 30) to radial arrays (−7 h to −6 h) before the start of PPB maturation. (C) Side view of the stem expressing the pPDF1::mCitrine-MBD marker. Red arrows indicate the transverse direction of maximal tensile stress, as demonstrated in ref. . (D and E) Time lapse of premitotic cells in the stem, showing CMT dynamics before PPB formation, using the pPDF1::mCitrine-MBD marker line on the growth medium (AM, D) and cytokinin-supplemented medium (ACM, E). Note the presence of radial CMTs ca. 3 h before cell division. (F) Distribution of CMT orientations overtime in cells from the stem. The angle scale varies between −90° and +90°, 0° being the transverse orientation to the stem axis. Each row represents the time before t = 0 (last timepoint before the nuclear envelope breakdown). Each color-coded curve represents the results obtained for one cell. n−6 h = 20; n−5 h = 25; n−4 h = 34; n−3 h = 35; n−2 h = 37; n−1 h = 37; nt0 = 37. (G) Schematic summary of the transition between the aligned, interphasic CMT array and the PPB array. The Top panel illustrates the simplest scenario, and the Bottom panel recapitulates the observations made with the time-lapse experiments. (H) Graphical representation of the evolution of the anisotropy values obtained with FibrilTool overtime (**P-value < 0.01, Tukey test). n−6 h = 21; n−5 h = 26; n−4 h = 35; n−3 h = 36; n−2 h = 38; n−1 h = 38; nt0 = 39. The cells used for analysis in (G and H) were from stems imaged on either AM or ACM media. For all images in this figure, SurfCut projections were used, projecting the mCitrine signal between 0 and 4 µm from the surface. The Brightness & Contrast parameters have been modified for a better visualization of CMTs. [Scale bars, 10 µm (A and C); 5 µm (B, D, and E).]
Fig. 2.
Fig. 2.
The radial step occurs independently of cell shape or polar auxin transport. (A) Diagram representing the predicted tensile stress patterns for epidermal cells in stems. The cylindrical shape of the stem prescribes maximal tensile stress transverse to the stem axis. At cell scale, the minor axis of the cell is also the predicted tensile stress maximal direction. Depending on cell orientation, tissue stress and cell shape-derived stress are synergistic or antagonistic (B) Representative example of a cell expressing the pPDF1::mCitrine-MBD marker, with its major axis parallel to the stem axis. The cell forms a radial CMT organization before dividing perpendicular to the stem axis. (C) Representative example of a cell expressing the pPDF1::mCitrine-MBD marker, with its major axis perpendicular to the stem axis. The cell forms a radial CMT organization before dividing parallel to the stem axis. (D) Dotplot representing the orientation relative to the stem of the PPB or division planes of cells, in the stem in function of their aspect ratio (the ratio between the longest and the shortest axis of an ellipse fitted around the cell contours). The color code reflects the angle between the major axis of the cell and the stem axis. Light colors highlight cells with their longest axis along the stem axis, dark colors highlight cells with their longest axis transverse to the stem axis. (E) Same as (D), with normalized the data to fit a logistic regression (scale 0 to 1), using the glm function in R studio (R2 = 0.312). (D and E) n = 141. (F) Time lapse showing premiotic cells in the stem expressing the pPDF1::mCitrine-MBD marker, with NPA from germination. (G) Same as (D), with NPA from germination. (H) Same as (E), with NPA from germination (R2 = 0.457). (G and H) n = 166. (I) Same as Fig. 1D, with NPA from germination. n−6 h = 29; n−5 h = 30; n−4 h = 41; n−3 h = 45; n−2 h = 45; n−1 h = 47; nt0 = 58. (J) Distribution of CMT angles normal to the stem axis overtime from NPA-treated plants using the OrientationJ-vector field function in Fiji. n−6 h = 159; n−5 h = 50; n−4 h = 47; n−3 h = 107; n−2 h = 165; n−1 h = 228; nt0 = 244. P-values from the result of a Kolmogorov–Smirnov statistical test comparing the distribution of the data to a uniform distribution: P−6 h < 2.2e−16; P−5 h < 2.2e−16; P−4 h = 2e−10; P−3 h = 1e−05; P−2 h = 4e−09; P−1 h = 3e−14; Pt0 < 2.2e−16. (K) same as (J) but for cells with an aspect ratio below 0.6 (most elongated cells). n−6 h = 63; n−5 h = 15; n−4 h = 19; n−3 h = 45; n−2 h = 73; n−1 h = 93; nt0 = 101. P-values from the result of a Kolmogorov–Smirnov statistical test comparing the distribution of the data to a uniform distribution: P−6 h < 2.2e−16; P−5 h = 3e−02; P−4 h = 1e−02; P−3 h = 2e−04; P−2 h = 2e−11; P−1 h = 1e−09; Pt0 = 2e−13. (L) same as (J) but for cells with an aspect ratio above 0.6 (most isodiametric cells). n−6 h = 96; n−5 h = 35; n−4 h = 28; n−3 h = 62; n−2 h = 92; n−1 h = 135; nt0 = 143. P-values from the result of a Kolmogorov–Smirnov statistical test comparing the distribution of the data to a uniform distribution: P−6 h < 2.2e−16; P−5 h < 2.2e−16; P−4 h = 2e−09; P−3 h = 6e−03; P−2 h = 8e−05; P−1 h < 2.2e−16; Pt0 < 2.2e−16. The cells used for analysis in (D and E) were from stems imaged on either AM or ACM media. The cells used for analysis in (GL) were from stems imaged on ACM medium supplemented with NPA. All images are SurfCut projections between 0 to 4 µm from the surface of the mCitrine signal. (Scale bar, 5 µm.)
Fig. 3.
Fig. 3.
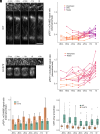
The radial array of CMTs correlates with a premitotic increase of internal microtubule content. (AD) Evolution of cytoplasmic microtubules overtime in WT background (A) or in the trm678 mutant background (C). (A) Time-lapse images of premitotic cells, the Top panel being the cortical projection with SurfCut and the Bottom panel an orthogonal projection through the cell. Cortex images are 8-bit, with the B&C range varying between 0 and 160, and orthogonal projections are 16-bit, with the B&C range varying between 0 and 1,400. (B) Ratio between the average internal signal and the average of the cortical mCitrine-MBD signal over time. The colors correspond to qualitative classifications of cortical arrays (interphasic, radial step, and PPB). Each line represents the kinetics for a given cell. nWT, −6 h = 6; nWT, −5 h = 11; nWT, −4 h = 16; nWT, −3 h = 17; nWT, −2 h = 17; nWT, −1 h = 17; nWT, t0 = 17. (C) same as (A) but in the trm678 mutant. (D) same as (B) but in the trm678 mutant. ntrm678, −6 h = 6; ntrm678, −5 h = 7; ntrm678, −4 h = 7; ntrm678, −3 h = 14; ntrm678, −2 h = 15; ntrm678, −1 h = 17; ntrm678, t0 = 19. (E) Evolution of the ratio of mCitrine-MBD signal (internal/cortical) overtime in WT vs. trm678. (F) Evolution of CMT array anisotropy overtime, using the FibrilTool plugin in Fiji. Results from the WT are reproduced here from Fig. 1H for ease of reading, to compare with trm678. ntrm678, −6 h = 9; ntrm678, −5 h = 15; ntrm678, −4 h = 14; ntrm678, −3 h = 21; ntrm678, −2 h = 26; ntrm678, −1 h = 28; ntrm678, t0 = 29. The cells used for analysis in (B and DF) were from stems imaged on either AM or ACM media. [Scale bars, 10 µm (surface projections) and 5 µm (orthogonal projections).]
Fig. 4.
Fig. 4.
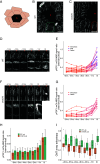
The radial array of CMTs still occurs after modifying the mechanical environment of the cell. (A) Schematic representation of the tensile stress pattern after a local ablation (red star) in an epidermis under tension. The predicted stress is circumferential around the ablation and overrides the global tensile stress prescribed by the tissue. (B) Close-up of an ablation site in a WT stem expressing the pPDF1::mCitrine-MBD marker. Note the circumferential alignment of CMTs around the ablation site, following the predicted maximal tensile stress pattern. The image is the cortical projection obtained with SurfCut. (C) Same as (B) in the trm678 mutant. (D) Time-lapse images of premitotic cells around an ablation, the Top panel being the cortical projection with SurfCut and the Bottom panel an orthogonal projection through the cell. Cortex images are 8-bit, with the B&C range varying between 0 and 80, and orthogonal projections are 8-bit, with the B&C range varying between 0 and 50. (E) Ratio between the average internal signal and the average of the cortical mCitrine-MBD signal over time. The colors correspond to qualitative classifications of cortical arrays (interphasic, radial step, and PPB). Each line represents the kinetics for a given cell. nWT, −6 h = 15; nWT, −5 h = 16; nWT, −4 h = 18; nWT, −3 h = 19; nWT, −2 h = 19; nWT, −1 h = 21; nWT, t0 = 21. (F) Same as (D) but in trm678 mutant cells around an ablation site. (G) Same as (E) but in trm678 mutant cells around an ablation site. ntrm678, −6 h = 9; ntrm678, −5 h = 10; ntrm678, −4 h = 11; ntrm678, −3 h = 11; ntrm678, −2 h = 12; ntrm678, −1 h = 12; ntrm678, t0 = 12. (H) Evolution of the ratio of mCitrine-MBD signal (internal/cortical) overtime in WT vs. trm678, around ablations. (I) Evolution of CMT array anisotropy overtime, using the FibrilTool plugin in Fiji, in WT vs. trm678, around ablations. nWT, −6 h = 15; nWT, −5 h = 16; nWT, −4 h = 18; nWT, −3 h = 19; nWT, −2 h = 19; nWT, −1 h = 22; nWT, t0 = 22; ntrm678, −6 h = 9; ntrm678, −5 h = 10; ntrm678, −4 h = 11; ntrm678, −3 h = 11; ntrm678, −2 h = 13; ntrm678, −1 h = 13; ntrm678, t0 = 13. The cells used for analysis in (E and GI) were from stems imaged on either AM or ACM media. [Scale bars, 20 µm (B and C), 10 µm (D and F, surface projections), and 5 µm (D and F, orthogonal projections).]
Fig. 5.
Fig. 5.
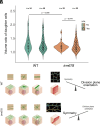
A model: the radial step could contribute to the predictability of cell division symmetry. (A) Violin plot showing the distribution of the ratio between the volume of the two daughter cells in WT and trm678 backgrounds, in both control and NPA conditions. The measurements were made using images from cells expressing pUBQ10::Lti6b-TdTomato membrane marker. The ratio is always calculated between the larger daughter cell and the smaller daughter cell. The p-values displayed are the ones obtained from the Fligner’s statistical test using R studio. (B) Model: in the WT (Top panel), a suboptimal radial step allows the cell to sense its own geometry to define cell division symmetry loosely, while the formation of the PPB defines robust division plane orientation; in the trm678 mutant (Bottom panel), a better-defined radial step improves the division precision (daughter cell volumes), to the detriment of division plane orientation robustness. Radial step and PPB reflect a trade-off in robustness (division precision vs. division plane orientation, respectively). Images: RGB projection of recently divided cells at different focal planes (red: top of the cell, green: middle of the cell, blue: bottom of the cell) in the WT (top cell) and trm678 (bottom cell). (Scale bar, 10 µm.)

Similar articles

Cited by

References

    1. Alberts B., Molecular Biology of the Cell (W. W. Norton & Company, ed. 7, 2022).
    1. Stewart M. P., et al. , Hydrostatic pressure and the actomyosin cortex drive mitotic cell rounding. Nature 469, 226–230 (2011). - PubMed
    1. Chanet S., Sharan R., Khan Z., Martin A. C., Myosin 2-induced mitotic rounding enables columnar epithelial cells to interpret cortical spindle positioning cues. Curr. Biol. 27, 3350–3358.e3 (2017). - PubMed
    1. Sawidis T., Quader H., Bopp M., Schnepf E., Presence and absence of the preprophase band of microtubules in moss protonemata: A clue to understanding its function? Protoplasma 163, 156–161 (1991).
    1. Traas J., et al. , Normal differentiation patterns in plants lacking microtubular preprophase bands. Nature 375, 676–677 (1995).

MeSH terms

LinkOut - more resources