. 2024 Jul 16;121(29):e2405231121.
doi: 10.1073/pnas.2405231121. Epub 2024 Jul 11.

Germline BARD1 variants predispose to mesothelioma by impairing DNA repair and calcium signaling

Affiliations

Germline BARD1 variants predispose to mesothelioma by impairing DNA repair and calcium signaling

Flavia Novelli et al. Proc Natl Acad Sci U S A. .

Abstract

We report that ~1.8% of all mesothelioma patients and 4.9% of those younger than 55, carry rare germline variants of the BRCA1 associated RING domain 1 (BARD1) gene that were predicted to be damaging by computational analyses. We conducted functional assays, essential for accurate interpretation of missense variants, in primary fibroblasts that we established in tissue culture from a patient carrying the heterozygous BARD1V523A mutation. We found that these cells had genomic instability, reduced DNA repair, and impaired apoptosis. Investigating the underlying signaling pathways, we found that BARD1 forms a trimeric protein complex with p53 and SERCA2 that regulates calcium signaling and apoptosis. We validated these findings in BARD1-silenced primary human mesothelial cells exposed to asbestos. Our study elucidated mechanisms of BARD1 activity and revealed that heterozygous germline BARD1 mutations favor the development of mesothelioma and increase the susceptibility to asbestos carcinogenesis. These mesotheliomas are significantly less aggressive compared to mesotheliomas in asbestos workers.

Keywords: cancer prevention; carcinogenesis; gene × environment; genetics; mesothelioma.


Conflict of interest statement

Competing interests statement:M.C. has a patent issued for “Methods for Diagnosing a Predisposition to Develop Cancer.” M.C. and H.Y. have a patent issued for “Using Anti-HMGB1 Monoclonal Antibody or other HMGB1 Antibodies as a Novel Mesothelioma Therapeutic Strategy”, and a patent issued for “HMGB1 As a Biomarker for Asbestos Exposure and Mesothelioma Early Detection.” M.C. is a board-certified pathologist who provides consultation for pleural pathology, including medical-legal.

Figures
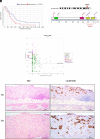
Fig. 1.
Fig. 1.
Germline heterozygous BARD1 mutations found in different individuals with history of mesothelioma. (A) Survival plot showing percentage of survival vs. time in low and high BARD1 expression related mesothelioma cases analyzed by TGCA database. (B) Schematic representation of the BARD1 gene and protein. Localization of BARD1 to chromosome 2 (red arrow) and diagram of the full-length BARD1 protein (777 aa) showing the six likely pathogenic germline BARD1 mutations we identified in six mesothelioma patients (SI Appendix, Tables S1 and S2): three detected in the initial screening (marked in red) and three detected in the validating screening (marked in violet). BARD1 domains are shown: RING domain (green), ANK (pink), BRCT domains (yellow). Exons and amino acids are numbered in gray and black. (C) Combined Annotation Dependent Depletion (CADD) score vs. Minor Allele Frequency (MAF) plot for BARD1 variants. The horizontal axis shows MAF based on gnomAD (version 2) from the Caucasian population. The vertical axis presents the scores of CADD (version 1.6) predicting the pathogenicity of these variants. Five of the six BARD1 mutations found in our patients, are highlighted in red or violet. The 6th mutation consisted of a large BARD1 deletion spanning exons 7 to 11 and shown in Fig. 1B. Because of the large deletions it is not possible to generate a CADD score. The gene-specific Mutation Significant Cutoff (MSC) for CADD score for BARD1 is 14.2, as indicated by the dotted line. (D) Hematoxylin and Eosin (H&E) and CALRETININ immunostaining of the mesothelioma tumor tissue biopsy from BARD1V523A carrier (female). Photomicrograph at 100× and 200×. (Scale bar: 1,000 μm.)
Fig. 2.
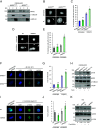
Fig. 2.
Effects of BARD1V523A mutation and of reduced BARD1 levels in DNA damage response. (A) Nuclear-cytoplasmic fractionation of BARD1WT and BARD1V523A fibroblasts. Reduced nuclear BARD1 localization was detected in BARD1V523A fibroblasts compared to BARD1WT cells. Abbreviations: H, Homogenate; C, Cytoplasm; N, Nucleus. (BE) Chromosomal instability was determined as micronuclei frequency at interphase. (B) Primary human BARD1WT and BARD1V523A fibroblasts were treated with 1GY ionizing radiation (IR) for 5 min in PBS or left untreated (PBS); 48 h later, the number of micronuclei (indicated by white arrows) was determined by DAPI staining. (Scale bars: 10 μm.) (C) Percentage of interphase cells with micronuclei in ≥140 cells counted per treatment from n = 2 BARD1WT and n = 2 BARD1V523A mutant; data shown as one representative experiment. P values are calculated by unpaired two-tailed Student’s t tests (*P < 0.05). (D) Primary HM cells were transfected with a pool of siRNAs for BARD1 gene (siBARD1) or a control siRNA (Scr) and then treated with 5 μg/cm2 crocidolite for 24 h or left untreated (PBS); 48 h later, the number of micronuclei (indicated by white arrows) was determined by DAPI staining. (Scale bars: 10 μm.) (E) Percentage of interphase cells with micronuclei in ≥140 cells counted per treatment from n = 3 independent experiments; data are shown as mean ± SD. P values are calculated by unpaired two-tailed Student’s t tests (*P < 0.05). (F and G) γ-H2AX foci formation in BARD1WT and BARD1V523A fibroblasts upon DNA damage. (F) BARD1WT and BARD1V523A fibroblasts were treated with 1GY IR for 5 min in PBS or left untreated (PBS), followed by a recovery of 30 min and stained for endogenous γ-H2AX. (Scale bars: 10 μm.) (G) Number of γ-H2AX foci in 30 cells counted per each group. P values are calculated by unpaired two-tailed Student’s t tests (**P < 0.01). (H) Western blot comparing γ-H2AX protein levels in BARD1WT and BARD1V523A fibroblasts after the treatment with 100 μM H2O2 for 24 h (+) or left untreated (−). (I and J) γ-H2AX foci formation in HM cells silenced for BARD1 gene. (I) Primary HM cells were transfected with a pool of siRNAs for BARD1 gene (siBARD1) or a control siRNA (Scr) and then treated with 5 μg/cm2 crocidolite for 24 h or left untreated (PBS); 24 h later, the γ-H2AX foci number in each cell was counted. At least 35 cells were included per each group. (Scale bars: 10 μm.) (J) Number of γ-H2AX foci in 35 cells counted per each group. P values are calculated by unpaired two-tailed Student’s t tests (*P < 0.05). (K) Western blot comparing γ-H2AX protein levels in HM cells silenced for BARD1. DNA damage in HM cells silenced for BARD1 gene and exposed to 5 μg/cm2 crocidolite for 24 h (+). Decimals: BARD1/GAPDH, γ-H2AX/GAPDH, p-ATM/α-TUBULIN, γ-H2AX/α-TUBULIN.
Fig. 3.
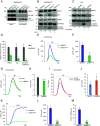
Fig. 3.
BARD1V523A mutation increases resistance to apoptosis by modulating Ca2+ homeostasis. (A) Co-IP of endogenous p53 with BARD1 (used as bait) in fibroblast cell cultures from BARD1WT individuals or carriers of heterozygous BARD1V523A or BAP1+/− mutations. Lower amounts of the coprecipitated BARD1–p53 proteins are found in BARD1V523A cells. (B) Western blot comparing p53 and cleaved caspase-3 levels upon DNA damage. BARD1WT and BARD1V523A fibroblasts were treated with 100 μM H2O2 for 24 h (+) or left untreated (−). P53 and CLEAVED CASPASE-3 levels were reduced in BARD1V523A fibroblasts. (C) HM cells were transfected with siRNAs for BARD1 (siBARD1) or control siRNA (Scr) and then treated with 5 μg/cm2 crocidolite for 24 h or left untreated (PBS); Reduced cleaved caspase-3 was detected in BARD1-silenced HM after crocidolite treatment. Lower p53 amounts were also found in both untreated or crocidolite-treated BARD1-silenced HM. (D) Bar graph: BARD1/GAPDH, p53/GAPDH, CLEAVED CASPASE-3/GAPDH densitometry of bands in primary BARD1-silenced HM after exposure to 5 μg/cm2 crocidolite for 24 h, shown as mean ± SD of the n = 4 biological replicates, one displayed in (Fig. 3C). (EH) Intracellular mitochondrial Ca2+ levels in BARD1WT and BARD1V523A fibroblasts and in HM transduced with siRNA-CTR or siRNA specific for BARD1. Representative traces of single cells Ca2+ measurements using mitochondrial targeted aequorin probe (53) in BARD1WT and BARD1V523A fibroblasts (E) and in HM transduced with siRNA-CTR or siRNA specific for BARD1 (G). Reduced intracellular Ca2+ in the mitochondria of BARD1V523A fibroblasts (F) and in BARD1-silenced HM (H). (I and J) Mitochondrial Ca2+ levels in BARD1V523A fibroblasts transduced with Ad-BARD1 or Ad-GFP (Green Fluorescent Protein used as control). (I) Representative traces of single cells Ca2+ measurements using mitochondrial targeted aequorin probe showing increased mitochondrial Ca2+ in BARD1V523A fibroblasts upon treatment with 1 μM BK. BARD1V523A fibroblasts were transduced with Ad-BARD1(orange line) or Ad-GFP (blue line), used as control. j, Increased intracellular mitochondrial Ca2+ levels in BARD1V523A fibroblasts upon transduction of Ad-BARD1 compared to the control cells (Ad-GFP). (KM) Ca2+ levels in the ER of BARD1WT and BARD1V523A fibroblasts. (K) Representative traces of single cells Ca2+ measurements using ER targeted aequorin probe (53) showing decreased ER Ca2+ in BARD1V523A fibroblasts upon treatment with CaCl2. Significant reduction of total ER Ca2+ levels (L) and significant reduction of ER Ca2+ refilling rate in BARD1 mutant cells (M). Decimals: BARD1/GAPDH, p53/GAPDH, CLEAVED CASPASE-3/CASPASE-3 in B; BARD1/GAPDH, p53/GAPDH, CLEAVED CASPASE-3/GAPDH in C. P values are calculated by unpaired two-tailed Student’s t tests (*P < 0.05, **P < 0.01, ***P < 0.001, ****P < 0.0001).
Fig. 4.
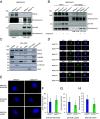
Fig. 4.
BARD1 stabilizes p53–SERCA2 interaction. (A) Co-IP of endogenous SERCA2–p53 interaction using p53 antibody. Reduction of the coprecipitated p53–SERCA2 proteins was detected in BARD1V523A cells compared to BARD1WT cells. (B) Co-IP in BARD1WT and BARD1V523A fibroblasts showing reduced SERCA2–p53 interaction after Adriamycin (2 μM) treatment for 3 h using SERCA2 antibody as bait. (C) WB showing the amounts of BARD1 in the subcellular fractions of a mesothelioma cell line, Mill. HOMO: homogenate; CYT: cytosol; ER: endoplasmic reticulum; MAM: mitochondrial-associated membrane. MITO: mitochondria; Markers: mitochondria (VDAC), ER (SERCA2), nuclei (Lamin B1), cytosol (α-Tubulin). (D) IF: BARD1, SERCA2, p53 localization in BARD1WT and BARD1V523A fibroblasts. Cells were immunostained for BARD1, SERCA2, p53, and CALNEXIN (ER marker). BARD1, besides its nuclear localization, showed a diffuse pattern of punctate hyperfluorescent spots in the cytoplasm that colocalized with the ER, in both BARD1WT and BARD1V523A fibroblasts. Representative IF images from n = 10 fields of view. (Scale bars: 10 μm.) (E) PLA showing the interaction of BARD1–SERCA2, SERCA2–p53, and BARD1–p53 interactions (red dots) in the ER of BARD1WT and BARD1V523A fibroblasts (nuclei stained blue with DAPI). (Scale bars: 10 μm.) (FH) Bar graph: Quantification of PLA red dots per cell showing reduced SERCA2–p53 (G) and reduced BARD1–p53 (H) interactions in BARD1V523A fibroblasts BARD1WT. No difference was found in the BARD1–SERCA2 interaction (F). Data shown are mean ± SD (n = 20 cells). Decimals: SERCA2/p53 in A; p53/SERCA2 in B. P values are calculated by unpaired two-tailed Student’s t tests (*P < 0.05, **P < 0.01).
Fig. 5.
Fig. 5.
BARD1, p53, and SERCA2 form a trimeric protein complex. (AC) Co-IP of endogenous BARD1–SERCA2–p53 interaction using BARD1 (A), p53 (B), or SERCA2 (C) as bait in the ER fraction of HEK293A cells. (D) SPR sensorgram showing binding of BARD1167 nM passed as analyte over SERCA2 ligand, immobilized to the sensor chip surface by his-tag capturing. Kinetic constants and affinity were determined by sensorgram fitting using a Langmuir 1:1 fitting binding model. The fitted curve is shown. The calculated equilibrium dissociation constant (KD = 6.0) is indicated. (E) His-tagged SERCA2 was captured as ligand on a Biacore sensor chip surface to which an anti-his mAb had covalently coupled. BARD1 and p53 were subsequently passed as analytes over the immobilized SERCA2 ligand at 167 nM concentration by sequential injection at a flow rate of 30 μL/min in Hepes Buffered Saline (HBS-EP) buffer. The shown curve represents a double-referenced sensorgram, obtained by subtraction of 1) an amine-activated reference flow cell (FC1) sensorgrams followed by 2) subtraction of a SERCA2 binding sensorgram generated without subsequent BARD1 and p53 injection in order to compensate for complex dissociation from the anti-his mAb during the sequential BARD1 and p53 analyte binding process. The shown curve was selected from experiments run in duplicate.
Fig. 6.
Fig. 6.
BARD1 depletion and BARD1V523A mutation induce malignant transformation. (A and B) In vitro transformation measured as tridimensional foci formation. Primary HM cells were silenced with scramble siRNA or a pool of siBARD1, and then exposed to crocidolite asbestos (5 μg/cm2) in the presence of TNFα. Increased number of foci formation in BARD1-silenced HM. Data shown are mean ± SD of n = 3 technical replicates from n = 3 independent experiments. P values are calculated by unpaired two-tailed Student’s t tests. (*P < 0.05). (CF) Cell proliferation assay in BARD1WT and BARD1V523A fibroblasts after exposure to 1GY of IR. BARD1WT and BARD1V523A fibroblasts were seeded at 250 cells/well (D), 500 cells/well (E), and 1,000 cells/well (F) after exposure to 1GY of ionizing. Significantly higher cell proliferation was observed in BARD1V523A fibroblasts. P values are calculated by unpaired two-tailed Student’s t tests (**P < 0.01). (G) Cell viability assay in BARD1WT and BARD1V523A fibroblasts after treatment with 200 μM H2O2 for 3 h or left untreated. BARD1V523A fibroblasts showed a significant increase in the percentage of viable cells after treatment with H2O2 compared with BARD1WT cells. P values are calculated by unpaired two-tailed Student’s t tests (**P < 0.01). (H) BARD1 and p53 immunostaining in mesothelioma tumor tissue sample from BARD1V523A carrier (female). Photomicrograph at 100×, 200× Surface, and 200× Invading. (Scale bar: 100 μm.) (I) Scatter plot visualizing the correlation between BARD1 and TP53 gene expression in 87 cases of mesothelioma patients described in OncoDB (TCGA database).
Fig. 7.
Fig. 7.
Carriers of BARD1V523A mutation have impaired DNA repair and apoptosis, promoting malignant cell transformation. Schematic representation showing how BARD1 regulates DNA damage response and cell death. In BARD1WT individuals, nuclear BARD1 regulates DNA repair through BRCA1 binding upon DNA damage; In parallel, BARD1 regulates apoptosis by a p53-dependent induction of TRPC6 expression and by forming a trimeric complex with SERCA2 and p53 in the ER of the cell, thus modulating intracellular Ca2+ flux and cell death. In BARD1V523A, reduced BARD1 activity results in increased DNA damage, increased ROS production, reduced TRPC6 expression, and loss of BARD1–SERCA2–p53 trimeric complex in the ER, resulting in impaired Ca2+ flux and resistance to apoptosis.

References

    1. Zhao J., The global trends in incidence, death, burden and risk factors of early-onset cancer from 1990 to 2019. BMJ Oncol. 2, 12 (2023).
    1. Carbone M., et al. , Mesothelioma: Scientific clues for prevention, diagnosis, and therapy. CA Cancer J. Clin. 69, 402–429 (2019). - PMC - PubMed
    1. Carbone M., Yang H., Pass H. I., Taioli E., Did the Ban on asbestos reduce the incidence of mesothelioma? J. Thorac. Oncol. 18, 694–697 (2023). - PubMed
    1. Roushdy-Hammady I., Siegel J., Emri S., Testa J. R., Carbone M., Genetic-susceptibility factor and malignant mesothelioma in the Cappadocian region of Turkey. Lancet 357, 444–445 (2001). - PubMed
    1. Carbone M., et al. , A mesothelioma epidemic in Cappadocia: Scientific developments and unexpected social outcomes. Nat. Rev. Cancer 7, 147–154 (2007). - PubMed

MeSH terms

LinkOut - more resources