. 2024 Jul 12;385(6705):eadl6173.
doi: 10.1126/science.adl6173. Epub 2024 Jul 12.

Mutant IDH1 inhibition induces dsDNA sensing to activate tumor immunity

Affiliations

Mutant IDH1 inhibition induces dsDNA sensing to activate tumor immunity

Meng-Ju Wu et al. Science. .

Abstract

Isocitrate dehydrogenase 1 (IDH1) is the most commonly mutated metabolic gene across human cancers. Mutant IDH1 (mIDH1) generates the oncometabolite (R)-2-hydroxyglutarate, disrupting enzymes involved in epigenetics and other processes. A hallmark of IDH1-mutant solid tumors is T cell exclusion, whereas mIDH1 inhibition in preclinical models restores antitumor immunity. Here, we define a cell-autonomous mechanism of mIDH1-driven immune evasion. IDH1-mutant solid tumors show selective hypermethylation and silencing of the cytoplasmic double-stranded DNA (dsDNA) sensor CGAS, compromising innate immune signaling. mIDH1 inhibition restores DNA demethylation, derepressing CGAS and transposable element (TE) subclasses. dsDNA produced by TE-reverse transcriptase (TE-RT) activates cGAS, triggering viral mimicry and stimulating antitumor immunity. In summary, we demonstrate that mIDH1 epigenetically suppresses innate immunity and link endogenous RT activity to the mechanism of action of a US Food and Drug Administration-approved oncology drug.


Conflict of interest statement

Competing interests: N.B. has received a research grant from Servier Pharmaceuticals LLC. R.T.M. has received consulting or speaking fees from Bristol Myers Squibb, Gilead Sciences, Immunai Therapeutics, and Kumquat Biosciences, has equity ownership in OncoRev, and receives research funding from Calico Life Sciences. R.W.J. is a member of the advisory board for and has a financial interest in Xsphera Biosciences Inc. R.W.J. is an inventor on patents US10472599B2 and US11572590B2 held by Dana-Farber Cancer Institute that cover Microfluidic Cell Culture of Patient-Derived Tumor Cell Spheroids and Methods for evaluating tumor cell spheroids using 3D microfluidic cell culture device, respectively. There are no other authors on the paper affected by this patent, and publication of this work will not impact the patent. A.T, C.S., D.H.S., and A.E.T. are employees of Servier Pharmaceuticals LLC. J.M.C receives research funding to his institution from Merus, Roche, Servier, and Bristol Myers Squibb. J.M.C receives research support from Merck, AstraZeneca, Esperas Pharma, Bayer, Tesaro, Arcus Biosciences, and Apexigen; J.M.C has also received honoraria for being on the advisory boards of Incyte and Blueprint Medicines and on the data safety monitoring committee for AstraZeneca. D.P.C. has received financial compensation from Lilly, GlaxoSmithKline, Incephalo, Boston Pharmaceuticals, Servier Pharmaceuticals LLC, Boston Scientific and Pyramid Biosciences (equity interest) for advisory input. He has also received financial compensation and travel reimbursement from Merck for invited lectures, and from the US NIH and DOD for clinical trial and grant review. The remaining authors declare no competing interests.

Figures

Fig. 1.
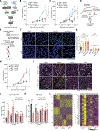
Fig. 1.. mIDH1 inhibition induces a cell-autonomous type I IFN response in ICC models.
(A-D) Immunocompetent mice harboring subcutaneous allograft tumors generated with murine CKIR132C ICC cells were treated (~100 mm3 starting volume) with vehicle or AG120 (150 mg/kg; twice daily), and tumors were harvested at serial time points. (A) Representative immunostaining for markers of tumor cells (red: pan-cytokeratin [pan-CK]), proliferation (grey: Ki67), CD8+ T cells (green: CD8𝛼) and genomic DNA (blue: DAPI). Bottom, higher magnification of the boxed region from the top panels. (B) Immunofluorescence data are quantified and represent mean.±.SD. *P < 0.05, **P < 0.01, ***P < 0.001, ****P < 0.0001 (unpaired t-test). (C) Unbiased K-means clustering of variance stabilizing transformation (VST) normalized RNA-seq profiles of sgControl (sgCtrl) CKIR132C ICC cells (isolated by magnetic bead–mediated depletion of stromal populations) from tumors treated with vehicle or AG120 for 3 or 6 days. Each row is z-score normalized. A subset of the inflammatory-related genes contained in C2 are called out. (D) Geneset enrichment analysis (GSEA) of differential gene expression of Day 3 AG120 vs vehicle conditions, showing enrichment of Hallmark IFN𝛼 Response, Hallmark IFNγ Response, GOBP Response to IFNβ, GOBP Negative Regulation of Viral Process, and GOBP Antigen Processing and Presentation of Peptide Antigen genesets (left). Change in Normalized Enrichment Score from Day 3 to Day 6 when compared to vehicle-treated samples (right). (E-I) The 2205 cell line (murine CKIR132C ICC) was treated in vitro with vehicle (DMSO), 1 μM AG120, 10 ng/ml IFNγ, or the combination and then analyzed by RNA-seq, qRT-PCR, and ELISA. (E) GSEA of the indicated gene sets comparing AG120 treatment to DMSO. (F) Heatmap of VST-normalized RNA-seq expression of Hallmark IFNγ Response genes. Rows are z-score normalized and sorted by average z-scored expression in AG120+IFNγ treated cells. (G) Left: mRNA expression of Ifnb1 measured by qRT-PCR; Right: ELISA analysis of IFNB1 in the cell culture supernatant. (H) Heatmap of VST-normalized RNA-seq expression of the GOBP Negative Regulation of Viral Process geneset. Rows are z-score normalized and sorted by average z-scored expression in AG120+IFNγ treated samples. (I) Scatter plot showing log2 fold change of genes from the Hallmark IFN𝛼 Response signature. x-axis: AG120 vs DMSO. y-axis: IFNγ vs DMSO. Red: genes in the GOBP Negative Regulation of Viral Process or GOBP Viral Response genesets. The circled region highlights viral response genes specifically activated by AG120.
Fig. 2.
Fig. 2.. Inhibition of mIDH1 epigenetically activates specific ERV classes.
(A-D) Murine CKIR132C ICC cells were treated in vitro with 1 μM AG120, 10 ng/ml IFNγ, or the combination. (A) Volcano plot showing differential expression of transposable elements (TE) between AG120- and DMSO-treated cells based on RNA-seq data. Each plot shows a different clade of TE. Each dot represents an individual locus. Red loci are significantly upregulated, and blue are significantly downregulated (padj < 0.05) The ERV1 and ERVK loci with the most enriched loci are specified. (B) Percent methylation of cytosines at CpG sites based on whole genome bisulfite sequencing (WGBS) of CKIR132C ICC cells (mIDH1) or normal liver tissue from wild-type (WT) mice treated as indicated. (C) The top 15 sub-families of transposable elements ranked by the number of loci containing more than five significantly hypomethylated (q-value < 0.01) 100 base-pair DNA tiles in AG120-treated in vitro samples compared to DMSO. Normal livers were from mice treated with vehicle (V) or AG120 (A). (D) Percent methylation of ERV loci from the indicated sub-families. Each row is a single ERV locus. Percent methylation is calculated as the average methylation across all 100 base pair tiles within the locus. A+I: AG120+IFNγ. Normal livers were from wildtype mice treated with vehicle or AG120. Data from normal mouse liver tissue is shown for reference. (E) Immunocompetent mice harboring subcutaneous allograft tumors generated with murine CKIR132C ICC cells were treated (~100 mm3 starting volume) with vehicle or AG120 (150 mg/kg; twice daily), and tumors were harvested at serial time points. (Left) Representative immunostaining for markers of tumor cells (white: pan-cytokeratin [pan-CK]), 5mc and genomic DNA (blue: DAPI). Bottom, higher magnification of the boxed region from the top panels. The intensity of fluorescence is represented on a scale from 0–255, indicating varying levels of 5mc expression. The color bar, ranging from 0 to 255, illustrates the 16-color gradation used for better visualization of expression levels. (Right) Immunofluorescence data are quantified and represent mean.±.SD. *P < 0.05, **P < 0.01 (unpaired t-test). (F-J) In vivo RNA-seq profiling of sgCtrl and sgTet2 derivatives of CKIR132C ICC allograft tumors in mice treated with vehicle or AG120 for 3 or 6 days. N=3 for all experimental groups, except N=2 for sgCtrl treated with AG120 for 3 days. (F) Principal Component Analysis (PCA) in the space of transposable elements (G) Volcano plot showing differential analysis of ERVs between sorted tumors from 3-day AG120-treated mice and vehicle treated mice. (left) ERV1 loci. (right) ERVK loci. Top left corner lists the ERV1 and ERVK subfamilies with the most enriched loci. Red indicates significant upregulation (padj < 0.05). (H) Heatmap of DESeq2-normalized expression values from IAPEz-int loci which are shown to be upregulated in Fig. 2G. Expression is shown for samples from mice bearing sgCtrl or sgTet2 allografts, treated with vehicle (Veh.) or AG120 for 3 or 6 days (A3, A6). Replicates are averaged and rows are z-score normalized. (I) GSEA of the differential gene expression in sgCtrl compared to sgTet2 tumors, isolated from animals treated with AG120 for 6 days. (J) Heatmap of VST-normalized RNA-seq counts from genes in the Hallmark IFN𝛼 Response geneset from mice bearing sgCtrl or sgTet2 allografts, treated with vehicle (Veh.) or AG120 for 3 or 6 days (A3, A6). Rows are z-score normalized and sorted by the adjusted p-value of the differential expression between sgCtrl and sgTet2 conditions after 6 days of AG120 treatment.
Fig. 3.
Fig. 3.. Induction of cGAS-STING signaling and T cell immunity by mIDH1 inhibition requires ERV-encoded reverse transcriptase.
(A) Schematic of signaling by nucleic acid sensing pattern-recognition receptors. (B-C) Immunocompetent WT mice were injected subcutaneously with the indicated derivatives of CKIR132C ICC cells. Analysis of serial changes in tumor volume following treatment with vehicle or AG120. N = 6 mice per group. Data means ± SEM. ***, P < 0.001; ns, not significant; unpaired t-test. Data for a second sgRNA targeting Mavs and Cgas are shown in fig. S3C and D, respectively. (D) Schematic of the ERV-RT-cGAS-STING pathway. (E) Strategy to target conserved RT regions among AG120-induced ERVs using multi-loci targeting CRISPR-Cas9 sgRNAs. (F, G) The indicated derivatives of CKIR132C ICC cells were treated in vitro with vehicle, 1 μM AG120, 10 ng/ml IFNγ, or the combination. Cells were stained with antibodies to cytoplasmic dsDNA (green) and with DAPI for nuclear DNA (blue). Data for a second sgRNA vector targeting RT are shown in fig. S4K–L. IF images for sgRT-1, sgRT-2, and sgCtrl were taken in parallel and the same set of sgCtrl images is shown as in fig. S3K as a reference for the reader. (F) Representative immunofluorescence images. (G) Quantification of immunofluorescence data represented as mean.±.SD. *P < 0.05, ns, not significant, unpaired t test. (H) Serial changes in volume of allograft tumors generated with indicated derivatives of CKIR132C ICC cells. N = 6 mice per group. Data means ± SEM. ***, P < 0.001; ns, not significant; unpaired t test. Data for a second sgRNA vector targeting RT are shown in fig. S4M. This experiment was performed alongside the evaluation of sgMavs in Fig 3B and thus shared Control groups. (I-K) Immunofluorescence (IF) analysis of subcutaneous allograft tumors upon treatment with vehicle or AG120 for 6 days. (I) Representative IF staining of tumors for the designated markers. Quantification of the staining data of (J) CD8+ T cells and (K) Ki67+PanCK+ proliferating tumor cells represented as mean.±.SD. ***, P < 0.001; *P < 0.05; ns, not significant; unpaired t-test. (L) In vivo RNA-seq expression analysis of purified tumor cells from subcutaneous allograft tumors generated with the indicated derivatives of CKIR132C ICC cells.) upon treatment with vehicle or AG120 for 3 and 6 days. Left: Unbiased K-means clustering of VST-normalized RNA-seq expression across samples. Right: Heatmap showing select Hallmark IFNγ and IFN𝛼 response genes in the C1 cluster. Veh: Vehicle-treated; A-3: 3-day AG120 treatment; A-6: 6-day AG120 treatment. Rows in both plots are z-score normalized.
Fig. 4.
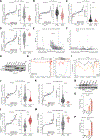
Fig. 4.. mIDH1 drives epigenetic silencing of cGAS in ICC and glioma models.
(A) Western blot of cGAS protein expression in a series of ICC primary cell lines derived from IDH1 wild type (CKP) and mIDH1 (CKIR132C) GEMMs. β-ACTIN: internal loading control. (B) Western blot for expression of the indicated proteins in CKIR132C ICC cells treated in vitro with vehicle, 1 μM AG120, 10 ng/ml IFNγ, or the combination. VINCULIN: internal loading control. (C) WGBS of CKIR132C ICC cells treated in vitro with AG120 versus vehicle, alongside reference normal mouse liver. Left: Percent methylation of cytosines at CpG sites within 100 base pair tiles in the Cgas gene region. Each data point represents the start of each tile. Right: Zoomed-in view of methylation at the Cgas promoter. (D) Western blot of cGAS protein expression in murine primary glioma cell lines derived from the IDH1 wild type (PC: Pik3camut, Trp53mut, Atrxmut) and mIDH1 (PIC: IDH1R132H, Pik3camut, Trp53mut, Atrxmut) GEM models. β-ACTIN: internal loading control. (E) mIDH1 primary murine glioma cells (from the PIC model, PIC496–3) were treated as indicated in vitro and analyzed by western blot. β-ACTIN: internal loading control. (F, G) Western blot of cGAS, STING, IRF3, and pIRF3 protein expression in (F) murine ICC and (G) glioma primary cell lines treated in vitro as indicated. β-ACTIN: internal loading control. (H-J) RNA-seq analysis of mIDH1 primary murine glioma spheroid cells treated in vitro with 1 μM AG120, 10 ng/ml IFNγ, or the combination. (H) GSEA of differentially expressed genes in the indicated gene sets comparing treatment with AG120 versus DMSO. (I) Heatmap of VST normalized expression values showing GOBP Negative Regulation of Viral Process genes. Rows are z-score normalized and sorted by average z-scored expression in AG120+IFNγ treated samples. (J) Volcano plot showing differential expression of transposable elements (TE) between AG120- and DMSO-treated cells based on RNA-seq data. Each plot shows a different clade of TE. Each dot represents an individual locus. Red loci are significantly upregulated, and blue are significantly downregulated (padj < 0.05). The ERV1 and ERVK loci with the most enriched loci are specified.
Fig. 5.
Fig. 5.. mIDH1 causes defective innate immune signaling in human ICC and glioma cells.
(A-C) Analysis of RNA-seq profiles from ICC patient samples in the TCGA (A), Fu-iCCA (B), and ICGC (C) datasets. Left plots: differential expression of all genes in IDH1 mutant versus IDH1 wild-type tumors (p-value from Mann-Whitney U test comparing average gene expression). Right plots: mRNA expression of CGAS in IDH1 mutant versus IDH1 wild-type tumors. (D) Analysis of methylation data from the TCGA cholangiocarcinoma study. Left plot: differential methylation of all genes in IDH1 mutant versus IDH1 wild-type tumors, (p-value from Mann-Whitney U test comparing average gene methylation). Right plot: methylation of CGAS in IDH1 mutant versus IDH1 wild-type tumors. (E) Volcano plots of RNA-seq data showing differential expression in IDH1 mutant (N=3) versus IDH1 wild type (N=25) human biliary cancer cell lines. Log2 fold change and p-adj calculated by DESeq2. (F) Volcano plots of quantitative proteomics data showing differential expression in IDH1 mutant (N=3) versus IDH1 wild type (N=33) human biliary cancer cell lines. Log2 fold change and p-adj calculated by limma. (G) Western blot of cGAS and STING protein expression in IDH1 mutant and IDH1 wild-type human ICC cell lines. VINCULIN: internal loading control. (H) Reduced representation bisulfite sequencing (RRBS) analysis of a set of IDH1 wild type and IDH1 mutant human ICC cell lines showing the percent methylation of cytosines at CpG sites within 100 base pair tiles in the CGAS gene region. The start of each tile is plotted. (I) WGBS of the human mIDH1 ICC cell line SNU1079 treated in vitro with 1 μM AG120 or DMSO. The figure shows the percent methylation of cytosines at CpG sites within 100 base pair tiles at the CGAS gene region. The start of each tile is plotted. (J-M) Analysis of tumors from low-grade glioma (LGG) and glioblastoma (GBM) patients from the TCGA database. (J-K) Left plot: Differential expression of all genes between IDH1 mutant and IDH1 wild-type tumors (LGG in J; GBM in K). Right plot: mRNA expression of CGAS in IDH1 mutant versus IDH1 wild-type tumors. Statistics as described in (A). (L-M) Left plot: Differential methylation of all genes between IDH1 mutant and IDH1 wild-type tumors (LGG in L; GBM in M). Right plot: Methylation of CGAS in IDH1 mutant versus IDH1 wild-type tumors. Statistics as described in (D) (N) Western blot of cGAS protein expression in glioma spheroids. β-ACTIN: internal loading control. (O-P) Relative mRNA expression of CGAS quantified by qRT-PCR. (O) SNU1079 cells treated as indicated. (P) MGG152 cells treated as indicated. ****, P < 0.0001; ***, P<0.001; **, P<0.01; *, P<0.05.
Fig. 6.
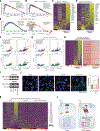
Fig. 6.. mIDH1 inhibition induces dsDNA-mediated viral mimicry in human ICC and glioma cells.
(A-D) RNA-seq profiling of human mIDH1 ICC cells (SNU1079) and glioma spheroids (MGG152) treated in vitro with 1 μM AG120, 10 ng/ml IFNγ, or the combination. (A-B) GSEA of the indicated gene sets comparing AG120+IFNγ treatment to IFNγ in (A) SNU1079 and (B) MGG152. (C-D) Heatmap of VST-normalized RNA-seq expression of genes in the GOBP Negative Regulation of Viral Process geneset in (C) SNU1079 and (D) MGG152. Rows are z-score normalized and sorted by average z-scored expression in AG120+IFNγ treated samples. (E) Analysis of RNA-seq data and 2HG levels from resected low-grade glioma sections from NCT03343197. GSEA on genes ranked by the Pearson correlation of their TPM expression values with log10 normalized intratumor 2HG level. Hallmark IFN𝛼 and IFNγ Response genesets (left), GOBP Negative Regulation of Viral Process geneset with leading edge genes called out (right). (F-G) Volcano plots showing differential TE expression in AG120 vs DMSO treated cells (left) and AG120+IFNγ vs DMSO treated cells (right) in (F) SNU1079 RNA-seq and (G) MGG152 RNA-seq. Top row of volcano plots display LTR elements and bottom row shows LINE elements. Colored dots are loci annotated as containing reverse transcriptase. (H) Heatmap of TE expression level (left) and locus methylation status profiled by WGBS (right) for loci enriched after either AG120 or AG120+ IFNγ treatment in SNU1079 cells. The figure on the right shows the average percent methylation of all cytosines at CpG sites with the corresponding TE locus from left. (I) (Top) Human SNU1079 mIDH1 ICC cells and (Bottom) human MGG152 mIDH1 glioma spheroid cells were treated in vitro with 1 μM AG120, 10 ng/ml IFNγ, or the combination. Western blot for LINE-1 ORF1 protein expression. (J) SNU1079 cells were treated in vitro with vehicle, 1 μM AG120, 10 ng/ml IFNγ, or the combination. Cells were stained with antibodies to cytoplasmic dsDNA (green) and with DAPI for nuclear DNA (blue). (Left) Representative immunofluorescence images. (Right) Quantification of immunofluorescence data represented as mean.±.SD. ****P < 0.0001, ns, not significant; One-way ANOVA. (K) RNA-seq profiling of human mIDH1 ICC cells (SNU1079) engineered with sgCtrl or sgCGAS or engineered with sgCtrl and treated with Azidothymidine (AZT), a reverse transcriptase inhibitor. Each of these 3 sets of cells were treated in vitro with 1 μM AG120, 10 ng/ml IFNγ, or the combination. Heatmap shows the VST-normalized RNA-seq expression of genes in the GOBP Negative Regulation of Viral Process geneset across all samples. Rows are z-score normalized and sorted by average z-scored expression in sgCtrl AG120+IFNγ treated samples. (L) Schematic of mechanism of action of anti-tumor immunity driven by mIDH1 inhibition.

Comment in

  • Unmasking immune suppression.
    Pitarresi JR, Fitzgerald KA. Pitarresi JR, et al. Science. 2024 Jul 12;385(6705):140-142. doi: 10.1126/science.adq5196. Epub 2024 Jul 11. Science. 2024. PMID: 38991086

References

    1. Pirozzi CJ, Yan H, The implications of IDH mutations for cancer development and therapy. Nat Rev Clin Oncol. 18, 645–661 (2021). - PubMed
    1. Dang L, White DW, Gross S, Bennett BD, Bittinger MA, Driggers EM, Fantin VR, Jang HG, Jin S, Keenan MC, Marks KM, Prins RM, Ward PS, Yen KE, Liau LM, Rabinowitz JD, Cantley LC, Thompson CB, Heiden MGV, Su SM, Cancer-associated IDH1 mutations produce 2-hydroxyglutarate. Nature. 462, 739–744 (2009). - PMC - PubMed
    1. Xu W, Yang H, Liu Y, Yang Y, Wang P, Kim S-H, Ito S, Yang C, Wang P, Xiao M-T, Liu L, Jiang W, Liu J, Zhang J, Wang B, Frye S, Zhang Y, Xu Y, Lei Q, Guan K-L, Zhao S, Xiong Y, Oncometabolite 2-Hydroxyglutarate Is a Competitive Inhibitor of α-Ketoglutarate-Dependent Dioxygenases. Cancer Cell. 19, 17–30 (2011). - PMC - PubMed
    1. Losman J-A, Koivunen P, Kaelin WG, 2-Oxoglutarate-dependent dioxygenases in cancer. Nat Rev Cancer. 20, 710–726 (2020). - PubMed
    1. Losman J-A, Jr WGK., What a difference a hydroxyl makes- mutant IDH, (R)-2-hydroxyglutarate, and cancer.pdf (2013), doi: 10.1101/gad.217406.113. - DOI - PMC - PubMed

Publication types