. 2024 Jul 25;67(14):12012-12032.
doi: 10.1021/acs.jmedchem.4c00721. Epub 2024 Jul 11.

Targeting Myeloperoxidase Ameliorates Gouty Arthritis: A Virtual Screening Success Story

Affiliations

Targeting Myeloperoxidase Ameliorates Gouty Arthritis: A Virtual Screening Success Story

Isaac de A Matos et al. J Med Chem. .

Abstract

This study presents a new approach for identifying myeloperoxidase (MPO) inhibitors with strong in vivo efficacy. By combining inhibitor-like rules and structure-based virtual screening, the pipeline achieved a 70% success rate in discovering diverse, nanomolar-potency reversible inhibitors and hypochlorous acid (HOCl) scavengers. Mechanistic analysis identified RL6 as a genuine MPO inhibitor and RL7 as a potent HOCl scavenger. Both compounds effectively suppressed HOCl production in cells and neutrophils, with RL6 showing a superior inhibition of neutrophil extracellular trap release (NETosis). In a gout arthritis mouse model, intraperitoneal RL6 administration reduced edema, peroxidase activity, and IL-1β levels. RL6 also exhibited oral bioavailability, significantly reducing paw edema when administered orally. This study highlights the efficacy of integrating diverse screening methods to enhance virtual screening success, validating the anti-inflammatory potential of potent inhibitors, and advancing the MPO inhibitor research.


Conflict of interest statement

The authors declare no competing financial interest.

Figures

Figure 1
Figure 1
MPO catalytic mechanism. HOX-hypohalous acid, X-halide ion, RH-oxidable. RH-includes alternative substrates such as urate.
Figure 2
Figure 2
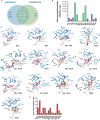
Inhibitors discovered by virtual screening and their binding modes from molecular docking. (A) Venn diagram showing the active compounds in the peroxidatic and chlorinating tests. (B) Chlorinating/peroxidatic activity inhibition ratio of the compounds. (C) Binding mode of the compounds showing the major interactions with the MPO active site. Residues are shown in blue, heme groups in gray, and ligands in pink. Hydrogen bonds and polar contacts are shown as red lines. For racemic compounds, the enantiomer is identified. (D) Frequency of interactions of the inhibitor-binding mode. Molecular docking was performed in PDB 1CXP protein structure using AutoDock 4.2.3.
Figure 3
Figure 3
IC50 plots, scavenger activity, and residual activity of the compounds. (A) IC50 of the MPO chlorinating activity performed in 20 mM phosphate buffer, pH 7.4; compounds were dissolved in DMSO 0.03%, 10 nM MPO, 100 μM DTPA, 0.03% CTAC, 140 mM NaCl, and 5 mM taurine. Reaction was started with 40 μM hydrogen peroxide and stopped using catalase. Taurine chloramine was quantified by TMB oxidation. (B) Scavenger activity of the compounds toward taurine chloramine. For scavenger assay, 2.81 mM HOCl was mixed with 5 mM taurine in phosphate buffer (20 mM, pH 7.4, 140 mM NaCl, 100 μM DTPA), and after 5 min, the compounds were added to this mixture for 15 min at 37 °C. Taurine chloramine was quantified by the oxidation of TMB. (C) Residual peroxidase activity was carried out using 100 nM MPO with 20 μM inhibitors in phosphate buffer (20 mM, pH 7.4), 0.03% CTAB, and 40 μM H2O2 at 37 °C for 30 min. After incubation, the system was diluted 200-fold using acetate buffer (200 μM, pH 5.4), and the residual peroxidatic activity was detected by TMB. Bars represent mean ± SEM of three independent experiments (n = 3). Statistical analysis was performed using one-way ANOVA, followed by Bonferroni posthoc test. *statistically different (p < 0.01) compared to the control group (DMSO).
Figure 4
Figure 4
Evaluation of RL7 and RL6 oxidation by fluorescence decay. RL7 fluorescence after incubation with MPO/H2O2 in the absence (A) or presence (B) of chloride. Reactions were performed in phosphate buffer (20 mM, pH 7.4) containing 1 μM RL7 dissolved in DMSO (0.3% final concentration), 10 nM MPO, 100 μM DTPA, 5 mM taurine, 0.03% CTAC or CTA(SO4H) for no chloride samples, and 140 mM NaCl. The reaction was started by adding 40 μM hydrogen peroxide and RL7 concentration monitored by fluorescence (λex = 306/λem = 603 nm for RL7). (C) RL7 fluorescence decay in the absence (blue line) or presence (red line) of HOCl. Fluorescence of RL7 (20 μM in 0.3% DMSO) was monitored in a stopped-flow device using λex = 306 nm and λem = above 340 nm in 20 mM phosphate buffer (pH 7.4) containing 100 μM DTPA and 140 mM. RL7 was rapidly mixed with 250 μM HOCl. The data were obtained up to 1 s after mixing. Fluorescence of RL6 after incubation with MPO/H2O2 in the absence (D) or presence (E) of chloride. Reaction was performed as for RL7. In (F) was added 50 μM tyrosine (Tyr). RL6 oxidation was monitored by λex = 413/λem = 603 nm. Data represented mean ± SEM of three independent experiments (n = 3).
Figure 5
Figure 5
MPO spectra. MPO (0.5 μM) spectra were monitored in phosphate buffer (10 mM, pH 7.4) in (A) before (black line) and after reacting with 100 μM H2O2 (red line) and 100 μM H2O2 plus 50 μM tyrosine (blue line). (B) Same as in A, but in the presence of 10 μM RL6. Inset showing the stabilization of absorption at 456 nm even in the presence of tyrosine. (C) Comparison of the spectra of 0.5 μM MPO in the absence (black line) or presence (gray line) of 10 μM RL6.
Figure 6
Figure 6
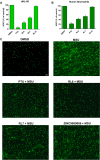
MPO inhibitors decrease HOCl and NETosis in cells. Inhibition of HOCl production by MPO inhibitors in the dHL-60 cell line (A) and human peripheral blood neutrophils (B). 1 ×10⁶ dHL-60 or neutrophils were incubated in PBS (10 mM Na2HPO4, 2 mM KH2PO4, 0.5 mM MgCl2, 1 mM CaCl2, 140 mM NaCl, 5.5 mM dextrose), 100 μM DTPA, and 5 mM taurine in the presence of 20 μM compounds dissolved in 0.3% DMSO or 0.3% DMSO alone (control). Cells were activated with 100 nM PMA at 37 °C for 1 h. Then, the supernatant taurine chloramine was quantified by TMB. Inhibition of HOCl production was calculated as the percentage of control (vehicle, 0.3% DMSO). Statistical analyses were performed by one-way ANOVA, followed by Bonferroni’s posthoc test; *p < 0.01 from vehicle. Bars represent mean ± SEM of three independent experiments (n = 3). (C) Fluorescence microscopy of DNA stained with sytox green in nonstimulated (0.15% DMSO only) or urate monosodium crystal (MSU)-stimulated neutrophils. For the NETosis assay, adhered neutrophils were covered with RPMI medium containing 20 μM compounds and MSU (250 μg/mL). After 90 min of incubation, cells were fixed and kept at 4 °C overnight. Cells were then washed threefold with tris-HCl buffer (20 mM, pH 7.4), and DNA was stained by 500 μL of sytox green (500 nM) for 30 min. After being mounted and fixed on coverslips, the fluorescence images were acquired by the fluorescence microscope (λex = 450–490 nm, λem = above 515 nm). Fluorescence microscopy is representative of at least three independent experiments. Additional frames of the independent replicates are presented in Figure S3A,B.
Figure 7
Figure 7
Flowchart of the MSU-induced paw edema experiment. Design for intraperitoneal (A) or oral (B) treatment.
Figure 8
Figure 8
Antiedematogenic effect of MPO inhibitors and HOCl scavenger in MSU-induced paw edema. Mice were pretreated with vehicle (VEH: 5% DMSO; 0.5% Tween-80 in PBS, i.p.), mefenamic acid (A, MEF: 30 mg/kg, i.p.), RL6 (B, 3, 10, and 30 mg/kg, i.p.), RL7 (C, 0.3, 3, and 30 mg/kg, i.p.), or ZINC9089086 (D: 3, 10, and 30 mg/kg, i.p.), and the respective AUCs are shown in E. (F) Antiedematogenic effect of the oral administration of MPO inhibitors and HOCl scavengers in MSU-induced paw edema, RL6 (33 mg/kg, po), RL7 (54 mg/kg, po), ZINC9089086 (34 mg/kg, po), and MEF (30 mg/kg, i.p.). After 30 min, mice received vehicle (VEH: PBS, 30 μL, i.pl.) or MSU (1.5 mg/30 μL, i.pl.). Paw volume (mL) was evaluated before (B, baseline) and after pretreatments for 6 h in a plethysmometer. Statistical analyses were performed by two-way ANOVA, followed by Bonferroni’s posthoc test; #P < 0.05 compared to the “VEH + VEH” group; *P < 0.05 compared to the “VEH + MSU” group, n = 5/group.
Figure 9
Figure 9
Effect of intraperitoneal treatment with MPO inhibitors and the HOCl scavenger on the total peroxidase activity (A), and IL-1β (B) and IL-6 (C) levels in the hind paw tissue. Mice were treated as described in Figure 6. After the last paw volume measurement (6 h), the hind paws were collected and tissue were prepared for total peroxidase activity and cytokine assessment. Statistical analyses were performed by one-way ANOVA, followed by Bonferroni’s posthoc test; #P < 0.05 compared to the “VEH + VEH” group; *P < 0.05 compared to the “VEH + MSU” group, n = 4–5/group.

References

    1. Cieza A.; Causey K.; Kamenov K.; Hanson S. W.; Chatterji S.; Vos T. Global Estimates of the Need for Rehabilitation Based on the Global Burden of Disease Study 2019: A Systematic Analysis for the Global Burden of Disease Study 2019. Lancet 2020, 396 (10267), 2006–2017. 10.1016/S0140-6736(20)32340-0. - DOI - PMC - PubMed
    1. Mitroulis I.; Kambas K.; Ritis K. Neutrophils, IL-1β, and Gout: Is There a Link?. Semin. Immunopathol. 2013, 35 (4), 501–512. 10.1007/s00281-013-0361-0. - DOI - PubMed
    1. Aratani Y. Myeloperoxidase: Its Role for Host Defense, Inflammation, and Neutrophil Function. Arch. Biochem. Biophys. 2018, 640 (December 2017), 47–52. 10.1016/j.abb.2018.01.004. - DOI - PubMed
    1. Zamocky M.; Jakopitsch C.; Furtmüller P. G.; Dunand C.; Obinger C. The Peroxidase-Cyclooxygenase Superfamily: Reconstructed Evolution of Critical Enzymes of the Innate Immune System. Proteins: Struct., Funct., Genet. 2008, 72 (2), 589–605. 10.1002/prot.21950. - DOI - PubMed
    1. Schultz J.; Kaminker K. Myeloperoxidase of the Leucocyte of Normal Human Blood. I. Content and Localization. Arch. Biochem. Biophys. 1962, 96 (3), 465–467. 10.1016/0003-9861(62)90321-1. - DOI - PubMed

Publication types