. 2024 Oct 7;59(19):2593-2608.e6.
doi: 10.1016/j.devcel.2024.06.009. Epub 2024 Jul 10.

Endoplasmic reticulum exit sites are segregated for secretion based on cargo size

Affiliations

Endoplasmic reticulum exit sites are segregated for secretion based on cargo size

Sonashree Saxena et al. Dev Cell. .

Abstract

TANGO1, TANGO1-Short, and cTAGE5 form stable complexes at the endoplasmic reticulum exit sites (ERES) to preferably export bulky cargoes. Their C-terminal proline-rich domain (PRD) binds Sec23A and affects COPII assembly. The PRD in TANGO1-Short was replaced with light-responsive domains to control its binding to Sec23A in U2OS cells (human osteosarcoma). TANGO1-ShortΔPRD was dispersed in the ER membrane but relocated rapidly, reversibly, to pre-existing ERES by binding to Sec23A upon light activation. Prolonged binding between the two, concentrated ERES in the juxtanuclear region, blocked cargo export and relocated ERGIC53 into the ER, minimally impacting the Golgi complex organization. Bulky collagen VII and endogenous collagen I were collected at less than 47% of the stalled ERES, whereas small cargo molecules were retained uniformly at almost all the ERES. We suggest that ERES are segregated to handle cargoes based on their size, permitting cells to traffic them simultaneously for optimal secretion.

Keywords: COPII; ER export; ERES; TANGO1; collagens; endoplasmic reticulum; membrane traffic; optogenetics; protein secretion; secretory cargo.


Conflict of interest statement

Declaration of interests The authors declare no competing interests.

Figures
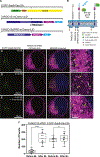
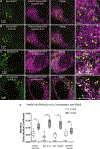
Figure 1.
Figure 1.. Manipulating TANGO1-Short and Sec23A binding by optogenetics
(A) Schematics of optogenetic constructs for Sec23A, TANGO1-Short (TANGO1S), and TANGO1SΔPRD. TANGO1Short binds to Sec23A via its cytoplasmic proline-rich domain (PRD), which is removed in the TANGO1SΔPRD variant. The N-terminus of Sec23A is tagged with EGFP-SspB (SspB, one half of an optogenetic pair). The C-terminus of TANGO1S is tagged with mCherry-iLID (iLID, second half of the optogenetic pair containing SsrA). In the construct TAN-GO1SΔPRD, the PRD at the C terminus of TANGO1S is replaced by mCherry-iLID. (B) Schematics of TANGO1S, TANGO1SΔPRD-mCh-iLID, and EGFP-SspB-Sec23A at ER. BL induces reversible dimerization of SsrA (iLID) and SspB domains binding TANGO1SΔPRD-mCh-iLID to EGFP-SspB-Sec23A. (C–E) Airyscan-acquired time-lapse snapshots (Video S1) of U2OS cells stably expressing TANGO1SΔPRD-mCh-iLID (magenta) and EGFP-SspB-Sec23A (green). (C) Without BL, TANGO1SΔPRD-mCh-iLID is dispersed throughout the ER membrane and EGFP-SspB-Sec23A is observed as discrete puncta. (D) After 3 min of BL exposure, TANGO1SΔPRD-mCh-iLID colocalizes with EGFP-SspB-Sec23A, shown as white puncta in merged and zoomed image (yellow arrowheads). (E) Removal of BL for 3 min disperses TANGO1SΔPRD-mCh-iLID throughout the ER. (F) Boxplot comparing number of puncta formed by TANGO1SΔPRD-mCh-iLID and EGFP-SspB-Sec23A, before and after 3 min of BL. Horizontal line in center represents median, whiskers represents maximum and minimum range of data, while the box indicates 1st and 3rd quartile. Statistically significant increases in number are observed for both proteins (***p < 0.001 and *p < 0.05, respectively; paired t test; n = 15 cells, ≥3 experiments). See also Figure S1 and Video S1.
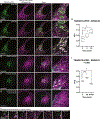
Figure 2.
Figure 2.. Real-time recruitment of TANGO1SΔPRD to ERES by optogenetics
Airyscan-acquired time-lapse snapshots of U2OS cells stably expressing TANGO1SΔPRD-mCh-iLID and SspB-Sec23A and transiently transfected with Sec13-GFP (Video S2). (A) Sec13-GFP (green) forms discrete puncta in the cells (yellow arrowheads in merged and zoom), while TANGO1SΔPRD-mCh-iLID (magenta) is dispersed in the ER membrane. Scale bar in zoomed image, 2 μm. (B) After 3 min of BL, Sec13-GFP and TANGO1SΔPRD-mCh-iLID colocalize in puncta, shown in white and marked by yellow arrowheads. Scale bar in zoomed image, 2 μm. (C and D) U2OS cells stably expressing TANGO1SΔPRD-mCh-iLID and SspB-Sec23A, exposed to BL (0 and 3 min), fixed, and stained with antibodies against Sec31A. (C) Sec31A (green) is observed as discrete puncta (yellow arrowheads). Scale bar in zoom, 5 μm. (D) TANGO1SΔPRD-mCh-iLID is observed as puncta (magenta) colocalized with Sec31A after 3 min of BL exposure. Scale bar in zoom, 5 μm. (E) Boxplot of Manders’ colocalization coefficient between TANGO1SΔPRD-mCh-iLID and each of the following proteins: EGFP-SspB-Sec23A, endogenous Sec31A, Sec13-GFP, and pmGFP-Sec16A at 0 (white box) and 3 min (gray box) of BL.Horizontal line in center represents median, whiskers represents maximum and minimum range of data, while the box indicates 1st and 3rd quartile. Significance level: ns, not significant, p > 0.05, *p < 0.01, ***p< 0.001, ****p < 0.0001; Mann-Whitney test. See also Figures S2 and S3 and Video S2.
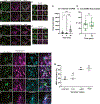
Figure 3.
Figure 3.. ERES drifts to MTOC upon prolonged TANGO1SΔPRD and Sec23A binding
(A and B) Airyscan-acquired time-lapse snapshots of a U2OS cell co-expressing EGFP-SspB-Sec23A (green) and TANGO1SΔPRD-mCh-iLID (magenta), exposed to BL for (A) 3 and (B) 20 min (Video S3). Scale bars, 10 μm. (A) ERES marked by EGFP-SspB-Sec23A colocalized with TANGO1SΔPRD-mCh-iLID, shown as white puncta in the merged and zoomed image (yellow arrowheads). ERES are heterogeneously spread at the periphery and the juxtanuclear region of the cells. (B) At 20 min, ERES are accumulated at the juxtanuclear region of the cell. Only a few peripheral ERES are still visible (Scale bars, 5 μm in zoom). (C and D) Snapshots of a time lapse of U2OS cell co-expressing EGFP-SspB-Sec23A (green) and TANGO1SΔPRD-mCh-iLID (magenta), pre-treated with nocodazole (10.0 μM) for 30 min prior to exposure to BL for (C) 3 and (D) 20 min. Scale bars, 10 μm. (C) ERES marked by EGFP-SspB-Sec23A colocalized with TANGO1SΔPRD-mCh-iLID are observed all over the cell, shown as white puncta in merged and zoomed image (yellow arrowheads). ERES are homogeneously spread in the cells. (D) The same cell at 20 min shows no significant change in location of the ERES. (Scale bars, 5 μm in zoom). See also Video S3.
Figure 4.
Figure 4.. Stable Sec23-TANGO1SΔPRD interaction interferes with cargo export from ERES
(A–C, E, and F) Airyscan-acquired time-lapse snapshots of a U2OS cell stably co-expressing SspB-Sec23A and TANGO1SΔPRD-mCh-iLID, transfected with EGFP-FM4-PAUF (Video S4). Cells were exposed to BL for (A) 0 min, (B) 20 min, and (C) no BL 20 min (after 20 min of BL) in the absence of D/D solubilizer. D/D solubilizer pre-treated cells were exposed to (E) BL 20 min, (F) BL 20 min + no BL 20 min; scale bars, 10 μm. Scale bars in zoomed images, 5 μm. (A) EGFP-FM4-PAUF appears in the ER (yellow arrowheads) and is not present in the Golgi region (yellow dotted box). TANGO1SΔPRD-mCh-iLID is present in the ER membrane. (B) Exposure to BL (20 min) accumulates TANGO1SΔPRD-mCh-iLID puncta near the nuclear region of cell (yellow arrowheads) without affecting EGFP-FM4-PAUF location. (C) Plot showing Pearson correlation coefficient (PCC) mean of TANGO1SΔPRD-mCh-iLID and EGFP-FM4-PAUF against time with (filled gray bars) and without (empty bars) D/D solubilizer. Without D/D solubilizer, no change was observed in the PCC at 20 min (p value not significant). With D/D solubilizer, significant PCC difference observed at 15 and 20 min. Cell exposed to 20 min of BL followed by 20 min no BL (denoted as 20 + 20′, bold gray bar) showed no difference in PCC from time 0. Error bars indicate standard deviation. Significance indicated by asterisks: *p < 0.05, **p < 0.01. One sample t test against theoretical mean applied. (D) EGFP-FM4-PAUF remains localized in the ER and TANGO1SΔPRD-mCh-iLID disperses back into the ER membrane. (E) EGFP-FM4-PAUF is observed in ER and accumulated with TANGO1SΔPRD-mCh-iLID puncta near nuclear regions (yellow arrowheads). (F) TANGO1SΔPRD-mCh-iLID disperses into the ER membrane; EGFP-FM4-PAUF reduces in the ER, concentrating in the juxtanuclear region within 20 min. (G and H) Boxplot of Manders’ colocalization coefficient between EGFP-FM4-PAUF and (G) GalNAc-T2 and (H) TANGO1SΔPRD-mCh-iLID under three different conditions: (1) no exit (no BL + no D/D solubilizer), (2) exit (no BL + D/D solubilizer), and (3) blocked exit (20 min BL + D/D solubilizer). Horizontal line in center represents median, whiskers represents maximum and minimum range of data, while the box indicates 1st and 3rd quartile. Significance level: ns, not significant p > 0.05, *p < 0.01, ***p < 0.001, ****p < 0.0001, Mann-Whitney test. See also Figure S4 and Video S4.
Figure 5.
Figure 5.. Anterograde transport of ERGIC53 is blocked but retrograde transport is unaffected with BL
(A–C) Airyscan-acquired time-lapse snapshots of a U2OS cell stably co-expressing SspB-Sec23A and TANGO1SΔPRD-mCh-iLID (magenta), transfected with ERGIC53-GFP (green) in (A)–(C) and (H) absence (Video S5) and (E)–(G) presence of cycloheximide (100 μM). Scale bars, 10 μm (in zoomed image, 5 μm). (A) At 0 min of BL, ERGIC53-GFP is localized predominantly in the juxtanuclear region (tubulovesicular clusters, shown in zoom) and discrete puncta spread throughout the cell. TANGO1SΔPRD-mCh-iLID spread in the ER membrane. (B) After 3 min of BL exposure, more discrete puncta of ERGIC53-GFP are observed. TANGO1SΔPRD-mCh-iLID is seen at discrete puncta (ERES), colocalized with ERGIC53-GFP (shown as white puncta marked by yellow arrowheads). (C) After continued BL exposure (20 min), ERGIC53-GFP is present in puncta marked by TANGO1SΔPRD-mCh-iLID in the juxtanuclear region (yellow arrowheads, zoom). The peripheral ERES marked by TANGO1SΔPRD-mCh-iLID are observed colocalized with ERGIC53-GFP. (D) Boxplot of Pearson correlation coefficient (PCC) mean of TANGO1SΔPRD-mCh-iLID and ERGIC53-GFP at BL exposure (0, 3, and 20 min), showing significant increased PCC between the two proteins at 20 min. (One sample t test against theoretical mean.) Significance level: *p < 0.05. (E–G) In cycloheximide-treated cells (30 min prior to imaging), (E) ERGIC53-GFP is present at the juxtanuclear region at time 0, and (F) is observed localized with puncta marked by TANGO1SΔPRD-mCh-iLID after 20 min of BL, and (G) resumes its juxtanuclear localization with no BL for an additional 20 min. Scale bars, 10 μm (in zoomed image, 5 μm). (H) Representative regions from Video S5 at various time points. ERGIC53-GFP is observed as tubular structures moving away from the juxtanuclear region. (I) Plot of Pearson correlation coefficient (PCC) mean of TANGO1SΔPRD-mCh-iLID and ERGIC53-GFP at time 0 and 20 min of exposure to BL, and 20 + 20′ (20 min BL + 20 min no BL). Significant change in the PCC was observed at 20 min (p < 0.05, one sample t test against theoretical mean). Significance level: *p < 0.05, **p < 0.01. See also Figure S4 and Video S5.
Figure 6.
Figure 6.. Limited impact on mannosidase II organization with prolonged Sec23A-TANGO1S binding
(A–C) Airyscan-acquired time-lapse snapshots (Video S6) show U2OS cells co-expressing SspB-Sec23A and TANGO1SΔPRD-mCh-iLID (magenta), transfected with ManII-GFP (green) exposed to BL for (A) 0, (B) 20, and (C) 40 min. Scale bars, 10 μm. ManII-GFP is observed as tubular structures in the juxtanuclear region and remains unchanged across the time points. TANGO1SΔPRD-mCh-iLID spread in the ER membrane (A) is observed concentrating as puncta in close contact with cisternae of ManII-GFP (yellow arrowheads, zoom and merge) at 20 and 40 min (B) and (C). Scale bars in zoomed images, 2 μm. (D) Pearson correlation coefficient mean of TANGO1SΔPRD-mCh-iLID and ManII-GFP at 0, 20, and 40 min of BL exposure. Significant change in the PCC observed for 20 min (p < 0.05) and 40 min (p < 0.005), one sample t test against theoretical mean. Statistical levels: *p < 0.05 and **p < 0.01. (E and F) Additional time-lapse snapshots post cycloheximide treatment (100 μM, 30 min) at (E) 0 min and (F) 40 min of BL exposure. Scale bars, 10 μm (in zoomed images 2 μm). (G) Pearson correlation coefficient (PCC) mean of TANGO1SΔPRD-mCh-iLID and ManII-GFP in cycloheximide-treated cell exposed to BL for 0 and 40 min (one sample t test against theoretical mean). Statistical levels: *p < 0.05. See also Figure S4 and Video S6.
Figure 7.
Figure 7.. Cargo selectivity at ERES
Snapshots from time-lapse of a U2OS cell stably co-expressing SspB-Sec23A and TANGO1SΔPRD-mCh-iLID and transfected with (A–C) ss-GFP (Video S7) and (D–F) collagen VII-GFP (Video S8) (A) At 0 min of BL, ss-GFP is observed in the ER and Golgi region. TANGO1SΔPRD-mCh-iLID is spread in the ER membrane. (B) At 3 min of BL, TANGO1SΔPRD-mCh-iLID is observed in discrete puncta throughout the cell. (C) Representative ERES colocalized with ss-GFP (1 and 2 yellow arrows) and not colocalized with ss-GFP (3 white arrows) are shown in zoom. Scale bars, 1 μm. (D) At 0 min of BL, collagen VII-GFP is expressed in the cells as puncta and fibrillar structures (yellow arrowheads). (E) At 3 min of BL, collagen VII-GFP is observed colocalized at the ERES marked by TANGO1SΔPRD-mCh-iLID. (F) Shown in zoom are tubular structures of collagen VII-GFP connected to, as well as colocalized with, ERES (1 and 2 yellow arrows). Some ERES are not localized with collagen VII-GFP (3 white arrows). Scale bars, 1 μm. (G) A plot of change in grayscale values (intensity) of endogenous collagen I associated with ERES marked by Sec31A with BL exposure for 0, 3, and 20 min. A significant decrease is observed from 0 to 3 min (p < 0.05) and a significant increase is observed at 20 min (p < 0.001). Asterisks denote statistical significance: *p < 0.05, **p < 0.01, ***p < 0.001. One-way ANOVA test with Tukey’s multiple comparison test applied in each pair. (H) Boxplot of % association of endogenous collagen I with ERES (Sec31A) when exposed to BL for 3 and 20 min. Each point represents the number of ERES in association with collagen I in 11 cells. Horizontal lines represent the median and the plus sign represents the mean. Statistical analysis using the Wilcoxon signed-rank test revealed p > 0.05, ns. (I–L) Microscopy image of U2OS cell co-expressing TANGO1SΔPRD-mCh-iLID (magenta) and SspB-Sec23A, irradiated with BL for 20 min. Cells were fixed and stained with antibodies against endogenous collagen I and (I) Sec31A, (J) ERGIC53, (K) calreticulin, and (L) HSP47. For TANGO1SΔPRDmCh-iLID, antibody against mCherry was used to enhance its signal. (I) Endogenous collagen I appear as tubules and puncta in the cell. The two segments of tubular collagen I at ERES are shown, “segment A” that colocalizes with ERES (TANGO1SΔPRDmCh-iLID, marked by white arrowhead) and “segment B” that does not colocalize with the ERES (marked by yellow arrowhead). Zoomed image shows a tubular structure of collagen I, where segment A is localized with (I) Sec31A, (J) ERGIC53, (K) calreticulin, and (L) HSP47 (marked in white arrowhead) enriched with TANGO1SΔPRD-mCh-iLID. Segment B is not localized with (K) calreticulin and (L) HSP47, respectively. (M) Plot of % of ERES occupied by secretory cargoes in cells stably expressing TANGO1SΔPRD-mCh-iLID and SspB-Sec23A upon BL exposure (3 min). Cargoes shown are collagen VII-GFP, endogenous collagen I, ss-GFP, and soluble EGFP-FM4-PAUF. n = 3 (more details in STAR Methods). See also Figure S5 and Videos S7 and S8.)

References

    1. Aridor M (2018). COPII gets in shape: lessons derived from morphological aspects of early secretion. Traffic 19, 823–839. 10.1111/tra.12603. - DOI - PubMed
    1. Beller M, Sztalryd C, Southall N, Bell M, Jäckle H, Auld DS, and Oliver B (2008). COPI complex is a regulator of lipid homeostasis. PLoS Biol. 6, e292. 10.1371/journal.pbio.0060292. - DOI - PMC - PubMed
    1. Tang BL, Wang Y, Ong YS, and Hong W (2005). COPII and exit from the endoplasmic reticulum. Biochim. Biophys. Acta 1744, 293–303. 10.1016/j.bbamcr.2005.02.007. - DOI - PubMed
    1. Orci L, Ravazzola M, Meda P, Holcomb C, Moore HP, Hicke L, and Schekman R (1991). Mammalian Sec23p homologue is restricted to the endoplasmic reticulum transitional cytoplasm. Proc. Natl. Acad. Sci. USA 88, 8611–8615. 10.1073/pnas.88.19.8611. - DOI - PMC - PubMed
    1. Hammond AT, and Glick BS (2000). Dynamics of transitional endoplasmic reticulum sites in vertebrate cells. Mol. Biol. Cell 11, 3013–3030. 10.1091/mbc.11.9.3013. - DOI - PMC - PubMed

Publication types

MeSH terms

Substances

LinkOut - more resources