. 2024 Jul 11;7(9):e202402765.
doi: 10.26508/lsa.202402765. Print 2024 Sep.

Dual-localized PPTC7 limits mitophagy through proximal and dynamic interactions with BNIP3 and NIX

Affiliations

Dual-localized PPTC7 limits mitophagy through proximal and dynamic interactions with BNIP3 and NIX

Lianjie Wei et al. Life Sci Alliance. .

Abstract

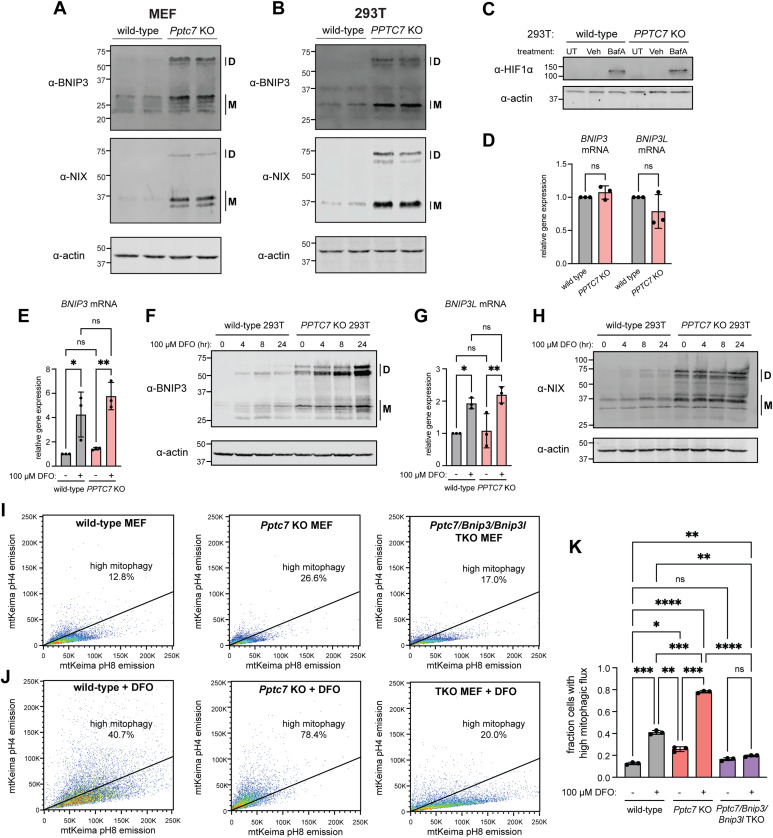
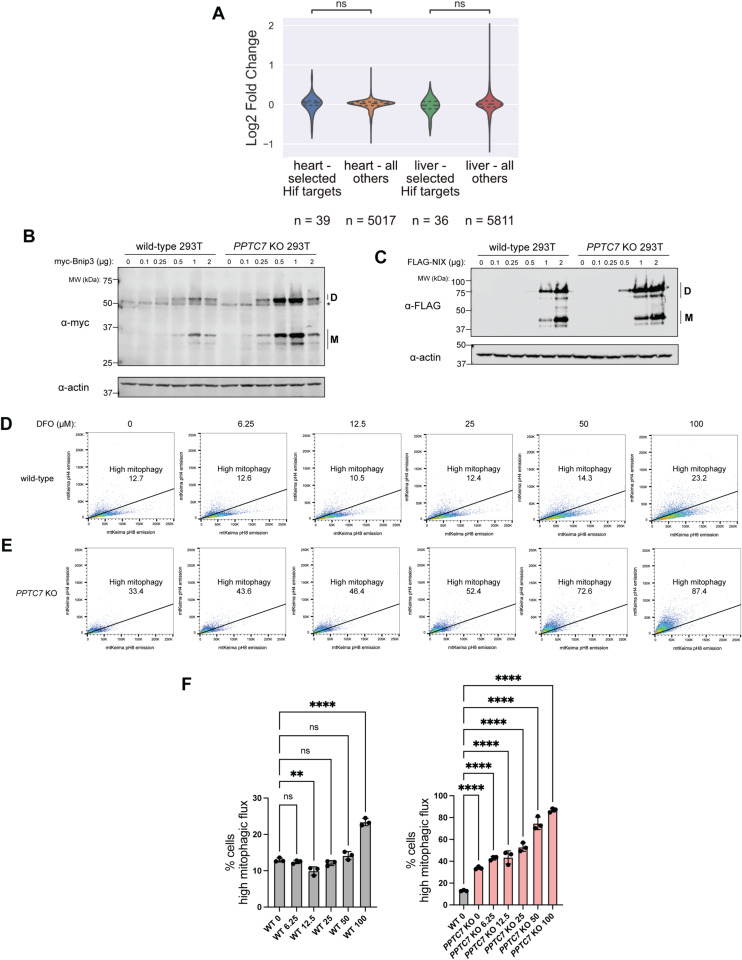
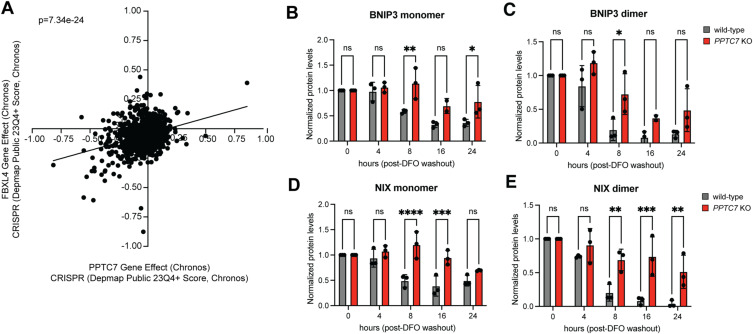
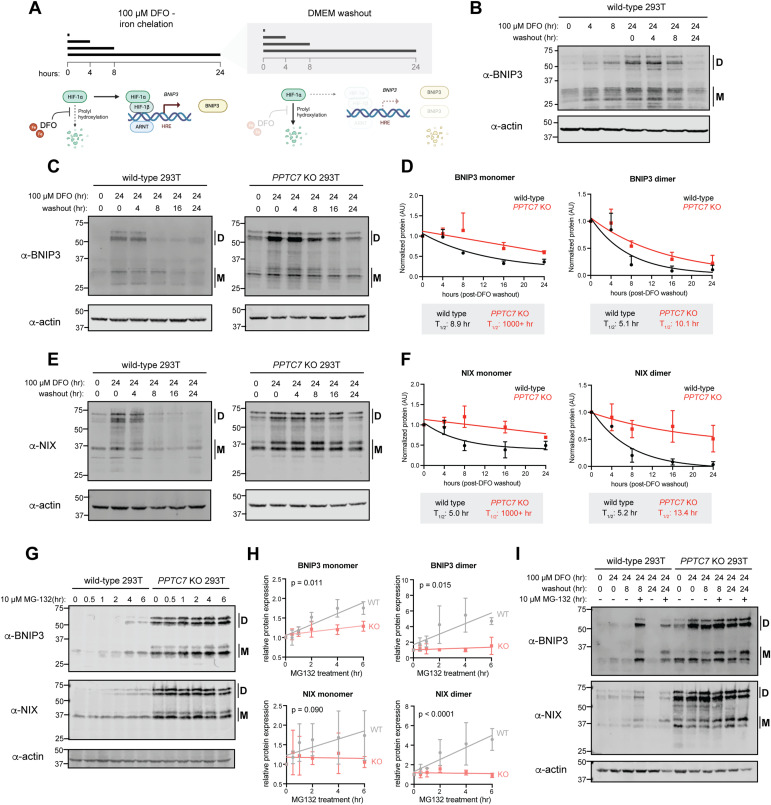
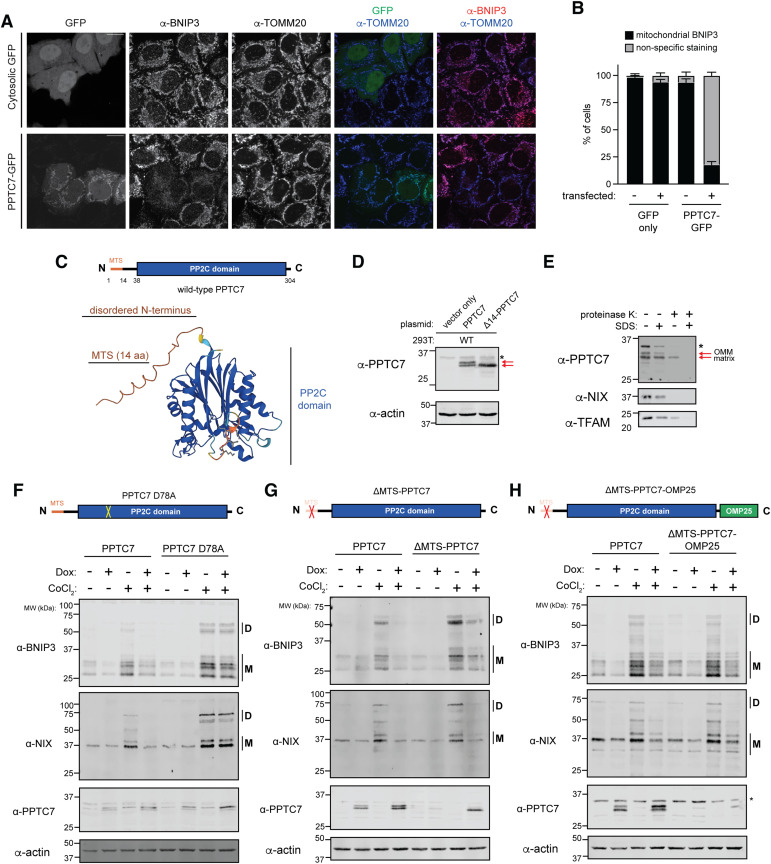
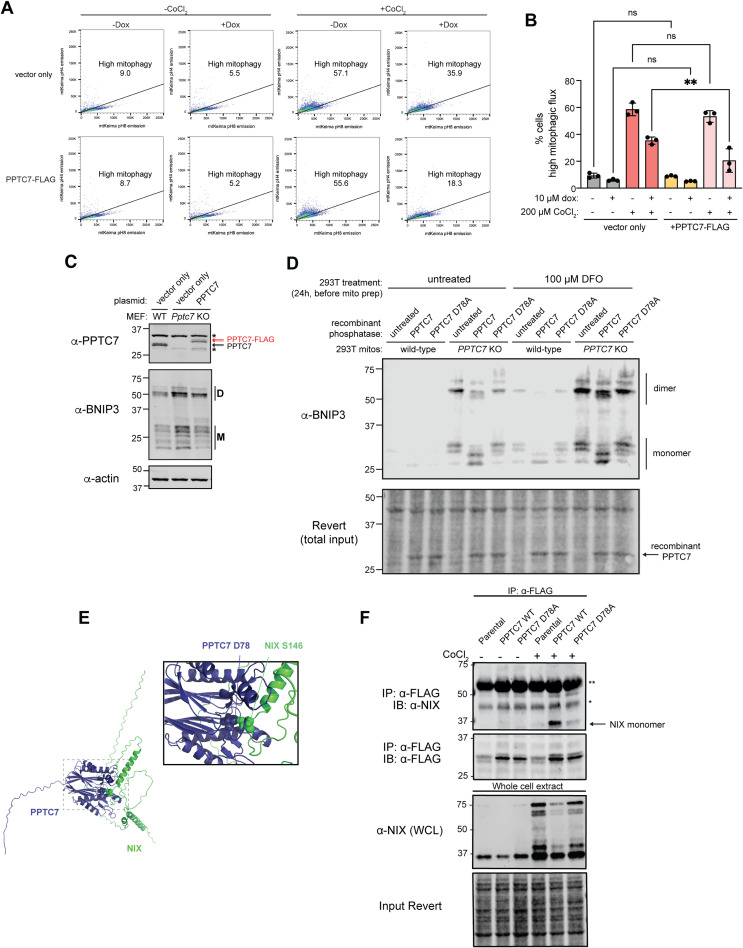
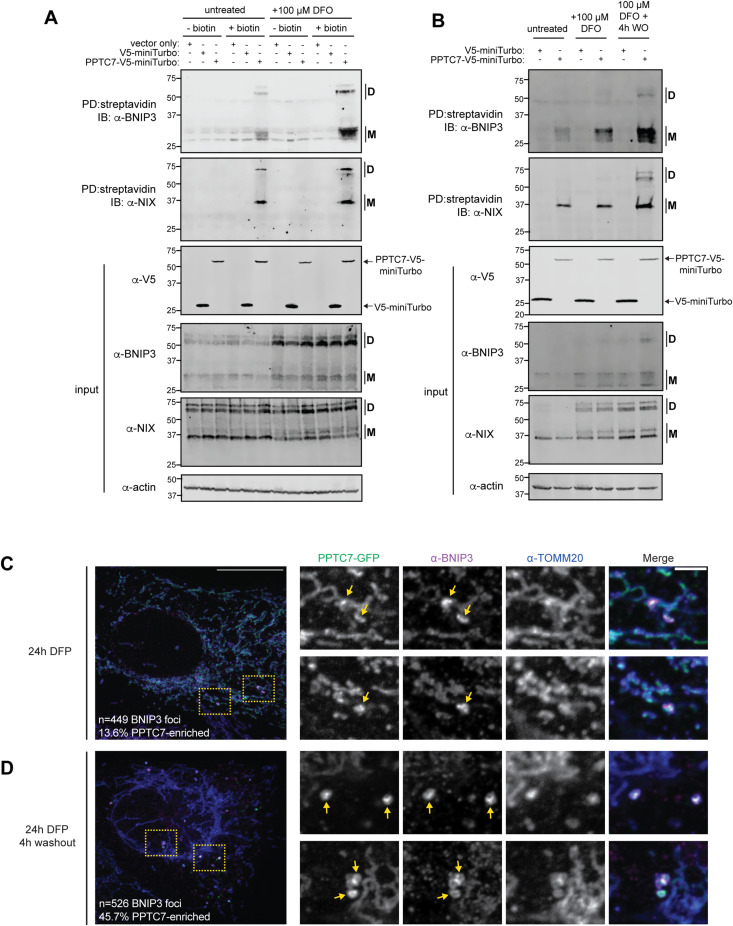
PPTC7 is a mitochondrial-localized phosphatase that suppresses BNIP3- and NIX-mediated mitophagy, but the mechanisms underlying this regulation remain ill-defined. Here, we demonstrate that loss of PPTC7 upregulates BNIP3 and NIX post-transcriptionally and independent of HIF-1α stabilization. Loss of PPTC7 prolongs the half-life of BNIP3 and NIX while blunting their accumulation in response to proteasomal inhibition, suggesting that PPTC7 promotes the ubiquitin-mediated turnover of BNIP3 and NIX. Consistently, overexpression of PPTC7 limits the accumulation of BNIP3 and NIX protein levels, which requires an intact catalytic motif but is surprisingly independent of its targeting to mitochondria. Consistently, we find that PPTC7 is dual-localized to the outer mitochondrial membrane and the matrix. Importantly, anchoring PPTC7 to the outer mitochondrial membrane is sufficient to blunt BNIP3 and NIX accumulation, and proximity labeling and fluorescence co-localization experiments demonstrate that PPTC7 dynamically associates with BNIP3 and NIX within the native cellular environment. Collectively, these data reveal that a fraction of PPTC7 localizes to the outer mitochondrial membrane to promote the proteasomal turnover of BNIP3 and NIX, limiting basal mitophagy.


Conflict of interest statement

The authors declare that they have no conflict of interest.

Figures

Figure 1.
Figure 1.. BNIP3 and NIX are upregulated post-transcriptionally and independent of HIF-1α in PPTC7 KO cells.
(A, B) Western blots of BNIP3 (top panels), NIX (middle panels) and actin (serving as a load control, bottom panels) in wild-type or Pptc7 KO MEFs (A) or in wild-type or PPTC7 KO 293T cells (B). “D” indicates dimer species; “M” indicates monomer species. (C) Western blot for HIF-1α in untreated (UT), vehicle only (veh, 0.2% DMSO) or 100 nM bafilomycin A (BafA) for 16 h in wild-type and PPTC7 KO 293T cells. Actin shown as a loading control. (D) qRT-PCR of BNIP3 and BNIP3L (gene name of NIX) endogenous mRNA levels in wild-type (gray) and PPTC7 KO (pink) 293T cells. Error bars represent SD; data points represent independent experiments. (E) qRT-PCR of BNIP3 RNA levels in untreated and DFO-treated (100 μM, 24 h) wild-type (gray) and PPTC7 KO (pink) 293T cells. **P < 0.01, *P < 0.05, ns = not significant, ordinary one-way ANOVA. Error bars represent SD; data points represent independent experiments. (F) Western blotting for endogenous BNIP3 levels in wild-type or PPTC7 KO 293T cells treated with 100 μM DFO for indicated times. Actin shown as a loading control. (G) qRT-PCR of BNIP3L RNA levels in untreated and DFO-treated (100 μM, 24 h) wild-type (gray) and PPTC7 KO (pink) 293T cells. **P < 0.01, *P < 0.05, ns = not significant, ordinary one-way ANOVA. Error bars represent SD; data points represent independent experiments. (H) Western blotting for endogenous NIX levels in wild-type or PPTC7 KO 293T cells treated with 100 μM DFO for indicated times. Actin shown as a loading control. (I) FACS plots of basal mitophagy in wild-type (left), Pptc7 KO (middle), and Pptc7/Bnip3/Bnip3l TKO MEFs using the mt-Keima fluorescence assay. Cells undergoing high mitophagy are above the diagonal line; percentages indicated in figure. (J) FACS plots of mitophagy rates upon 24 h of 100 μM DFO treatment in wild-type (left), Pptc7 KO (middle), and Pptc7/Bnip3/Bnip3l TKO MEFs using the mt-Keima fluorescence assay. (I, J, K) Quantification of mt-Keima data shown in (I, J). ****P < 0.0001, ***P < 0.001, **P < 0.01, *P < 0.05, ns = not significant, ordinary one-way ANOVA. Error bars represent SD; data points represent individual biological replicates.
Figure S1.
Figure S1.. PPTC7 influences BNIP3- and NIX-mediated mitophagy post-transcriptionally.
(A) Analysis of select HIF-responsive targets in Pptc7 KO heart and liver proteomics datasets collected in Niemi et al (2019). (B, C) Western blots of exogenous BNIP3 (B) or NIX (C) expressed in wild-type PPTC7 KO 293T cells at various plasmid concentrations. “D” indicates dimer species, “M” indicates monomer species. Actin shown as a loading control. (D, E) FACS analysis of mt-Keima positive wild-type (D) and Pptc7 KO (E) MEFs showing high mitophagy rates in response to variable DFO concentrations. (D, E, F) Statistical analysis of data by ordinary one-way ANOVA shown in (D, E), gray bars = wild-type samples, pink bars = Pptc7 KO samples. ****P < 0.0001, ***P < 0.001, **P < 0.01, ns = not significant. Error bars represent SD, data points represent individual biological replicates (n = 3).
Figure S2.
Figure S2.. Loss of PPTC7 significantly affects BNIP3 and NIX turnover rates.
(A) DepMap essentiality profiles of PPTC7 gene effect (x-axis) and FBXL4 gene effect (y-axis). Linear regression analysis and associated P-value shown. (B, C, D, E) Statistical analysis of BNIP3 and NIX monomer and dimer turnover rate data in wild-type (gray bars) and PPTC7 KO (red bards) 293T cells shown in Fig 2. ****P < 0.0001, ***P < 0.001, **P < 0.01, *P < 0.05, ns = not significant, ordinary one-way ANOVA. Error bars represent SD, data points represent individual biological replicates (n = 3).
Figure 2.
Figure 2.. BNIP3 and NIX have decreased turnover rates and are less responsive to proteasomal inhibition in PPTC7 KO cells.
(A) Schematic of DFO treatment and washout timeline and mechanism; figure made with BioRender. (B) Western blot of endogenous BNIP3 protein after indicated times of DFO treatment and washout, when applicable. “D” indicates dimer species; “M” indicates monomer species. Actin shown as a loading control. (C) Western blot of endogenous BNIP3 protein after indicated times of DFO treatment and washout in wild-type (left panel) and PPTC7 KO (right panel) 293T cells. “D” indicates dimer species; “M” indicates monomer species. Actin shown as loading control. (C, D) Quantification of data shown in (C). BNIP3 monomer (left graph) or dimer (right graph) bands were quantified using densitometry, averaged, and plotted over time. Data were fit with a one-phase decay model to calculate protein half-lives (T1/2), which are shown below each graph. Error bars represent standard deviations of normalized densitometry across three independent experiments. (E) Western blot of endogenous NIX protein after indicated times of DFO treatment and washout in wild-type (left panel) and PPTC7 KO (right panel) 293T cells. “D” indicates dimer species; “M” indicates monomer species. Actin shown as loading control. (E, F) Quantification of data shown in (E). NIX monomer (left graph) or dimer (right graph) bands were quantified using densitometry, averaged, and plotted over time. Data were fit with a one-phase decay model to calculate protein half-lives (T1/2), which are shown below each graph. Error bars represent standard deviations of normalized densitometry across three independent experiments. (G) Western blots of endogenous BNIP3 (top panel) and NIX (bottom panel) in wild-type and PPTC7 KO 293T cells upon treatment with 10 μM MG-132 for the indicated timeframes. “D” indicates dimer species; “M” indicates monomer species. Actin shown as a loading control. (G, H) Quantification of BNIP3 and NIX monomer (left graphs) and dimer (right graphs) populations in wild-type (gray) and PPTC7 KO (pink) cells shown in (G). Bands were quantified using densitometry, averaged, and plotted over time. Data were analyzed via linear regression, and the significance between slopes was calculated using Analysis of Covariance (ANCOVA). (I) Western blot of endogenous BNIP3 and NIX proteins in wild-type and PPTC7 KO cells after DFO treatment and subsequent washout in the presence or absence of 10 μM MG-132. “D” indicates dimer species; “M” indicates monomer species. Actin shown as a loading control.
Figure 3.
Figure 3.. PPTC7 requires an intact catalytic motif but not mitochondrial targeting to suppress BNIP3 and NIX accumulation.
(A) Representative single-plane confocal images of GFP only (top panels) or PPTC7-GFP (bottom panels) expressed in HeLa cells treated for 12 h with 500 μM CoCl2. Cells were stained for BNIP3 (second column) or TOMM20 (third column). Overlays are shown for GFP and TOMM20 (fourth column) and GFP and BNIP3 (fifth column). Scale bar = 20 μm. (A, B) Quantification of data shown in (A), mitochondrial BNIP3 staining versus non-specific staining in cells overexpressing GFP only or PPTC7-GFP versus matched untransfected controls for each experiment. Error bars represent the standard error of the mean of three independent experiments. (C) Schematic of PPTC7 features, including a mitochondrial targeting sequence (MTS) and PP2C phosphatase domain, top. Bottom, AlphaFold2 representation of PPTC7 structure; predicted disordered N-terminus and PP2C phosphatase domains indicated. (D) Western blot of 293T cells overexpressing PPTC7 or a ΔMTS-PPTC7 mutant. Red arrows indicate dual species in wild-type PPTC7 expression. * represents a non-specific band. Actin shown as a loading control. (E) PPTC7 protease protection assay. Mitochondria from HeLa FLP-IN cells expressing PPTC7 were isolated and treated with SDS, proteinase K, or both and resolved via SDS–PAGE. Western blots of PPTC7 (top), the outer mitochondrial membrane marker NIX (middle) and the matrix marker TFAM (bottom) shown. (F, G, H) Western blots of BNIP3, NIX, and PPTC7 depicting the ability of various mutants of PPTC7 to suppress BNIP3 and NIX accumulation in response to CoCl2 treatment. “D” indicates dimer species, “M” indicates monomer species. In (F), a catalytic mutant of PPTC7, D78A, cannot effectively suppress BNIP3 and NIX accumulation relative to wild-type PPTC7. In (G), the ΔMTS-PPTC7 mutant partially or fully suppresses BNIP3 and NIX accumulation, respectively. In (H), a mutant that artificially anchors PPTC7 to the outer mitochondrial membrane, ΔMTS-PPTC7-OMP25, suppresses BNIP3 and NIX accumulation. Actin shown as a loading control.
Figure S3.
Figure S3.. PPTC7 interacts with BNIP3 and/or NIX to influence mitophagy.
(A) FACS data shown for data represented in Fig 2D. Cells undergoing high mitophagy are above the diagonal line; percentages indicated in the figure. (B) Quantification of mt-Keima positive mitophagic flux in HeLa FLP-IN TREx cells expressing vector only (left) or PPTC7-FLAG in the presence of 10 μM doxycycline (dox, to promote PPTC7 expression), 200 μM cobalt chloride (CoCl2), or both. **P < 0.01, ns = not significant, ordinary one-way ANOVA. Error bars represent SD. Each dot represents an independent biological replicate (n = 3). (C) Western blot of PPTC7 expressed in wild-type MEFs (black arrows), Pptc7 KO MEFs, or Pptc7 KO MEFs rescued with human PPTC7 (red arrows). * represents a non-specific band. Basal BNIP3 levels across samples shown below; actin shown as a loading control. (D) Western blot of BNIP3 in crude mitochondria isolated from wild-type or PPTC7 KO 293T cells. Mitochondria were left untreated, treated with recombinant PPTC7, or treated with recombinant PPTC7 D78A. Revert stain is shown for loading; equal loading of recombinant proteins can be seen as depicted by arrows. (E) Alphafold2 model of PPTC7-NIX interaction suggesting PPTC7 D78 and NIX S146 as binding sites. (F) Western blot of NIX monomer immunoprecipitation with FLAG-tagged PPTC7 WT and PPTC7 D78A in whole cell extract. Whole-cell extracts were subjected to immunoprecipitation with anti-FLAG agarose beads and immunoblotted as indicated. Revert stain shown as a loading control.
Figure 4.
Figure 4.. PPTC7 proximally and dynamically interacts with BNIP3 and NIX in cells.
(A) Proximity labeling of PPTC7-V5-miniTurbo in 293T cells with or without 24-h deferoxamine (DFO) treatment. PPTC7-V5-miniTurbo, as well as vector only or V5-miniTurbo-only controls, were transfected into 293T cells. Streptavidin pulldowns were used to enrich for PPTC7-V5-miniTurbo interactors, which were run on SDS–PAGE gels and western blotted for BNIP3 (top blot) or NIX (second blot). Only PPTC7-V5-miniTurbo + biotin samples pulled down BNIP3 and NIX (lanes 6 and 12, streptavidin pull-down gels), indicating specific binding. Western blots shown for reaction input for pulldowns for V5 (showing miniTurbo constructs), BNIP3, NIX, and actin (serving as a load control). (B) Proximity labeling of PPTC7-V5-miniTurbo in 293T cells with after 24 h DFO treatment with or without 4 h DFO washout. Streptavidin pulldowns were used to enrich PPTC7-V5-miniTurbo interactors as described in (A). Western blots shown for reaction input for pulldowns as described in (A). (C) A representative maximum z-projection confocal image (left) and corresponding single plane insets (right) are shown of a U2OS cell overexpressing PPTC7-GFP and treated with deferiprone for 24 h. Cells were fixed and stained for BNIP3 and TOMM20 to visualize co-enrichment of PPTC7 with BNIP3-enriched foci (n = 449). (D) As in (C) for cells treated for 24 h with deferiprone and washed for an additional 4 h before fixation. Cells were stained to visualize co-enrichment of PPTC7 with BNIP3-enriched foci (n = 526).

Update of

Similar articles

Cited by

References

    1. Abeliovich H, Zarei M, Rigbolt KTG, Youle RJ, Dengjel J (2013) Involvement of mitochondrial dynamics in the segregation of mitochondrial matrix proteins during stationary phase mitophagy. Nat Commun 4: 2789. 10.1038/ncomms3789 - DOI - PMC - PubMed
    1. Allen GFG, Toth R, James J, Ganley IG (2013) Loss of iron triggers PINK1/Parkin-independent mitophagy. EMBO Rep 14: 1127–1135. 10.1038/embor.2013.168 - DOI - PMC - PubMed
    1. Alsina D, Lytovchenko O, Schab A, Atanassov I, Schober FA, Jiang M, Koolmeister C, Wedell A, Taylor RW, Wredenberg A, et al. (2020) FBXL4 deficiency increases mitochondrial removal by autophagy. EMBO Mol Med 12: e11659. 10.15252/emmm.201911659 - DOI - PMC - PubMed
    1. Ballout RA, Al Alam C, Bonnen PE, Huemer M, El-Hattab AW, Shbarou R (2019) FBXL4-Related mitochondrial DNA depletion syndrome 13 (MTDPS13): A case report with a comprehensive mutation review. Front Genet 10: 39. 10.3389/fgene.2019.00039 - DOI - PMC - PubMed
    1. Bonnen PE, Yarham JW, Besse A, Wu P, Faqeih EA, Al-Asmari AM, Saleh MAM, Eyaid W, Hadeel A, He L, et al. (2013) Mutations in FBXL4 cause mitochondrial encephalopathy and a disorder of mitochondrial DNA maintenance. Am J Hum Genet 93: 471–481. 10.1016/j.ajhg.2013.07.017 - DOI - PMC - PubMed

MeSH terms

LinkOut - more resources