. 2024 Jul 11;15(1):5834.
doi: 10.1038/s41467-024-49400-z.

A scalable and cGMP-compatible autologous organotypic cell therapy for Dystrophic Epidermolysis Bullosa

Affiliations

A scalable and cGMP-compatible autologous organotypic cell therapy for Dystrophic Epidermolysis Bullosa

Gernot Neumayer et al. Nat Commun. .

Abstract

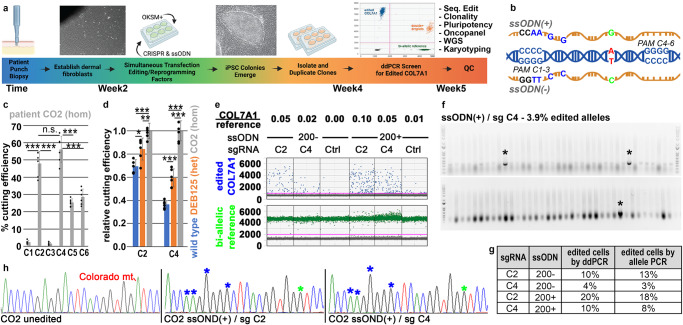
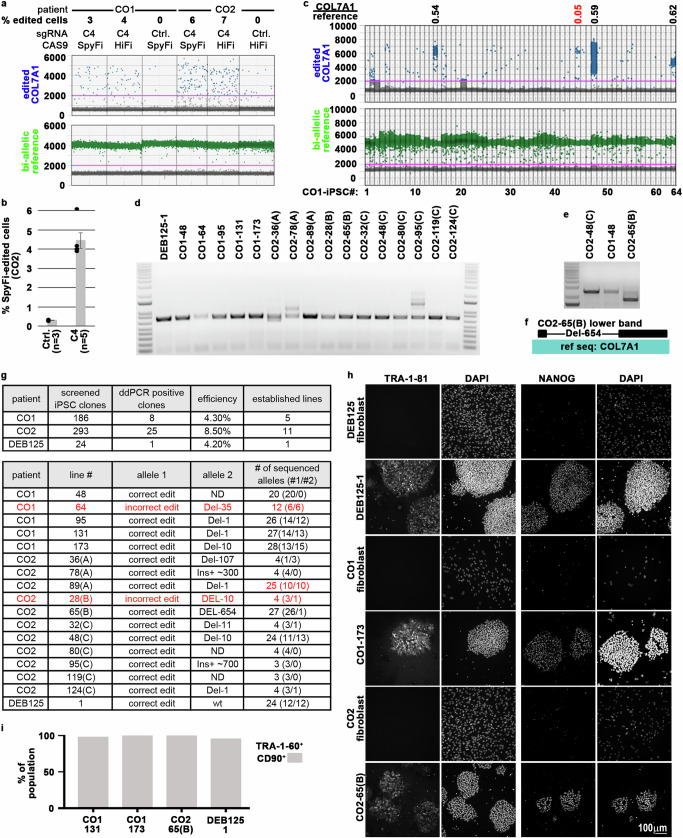
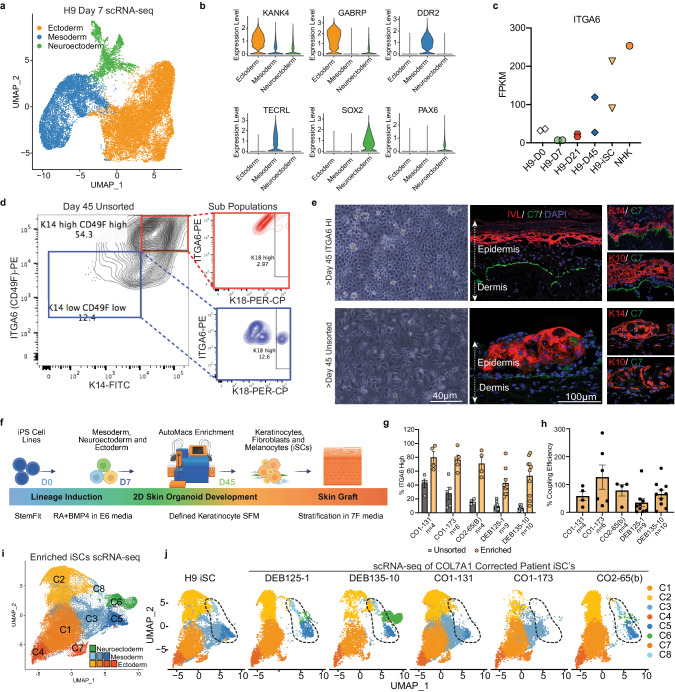
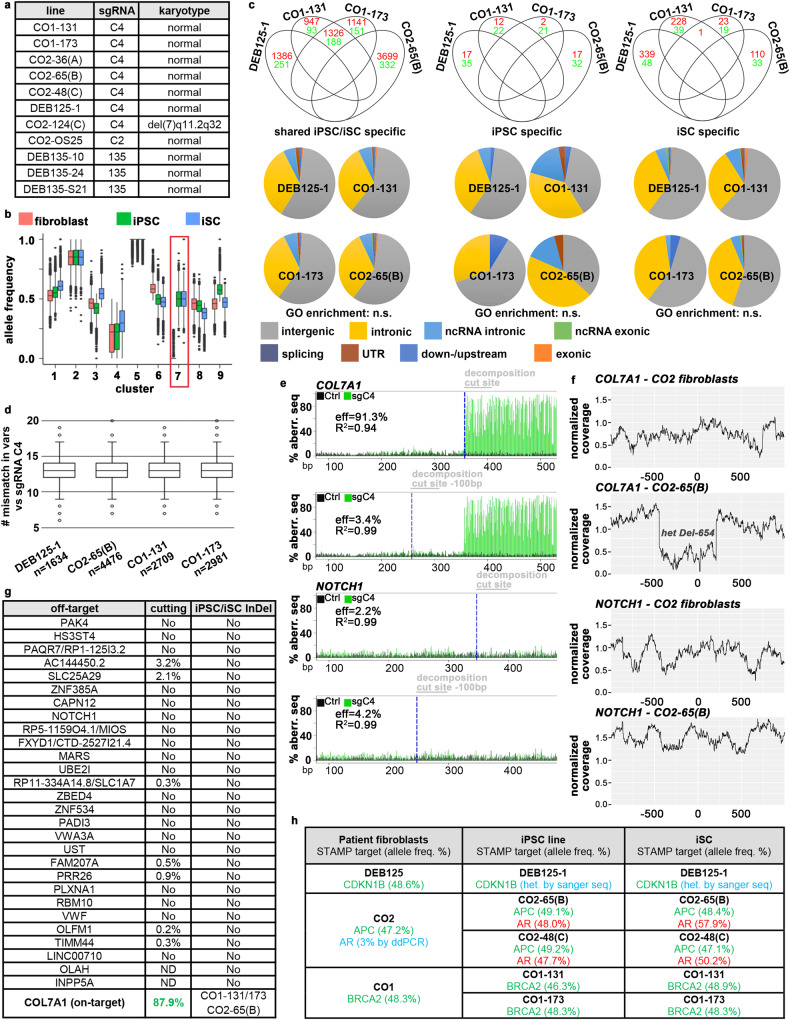
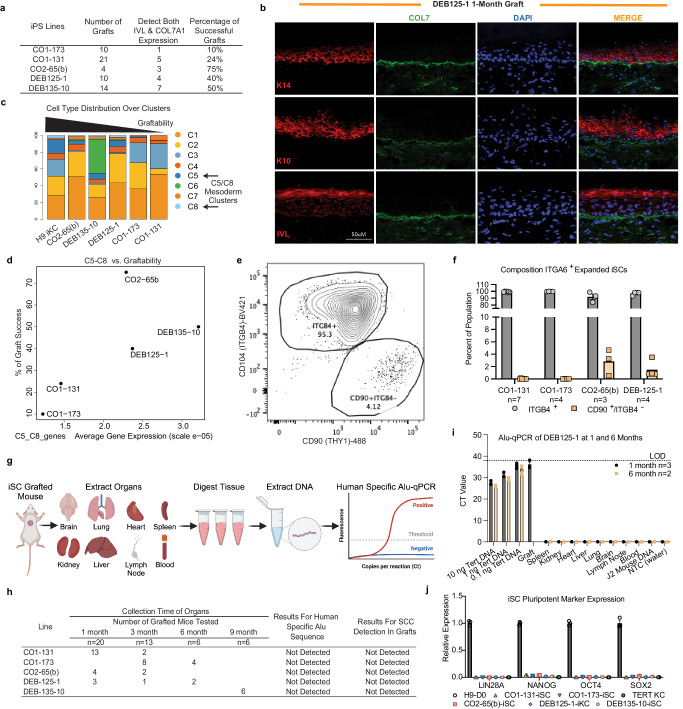
We present Dystrophic Epidermolysis Bullosa Cell Therapy (DEBCT), a scalable platform producing autologous organotypic iPS cell-derived induced skin composite (iSC) grafts for definitive treatment. Clinical-grade manufacturing integrates CRISPR-mediated genetic correction with reprogramming into one step, accelerating derivation of COL7A1-edited iPS cells from patients. Differentiation into epidermal, dermal and melanocyte progenitors is followed by CD49f-enrichment, minimizing maturation heterogeneity. Mouse xenografting of iSCs from four patients with different mutations demonstrates disease modifying activity at 1 month. Next-generation sequencing, biodistribution and tumorigenicity assays establish a favorable safety profile at 1-9 months. Single cell transcriptomics reveals that iSCs are composed of the major skin cell lineages and include prominent holoclone stem cell-like signatures of keratinocytes, and the recently described Gibbin-dependent signature of fibroblasts. The latter correlates with enhanced graftability of iSCs. In conclusion, DEBCT overcomes manufacturing and safety roadblocks and establishes a reproducible, safe, and cGMP-compatible therapeutic approach to heal lesions of DEB patients.


Conflict of interest statement

K.T. is CEO of iPeace, Inc. M.W. is a scientific advisor for iPeace, Inc. The remaining authors declare no competing interests.

Figures

Fig. 1
Fig. 1. Optimized editing of the COL7A1 Colorado mutation (7485 + 5 G > A).
a Overview of single-step editing/reprogramming. b Overview of the Colorado mutation (red) and ssODNs (4 silent mutations (blue); wild-type sequence (green)) used for gene editing. sgRNAs (C1–C6) engage 6 possible PAMs that mediate cutting via CRISPR/CAS9. c Absolute CRISPR/CAS9 cutting efficiencies in CO2 patient fibroblasts as mediated by sgRNA C1–C6 (n = 6 biological replicates; mean and SD are shown with individual data points overlayed as scatter plot). d Relative CRISPR/CAS9 cutting efficiencies of the homozygous (CO2), heterozygous (DEB125) Colorado or wild-type allele as mediated by sgRNA C2 or C4 in indicated patient fibroblasts (n = 6 biological replicates, except wild-type sgRNA C2 n = 5; mean and SD are shown with individual data points overlayed as scatter plot). c, d Statistical significances calculated via two-tailed homoscedastic t tests (*P < 0.05, **P < 0.01, ***P < 0.001, n.s. not significant; P values: c C1/C2 2.3E-08, C2/C3 1.8E-08, C1/C3 1.1E-01, C4/C5 2.6E-06, C5/C6 1.4E-01, C4/C6 1.9E-05, C2/C4 8.7E-02; d C2: wt/125 1.3E-02, wt/CO2 1.9E-05, 125/CO2 7.3E-03; C4: wt/125 5.5E-05, wt/CO2 1.2E-08, 125/CO2 6.2E-06). e COL7A1 editing efficiencies measured by ddPCR in CO2 primary patient fibroblasts after transfection with ssODNs and sgRNA/CAS9-containing RNPs as indicated. A bi-allelic locus (green) is used as a reference for calculating COL7A1 editing (blue) efficiencies. Ctrls omitted sgRNAs. f Agarose gels visualizing 77 E. coli colony PCRs detecting edited, Topo-cloned COL7A1 alleles from cells treated as in (e) with ssODN/sgRNA combinations as indicated (see Supplementary Fig. 1 for remaining ssODN/sgRNA combinations). A primer specific for silent mutations (b) only yields PCR products of edited alleles (asterisks). DNA size references were run in most left (top/bottom) and right (top) lanes (100–2000 bp ranges shown). g Summary of COL7A1 editing efficiencies achieved with different ssODN/sgRNA combinations as measured by ddPCR (e) or by Topo cloning of individual alleles (f). Mono-allelic edits were assumed for calculations (see discussion). h Sanger sequencing traces of unedited and edited alleles from (panel f and Supplementary Fig. 1h). Asterisks indicate integration of intended silent mutations (blue) and repair of the pathogenic mutation (green). Source data are provided as a Source Data file. Panel a created with BioRender.com released under a Creative Commons Attribution-NonCommercial-NoDerivs 4.0 International license.
Fig. 2
Fig. 2. Successful single manufacturing step editing/reprogramming of patients CO1, CO2, & DEB125.
a COL7A1 editing efficiencies measured by ddPCR in CO1 and CO2 patient fibroblasts after transfection with ssODN(+) and RNPs containing sgRNA C4 and high-fidelity CAS9 HiFi or SpyFi as indicated. A bi-allelic locus (green) is used as a reference for calculating COL7A1 editing (blue) efficiencies, assuming mono-allelic editing events. Ctrls omitted sgRNAs. b Reproducible COL7A1 editing in CO2 patient fibroblasts (as in (a)) with SpyFi CAS9 (n = biological replicates as indicated; mean and SEM are shown). c ddPCR screen of 64 single-step edited/reprogrammed iPS cell lines derived from patient CO1 fibroblasts. Ratios of edited COL7A1 alleles (blue) and a bi-allelic reference locus (green) are used to identify mono- (0.5 + /−0.19) or bi-allelic (1.0 + /−0.19) editing events (black values; red values below/above cutoff indicate mixed or incorrectly edited clones; see Supplementary Fig. 4). d, e Agarose gels visualizing PCR amplicons of a 731 bp (d) and 2418 bp (e) sequence surrounding the edited COL7A1 locus from single-step edited/reprogrammed iPS cell lines derived from three patients. Note some samples yield 2 PCR products, indicative of InDels on one of the COL7A1 alleles. InDels can be substantial (e.g., line CO2-65(B)), so they are only included on bigger (e) PCR products. DNA size references were run in most left (d, e) and right (d) lanes; 100–15,000 bp (d) or 1500–15,000 bp (e) range is shown. f Sanger sequencing of the smaller PCR product from line CO2-65(B) from (e) reveals a large 654 bp deletion. g Summary of single-step editing/reprogramming screens conducted with sgRNA C4/ssODN(+) from three patients as indicated (top). Topo cloning and sanger sequencing of PCR products (df) confirm correct COL7A1 editing on target alleles in 15 of 17 single-step edited/reprogrammed iPS cell lines. h Immunofluorescence microscopy images of iPS cells and parental fibroblasts stained for pluripotency markers TRA-1-81 and NANOG from three patients. DAPI visualized DNA, scale indicated. i Summary of flow cytometry analysis of iPS cells from three patients for CD90 and the pluripotency marker TRA-1-60 (see Supplementary Fig. 3d). Source data are provided as a Source Data file.
Fig. 3
Fig. 3. Generation of organotypic skin grafts at clinical scale.
a Uniform manifold approximation projection (UMAP) of integrated scRNA-seq of H9 ES cell differentiation towards iSCs on Day 7 reveals three lineages: ectoderm (orange), mesoderm (blue), and neuroectoderm (green). b Violin plots depicting relative expression (RPKM) of representative ectoderm, mesoderm and neuroectoderm genes across scRNA-seq clusters. c ITGA6 expression analyzed via RNA-seq in H9 ES cells during iSC differentiation. Time points as indicated (D: day; n = 2 biological replicates; NHKs used as positive control n = 1). d Flow cytometry of day 45 unsorted H9 ES cells. Cells double positive for ITGA6HI PE (y-axis) and K14HI FITC (x axis) are in high gate (red) and lower ITGA6/K14LOW expressing cells are in low gate (blue); expression of K18 (PER-CP; x axis) in subpopulations (right). n = 1. e Bright-field image (top left) of FACS sorted ITGA6HI H9 ES cell-derived iSCs expanded and used for organotypic stratification (top right). Note normal polarization and stratification; Collagen 7 (green), Involucrin (red), DAPI (blue); additional images, K14, K10 (red). Bright-field image (bottom left) of unsorted H9 ES cell-derived iSCs used for organotypic stratification (bottom right). Note disorganized layering and stratification. n = 1, scale indicated. f iPS cell to iSC differentiation strategy employing cell enrichment via AutoMACS pro-separator, following a defined cGMP-compatible protocol. g Flow cytometry analysis of % ITGA6 positivity measured before and after AutoMACS enrichment. h % Coupling efficiency (CE) determined by the equation (5) %CE= live sorted iSCs/iPS cell input*100. g, h Data from five independent differentiated patient cell lines (n = indicated; mean, SEM;). i UMAPs of integrated scRNA-seq data from five patient- and H9 ES-derived iSCs post-ITGA6 enrichment and in vitro expansion reveal 8 clusters (C1–C8) comprising the DEBCT product. j Individual UMAP plots from overlaid scRNA-seq datasets from (i) with color scheme as indicated. Four ectoderm (C1, C2, C4, C7), 3 mesoderm (C3, C8, C5), and 1 melanocyte/neuroectoderm-derived (C6) clusters were identified. C5/C8 clusters indicated by dotted outline were present at variable quantities (see text, Fig. 5 and Supplementary Fig. 7). Source data are provided as a Source Data file. Panel f created with BioRender.com released under a Creative Commons Attribution-NonCommercial-NoDerivs 4.0 International license.
Fig. 4
Fig. 4. Genomic and chromosomal stability.
a Normal karyotypes in 10 of 11 iPS cell lines from four patients. b k-means clustering of all variants (n = 111,741) found by whole-genome sequencing (WGS) in fibroblasts, iPS cells and iSCs from patient DEB125 (see Supplementary Data 2). Red frame highlights a sub-set with differential allele frequencies (AFs) in iPS cells/iSCs compared to fibroblasts. Boxes: interquartile ranges (25–75%), center lines: medians, whiskers: 1.5 times the interquartile range; outliers: circles. c Cutoff/odds ratio filtering (see Methods) identifies variants from WGS (red: SNPs; green: InDels) specifically found in cell types from indicated patient lines. Grouping in Venn diagrams indicates the absence of positive variant selection. The majority of cell-type-specific variants is found in intergenic or intronic sequences (pie charts). No gene ontology (GO) term enrichment detected. d Aligning all shared iPS cell/iSC-specific variants with the used seed sequence of sgRNA C4 within a 25 bp search window that must contain a NRG PAM-motif does not identify any homologies. The outlier (circles) with the highest similarity exhibits six mismatches. Boxes: interquartile ranges (25%–75%), center lines: medians, whiskers: 1.5 times the interquartile range. e TIDE analysis of sgRNA C4-mediated CAS9 cutting in CO2 fibroblasts at the COL7A1 on-target (top) and the in silico predicted off-target NOTCH1 (bottom). Measurements taken upstream (Ctrl) and downstream of cut sites. f Plots of normalized WGS coverage 1000 bp up-/downstream of COL7A1 (top) and NOTCH1 (bottom) from fibroblasts/iPS cells. Note the sharp drop of coverage at the COL7A1 locus in iPS cells due to a heterozygous 654 bp deletion (Fig. 2d–g). g Summary of all in silico predicted exonic and intronic off-targets as in (e, f). For TIDE (middle), controls were subtracted from cut sites. Heterozygous 1 bp, 10 bp, and 654 bp COL7A1-deletions were detected via WGS coverage (right; see Supplementary Data 3) in iPS cells/iSCs from homozygous patients. h Variants identified via the STAMPv2 oncopanel. Germline variants (green) are found in all 3 cell types. A heterozygous androgen receptor mutation (red) stems from clonal expansion of a fibroblast subpopulation (3%) with this lesion. Blue: variants identified by secondary methods. Source data are provided as a Source Data file.
Fig. 5
Fig. 5. Patient iPS cell-derived organotypic skin grafts survive in mice with a favorable safety profile.
a Summary of mouse graft success determined by IF staining of basement marker Collagen 7 and granular marker involucrin (IVL) at 1 month. b Representative IF image of DEB125-1 derived iSC graft at 1 month. Keratin K14, K10, Involucrin (red), Collagen 7 (COL7; green), DAPI (blue). c Quantification (%) of 8 different cell-type clusters (C1–C8) comprising the DEBCT product and identified via individual scRNA sequencing (see Fig. 3). d Strong positive correlation between % graft success rate (a) and average C5/C8 cluster expression as quantified by scRNA sequencing. e Representative flow cytometry plots analyzing cell composition of DEB125-1 iSCs labeled for ITGB4 and CD90/Thy1 before grafting onto mice. f Quantification via flow cytometry of the average expanded iSC cell composition prior to grafting (n = number of biological replicates as indicated; mean and SEM are shown). g Overview of method for detection of evading iSCs into mouse organs using human-specific Alu-qPCR. h Table summarizing Alu-qPCR-based biodistribution and histology-based tumor detection results from mice at 1, 3, 6, and 9 month post iSC grafting. i Representative Alu-qPCR from organs of DEB125-1 derived iSC grafted mice at indicated time points. LOD is level of detectability in tissues spiked with human DNA from TERT keratinocytes (n = number of biological replicates as indicated; mean and SEM are shown). j qRT-PCR detection of pluripotency marker expression (LIN28A, NANOG, OCT4 and SOX2) in the iSC product. H9 ES cells and TERT keratinocytes (KC) were used as controls (n = 3 technical replicates; mean and SEM are shown). Source data are provided as a Source Data file. Panel g created with BioRender.com released under a Creative Commons Attribution-NonCommercial-NoDerivs 4.0 International license.

Update of

References

    1. Magrin E, Miccio A, Cavazzana M. Lentiviral and genome-editing strategies for the treatment of beta-hemoglobinopathies. Blood. 2019;134:1203–1213. doi: 10.1182/blood.2019000949. - DOI - PubMed
    1. Tucci F, Galimberti S, Naldini L, Valsecchi MG, Aiuti A. A systematic review and meta-analysis of gene therapy with hematopoietic stem and progenitor cells for monogenic disorders. Nat. Commun. 2022;13:1315. doi: 10.1038/s41467-022-28762-2. - DOI - PMC - PubMed
    1. Lee, A., Xu, J., Wen, Z. & Jin, P. Across dimensions: developing 2D and 3D human iPSC-based models of fragile X syndrome. Cells 11, 1725 (2022). - PMC - PubMed
    1. Thomas D, Choi S, Alamana C, Parker KK, Wu JC. Cellular and engineered organoids for cardiovascular models. Circ. Res. 2022;130:1780–1802. doi: 10.1161/CIRCRESAHA.122.320305. - DOI - PMC - PubMed
    1. Trush O, Takasato M. Kidney organoid research: current status and applications. Curr. Opin. Genet. Dev. 2022;75:101944. doi: 10.1016/j.gde.2022.101944. - DOI - PubMed

MeSH terms

LinkOut - more resources