

Air pollution disproportionately impairs beneficial invertebrates: a meta-analysis
- PMID: 38992007
- PMCID: PMC11239652
- DOI: 10.1038/s41467-024-49729-5
Air pollution disproportionately impairs beneficial invertebrates: a meta-analysis
Abstract
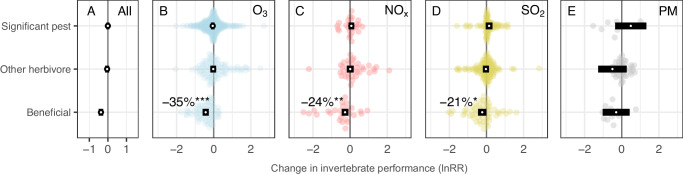
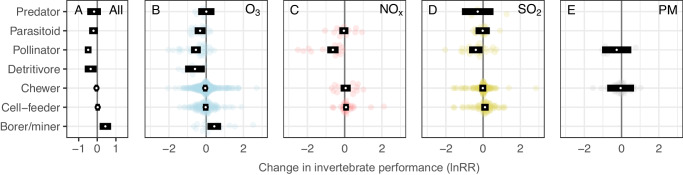
Air pollution has the potential to disrupt ecologically- and economically-beneficial services provided by invertebrates, including pollination and natural pest regulation. To effectively predict and mitigate this disruption requires an understanding of how the impacts of air pollution vary between invertebrate groups. Here we conduct a global meta-analysis of 120 publications comparing the performance of different invertebrate functional groups in unpolluted and polluted atmospheres. We focus on the pollutants ozone, nitrogen oxides, sulfur dioxide and particulate matter. We show that beneficial invertebrate performance is reduced by air pollution, whereas the performance of plant pest invertebrates is not significantly affected. Ozone pollution has the most detrimental impacts, and these occur at concentrations below national and international air quality standards. Changes in invertebrate performance are not dependent on air pollutant concentrations, indicating that even low levels of pollution are damaging. Predicted increases in tropospheric ozone could result in unintended consequences to global invertebrate populations and their valuable ecological services.
© 2024. The Author(s).
Conflict of interest statement
The authors declare no competing interests.
Figures


Similar articles
-
Part 5. Public health and air pollution in Asia (PAPA): a combined analysis of four studies of air pollution and mortality.Res Rep Health Eff Inst. 2010 Nov;(154):377-418. Res Rep Health Eff Inst. 2010. PMID: 21446215
-
[Clinical repercussions of exposure to atmospheric pollution].J Bras Pneumol. 2006;32 Suppl 2:S5-11. doi: 10.1590/s1806-37132006000800003. J Bras Pneumol. 2006. PMID: 17273599 Review. Portuguese.
-
Upper gastrointestinal bleeding due to peptic ulcer disease is not associated with air pollution: a case-crossover study.BMC Gastroenterol. 2015 Oct 14;15:131. doi: 10.1186/s12876-015-0363-6. BMC Gastroenterol. 2015. PMID: 26467538 Free PMC article.
-
Part 1. A time-series study of ambient air pollution and daily mortality in Shanghai, China.Res Rep Health Eff Inst. 2010 Nov;(154):17-78. Res Rep Health Eff Inst. 2010. PMID: 21446211
-
Association between short-term exposure to ambient air pollution and heart failure: An updated systematic review and meta-analysis of more than 7 million participants.Front Public Health. 2023 Jan 23;10:948765. doi: 10.3389/fpubh.2022.948765. eCollection 2022. Front Public Health. 2023. PMID: 36755739 Free PMC article.
References
-
- Scudder, G. G. E. The importance of insects. In Insect Biodiversity: Science and Society (eds Foottit, R. G. & Adler, P. H.) (John Wiley & Sons, 2017).
-
- IPBES. in Summary for Policymakers of the Global Assessment Report on Biodiversity and Ecosystem Services of the Intergovernmental Science–Policy Platform on Biodiversity and Ecosystem Services (ed Díaz, S. et al.) (IPBES Secretariat, 2019).
-
- Whittaker JB. Insects and plants in a changing atmosphere. J. Ecol. 2001;89:507–518. doi: 10.1046/j.0022-0477.2001.00582.x. - DOI
-
- Gao H-J, Chang X-N, Chen F-J, Zhai B-P. Impacts of roadway traffic pollutions on insects. Acta Entomol. Sin. 2008;51:81.
Publication types
MeSH terms
Substances
Grants and funding
LinkOut - more resources
Full Text Sources
Medical
