. 2024 Jul 11;15(1):5847.
doi: 10.1038/s41467-024-50052-2.

SARS-CoV-2 serosurvey across multiple waves of the COVID-19 pandemic in New York City between 2020-2023

Collaborators, Affiliations

SARS-CoV-2 serosurvey across multiple waves of the COVID-19 pandemic in New York City between 2020-2023

Juan Manuel Carreño et al. Nat Commun. .

Abstract

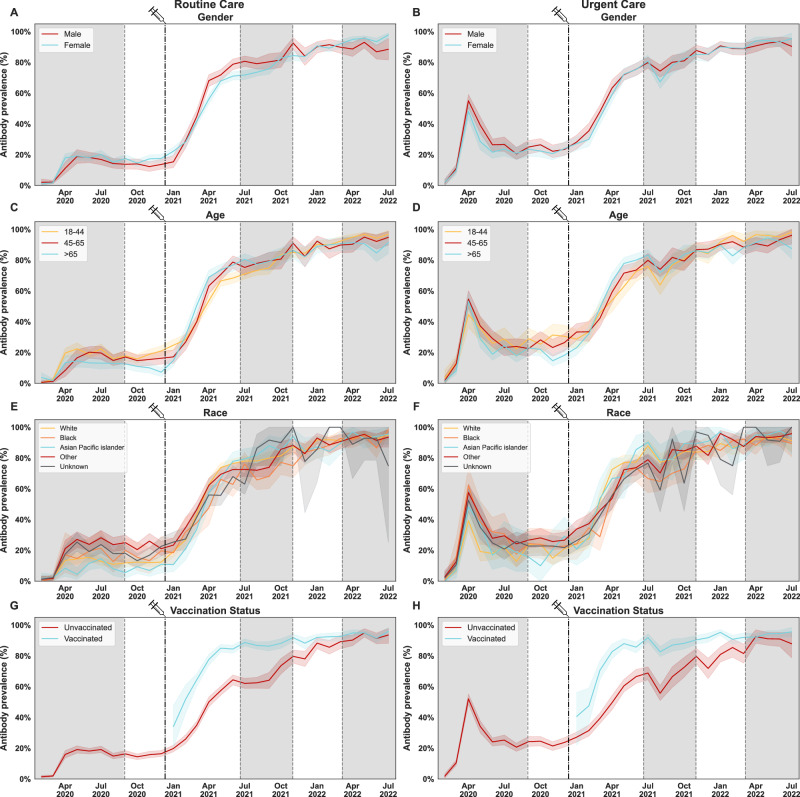
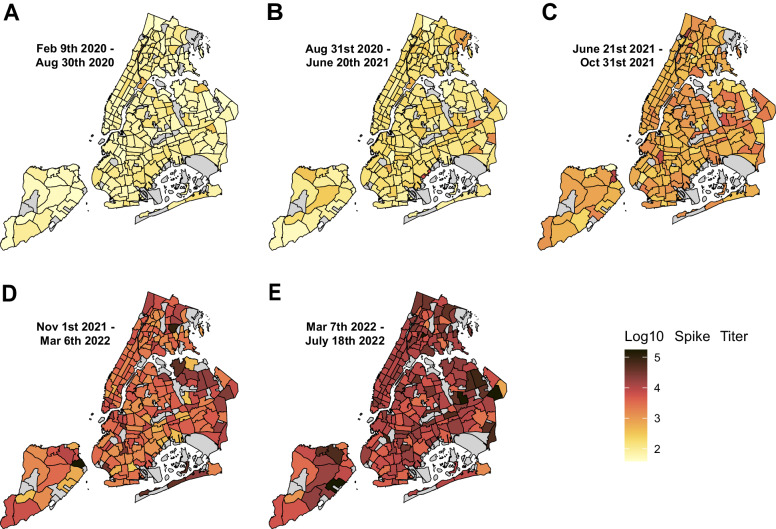
Sero-monitoring provides context to the epidemiology of severe acute respiratory syndrome coronavirus 2 (SARS-CoV-2) infections and changes in population immunity following vaccine introduction. Here, we describe results of a cross-sectional hospital-based study of anti-spike seroprevalence in New York City (NYC) from February 2020 to July 2022, and a follow-up period from August 2023 to October 2023. Samples from 55,092 individuals, spanning five epidemiological waves were analyzed. Prevalence ratios (PR) were obtained using Poisson regression. Anti-spike antibody levels increased gradually over the first two waves, with a sharp increase during the 3rd wave coinciding with SARS-CoV-2 vaccination in NYC resulting in seroprevalence levels >90% by July 2022. Our data provide insights into the dynamic changes in immunity occurring in a large and diverse metropolitan community faced with a new viral pathogen and reflects the patterns of antibody responses as the pandemic transitions into an endemic stage.


Conflict of interest statement

The Icahn School of Medicine at Mount Sinai has filed patent applications relating to SARS-CoV-2 serological assays and NDV-based SARS-CoV-2 vaccines which list Florian Krammer as co-inventor. Dr. Simon is listed on the SARS-CoV-2 serological assays patent. Mount Sinai has spun out a company, Kantaro, to market serological tests for SARS-CoV-2. Dr. Krammer has consulted for Merck, Seqirus, CureVac, GSK and Pfizer in the past and is currently consulting for Gritstone Bio, 3rd Rock Ventures, and Avimex, and he is a co-founder and scientific advisory board member of CastleVax. The Krammer laboratory has been collaborating with Pfizer on animal models for SARS-CoV-2. The remaining authors declare no competing interests.

Figures

Fig. 1
Fig. 1. SARS-CoV-2 spike binding antibody prevalence and titers in the Routine care and Urgent care groups at Mount Sinai Hospital in New York City (NYC).
7-day rolling average case counts of SARS-CoV-2 infections in New York City reported by the NYC Department of Health and Mental Hygiene (NYC DOHMH) (A). Main circulating SARS-CoV-2 lineages presented as percent prevalence based on data from the Pathogen Surveillance Program at Mount Sinai (B). Mean antibody prevalence with 95% bootstrapped confidence intervals between February 9th 2020 to July 18th 2022 (C, D) and geometric mean antibody titers with bootstrapped 95% confidence intervals (E, F) are shown for the Routine Care (left column, blue lines) and Urgent Care (right column, orange lines) groups (February 9th 2020 to July 18th 2022 and August 21st 2023 to October 2nd 2023). Samples were run in duplicate in a 2-step ELISA protocol. All bootstrapped confidence intervals are based on random resampling of results using the above mentioned mean for each graph. B lineages before the emergence of variants of concern (VOCs) are shown in greyscale, while VOCs are shown in color. NYC DOHMH mean antibody prevalence data are shown in C, D for reference, denoted with a dashed line. The date on which the first FDA-authorized SARS-CoV-2 vaccine became available in NYC is indicated by the vertical dotted line and syringe. Alternating shaded areas in A, CF denote the five successive epidemiological waves of infection in NYC. Gray color and vertical dashed lines serve as visual contrast.
Fig. 2
Fig. 2. SARS-CoV-2 spike antibody prevalence stratified by demographic groups and vaccination status.
Mean antibody prevalence in the Routine Care (left column), and Urgent Care (right column) groups, measured between February 9th 2020 to July 18th 2022, and stratified by gender (A, B), age (C, D), race (E, F), and vaccination status at the time of sample collection (G, H) is shown. Gray color serves as visual contrast. Vertical dashed lines separate waves of SARS-CoV-2 infection in NYC. Samples were run in duplicate in a 2-step ELISA protocol. The mean of each graph is paired with a bootstrapped 95% confidence interval based on random resampling of results. A, B Gender stratification: males, females. C, D Categorical age levels: 18–44, 45–65, >65. Individuals <17 are not shown in this analysis. E, F Race/ethnicity stratification: White, Black, Asian, and Pacific Islander, Other, unknown. G, H The date on which the first FDA-authorized SARS-CoV-2 vaccine became available in NYC is indicated by the vertical doted line and syringe. Vaccination status was assessed at the time of sample collection and does not reflect vaccination rates in NYC or within our patient population. Alternating shaded areas in all graphs denote the five successive epidemiological waves of infection in NYC. Gray color and vertical dashed lines serve as visual contrast.
Fig. 3
Fig. 3. SARS-CoV-2 nucleoprotein (NP) and spike (S) antibody prevalence and titers over six sampling periods (2-week duration) through the course of the pandemic.
NP and S antibody prevalence (A) and titers (B) in patients attending Mount Sinai Hospital in New York City are shown. Data stratified by vaccination status, assessed at the time of sample collection. Sampling time points: July 6–20th, 2020 (n = 661); February 15th to March 1st, 2021(n = 497); June 1st to June 14th, 2021(n = 610); August 16th to August 30th, 2021(n = 758); May 23rd to May 30th, 2022 (n = 592); Aug 21st to Oct 2nd, 2023 (n = 595). Antibody prevalence (%) with 95% confidence intervals is shown in A. Geometric mean of endpoint titers plus 95% confidence intervals are shown in B. Samples were run in duplicate under our 2-step ELISA protocol. Limit of detection (LoD) is indicated by the horizontal dotted line. Statistically significant differences between NP and S values are indicated as follows: ns, not significant; * <0.05, ** <0.01, *** <0.001. All exact values shown within the figure are provided in Supplemental Table 14. A 2-tailed Chi-squared test for antibody prevalence was conducted between spike and NP positivity within the vaccinated and unvaccinated subgroup, and a 2-tailed T-test for the same targets (spike vs. NP within vaccinated and unvaccinated subgroups) was conducted for endpoint titer. All exact p values are shown in Supplemental Table 15.
Fig. 4
Fig. 4. Geographical distribution of SARS-CoV-2 spike antibody titers during five epidemiological waves of COVID-19 in residents of New York City (NYC).
SARS-CoV-2 spike IgG titer measured in patients from the five boroughs of NYC (Manhattan, Brooklyn, Queens, The Bronx, and Staten Island) attending to a Mount Sinai Hospital in NYC are shown (latitude and longitude: 40.7128° N, 74.0060° W). Five epidemiological waves corresponding to successive peaks of COVID-19 incidence are shown. A Wave 1 (February 9th to August 30th, 2020). B Wave 2 (August 31st, 2020, to June 20th, 2021). C Wave 3 (June 21st to October 31st, 2021). D Wave 4 (November 1st, 2021, to March 6th, 2022). E Wave 5 (March 7th to July 18th, 2022). Antibody titer is expressed as log10 geometric mean titer. Areas with l<10 specimens are shaded gray. Color gradient depicts range of antibody titers.

Similar articles

Cited by

References

    1. Thompson CN, et al. COVID-19 outbreak - New York City, February 29-June 1, 2020. MMWR Morb. Mortal. Wkly Rep. 2020;69:1725–1729. doi: 10.15585/mmwr.mm6946a2. - DOI - PMC - PubMed
    1. Dalva-Baird NP, Alobuia WM, Bendavid E, Bhattacharya J. Racial and ethnic inequities in the early distribution of U.S. COVID-19 testing sites and mortality. Eur. J. Clin. Invest. 2021;51:e13669. doi: 10.1111/eci.13669. - DOI - PMC - PubMed
    1. Carabelli AM, et al. SARS-CoV-2 variant biology: immune escape, transmission and fitness. Nat. Rev. Microbiol. 2023;21:162–177. - PMC - PubMed
    1. Hou YJ, et al. SARS-CoV-2 D614G variant exhibits efficient replication ex vivo and transmission in vivo. Science. 2020;370:1464–1468. doi: 10.1126/science.abe8499. - DOI - PMC - PubMed
    1. Korber B, et al. Tracking changes in SARS-CoV-2 spike: evidence that D614G increases infectivity of the COVID-19 virus. Cell. 2020;182:812–827.e819. doi: 10.1016/j.cell.2020.06.043. - DOI - PMC - PubMed

MeSH terms