. 2024 Jul 11;15(1):5840.
doi: 10.1038/s41467-024-49934-2.

Turn-on protein switches for controlling actin binding in cells

Affiliations

Turn-on protein switches for controlling actin binding in cells

Unyime M Effiong et al. Nat Commun. .

Abstract

Within a shared cytoplasm, filamentous actin (F-actin) plays numerous and critical roles across the cell body. Cells rely on actin-binding proteins (ABPs) to organize F-actin and to integrate its polymeric characteristics into diverse cellular processes. Yet, the multitude of ABPs that engage with and shape F-actin make studying a single ABP's influence on cellular activities a significant challenge. Moreover, without a means of manipulating actin-binding subcellularly, harnessing the F-actin cytoskeleton for synthetic biology purposes remains elusive. Here, we describe a suite of designed proteins, Controllable Actin-binding Switch Tools (CASTs), whose actin-binding behavior can be controlled with external stimuli. CASTs were developed that respond to different external inputs, providing options for turn-on kinetics and enabling orthogonality and multiplexing. Being genetically encoded, we show that CASTs can be inserted into native protein sequences to control F-actin association locally and engineered into structures to control cell and tissue shape and behavior.


Conflict of interest statement

The authors declare no competing interests.

Figures

Fig. 1
Fig. 1. Engineering controllable actin-binding switch tools (CASTs) from actin-binding motifs.
Peptide actin-binding motifs (ABMs) adopt conformations capable of recognizing and binding filamentous actin (F-actin) (top panel), where the bound complexes are energetically favored. To control ABM binding to F-actin, intramolecular binders can be engineered into ABMs’ termini (bottom panels), giving rise to Controllable Actin-binding Switch Tools (CASTs). The intramolecular association leads to energetically favorable unbound forms in the presence of F-actin. ABMs can be either (i) conformationally constrained (bottom left) or (ii) sterically occluded (bottom right) to disrupt native F-actin binding. The introduction of a stimulus (red star) that relieves the constraint or steric hindrance would then favor the bound F-actin form of the CAST, turning ‘on’ binding to F-actin in a user-defined manner.
Fig. 2
Fig. 2. Design of a peptide-responsive CAST.
a Schematic of a peptide-based CAST system. The ABM is initially constrained (gray) in an “off” state by two SynZip sequences, SZ3 and SZ4, which form a coiled-coil interaction intramolecularly. After the introduction of a peptide stimulus (SZ21), which outcompetes SZ3 for SZ4 binding, a transition to the active “on” state (blue) capable of F-actin binding occurs. b AlphaFold2 model prediction of SZ3:SZ4 complex with a C-to-N-terminal distance of 7.4 nm. c Structural considerations for the initial “off” state of CASTs. The C-to-N-terminal distance of the SZ3:SZ4 complex must be spanned by the interdomain residues. Flexible linkers can be installed on either end of the ABM to increase interdomain length. Short linker lengths impede SZ3:SZ4 binding, allowing the ABM to remain active (left). Long-linker lengths, on the other hand, lead to SZ3:SZ4 binding but no constraint on ABM (right). Only the optimal linker length will allow for both SZ3:SZ4 interaction and a conformational constraint on the ABM (middle), resulting in the “off” state. d Probability distributions of end-to-end terminal distances for ABS and Lifeact pep0-pep9 (see bottom) with varying interdomain residue lengths from a worm-like chain (WLC) model (top). The primary sequence of peptide-based CAST candidates for control of F-actin binding (bottom). Source data are provided as a Source Data file.
Fig. 3
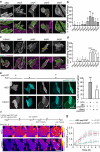
Fig. 3. Characterization of pepCAST candidates in cells.
a Fluorescent micrographs of fixed HeLa cells expressing ABS pep0-pep9 in the absence of SZ21. Total cellular actin was visualized by Phalloidin staining (magenta). ABS pepCAST (pep6) was selected for further study since its localization to F-actin was significantly reduced (yellow arrows). Scale bar, 30 µm. b Quantification of F-actin binding inhibition for ABS pep0-pep9, where 0% is defined by ABS-only localization and 100% is defined by GFP-only localization. Bars represent mean ± SD. n = 40 biological replicates. c Fluorescent micrographs of fixed HeLa cells expressing Lifeact pep0-pep9 in the absence of SZ21. Total cellular actin was visualized by Phalloidin staining (magenta). Lifeact pepCAST (pep6) was selected for further study since its localization to F-actin was significantly reduced (yellow arrows). Scale bar, 30 µm. d Quantification of F-actin binding inhibition for Lifeact pep0-pep9, where 0% is defined by Lifeact-only localization and 100% is defined by GFP-only localization. Bars represent mean ± SD. n = 40 biological replicates. e Fluorescent micrographs of pepCASTs, SZ21, and the combination of pepCASTs and SZ21 in live HeLa cells (left). After SZ21 expression, pepCAST localizes to F-actin filaments. Quantification of binding activation (right), where 0% is defined by inactive pepCAST localization and 100% is defined by ABM-only localization. Scale bar, 30 µm. Bars represent mean ± SD. n = 20 biological replicates. f Time-lapse imaging of pepCASTs shows increased localization of pepCASTs to F-actin over time (white arrows). SZ21 expression was induced with 1 µM ATc to stable pepCAST-expressing HeLa cells transfected with SZ21 in an ATc-inducible plasmid. Scale bar, 30 µm. g Kinetics of pepCASTs’ activation. The ratio of pepCAST’s F-actin-localized fluorescence intensity to its cytoplasmic fluorescence intensity normalized to GFP-only localization is plotted at several timepoints, up to 7 h. t1/2 = binding half-time. n = 3 biological replicates. Data were fit to a one-phase exponential association model (broken lines). P values were determined using a two-tailed unpaired t-test comparison with ABM-only control (b, d) or inactive pepCAST (e). (ns not significant P > 0.05; *P < 0.05; **P < 0.01; ****P < 0.0001). Source data are provided as a Source Data file.
Fig. 4
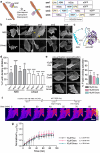
Fig. 4. Characterization of small molecule-based CAST candidates in cells.
a Schematic of a small molecule-based CAST system. The ABM is initially constrained (gray) by the intramolecular association of NS3a and CP5. After the addition of small molecule inhibitors (Asunaprevir, Danoprevir, or Grazoprevir) that disrupt the NS3a:CP5 complex, the CAST transitions to an active state (blue) capable of F-actin binding (left). The primary sequence of small molecule-based CAST candidates tested (right). b Fluorescent micrographs of fixed HeLa cells expressing sm1-sm4 in the absence of small molecule inhibitors. smCAST (sm2) was selected for further study since its localization to F-actin was significantly reduced (yellow arrows). Scale bar 30 µm. c AlphaFold2 prediction of native ABS (blue, left) and smCAST (right). ABS alone is predicted to be an α-helix, the active form of the ABM, whereas within smCAST the ABS sequence is unstructured (right). d Quantification of F-actin binding inhibition for ABS and Lifeact sm1-sm4, where 0% is defined by ABS-only localization and 100% is defined by GFP-only localization. Bars represent mean ± SD. n = 40 biological replicates. e Fluorescent micrographs of smCAST in the presence or absence of Asu, Dano, or Grazo in live HeLa cells (left). Quantification of activation in the presence of drug for 30 min (right), where 0% is defined by inactive smCAST localization and 100% is defined by ABS-only localization. Scale bar 20 µm. Bars represent mean ± SD. n = 30 biological replicates. f Time-lapse imaging of the smCAST after the addition of Grazo shows increased localization of smCAST to F-actin (white arrows) over time. Scale bar 10 µm. g Kinetics of smCAST activation. The ratio of smCAST’s F-actin-localized fluorescence intensity to its cytoplasmic fluorescence intensity normalized to GFP-only localization is plotted at several timepoints, up to 90 min. t1/2 = binding half-time. n = 3 biological replicates. Data were fit to a one-phase exponential association model (broken lines). P values were determined using a two-tailed unpaired t-test comparison with ABS-only control (d) or inactive smCAST (e). (ns not significant P > 0.05; *P < 0.05; **P < 0.01; ****P < 0.0001). Source data are provided as a Source Data file.
Fig. 5
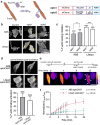
Fig. 5. Characterization of optoCAST candidates in cells.
a Schematic of a light-based CAST system. The ABM is initially occluded (gray) by the AsLOV2 domain until blue light illumination leads to the active state (blue) capable of F-actin binding (left). The primary sequence of light-based CAST candidates tested (right). b Fluorescent micrographs of fixed HeLa cells expressing opto1-opto2 in the absence of blue light. ABS and Lifeact optoCASTs (opto1) were selected for further study since their localization to F-actin was significantly reduced (yellow arrows). Scale bar 30 µm. c Quantification of F-actin binding inhibition for ABS and Lifeact opto1-opto2, where 0% is defined by ABM-only localization and 100% is defined by mCherry-only localization. Bars represent mean ± SD. n = 20 biological replicates. d Fluorescent micrographs of optoCASTs before and after blue light illumination in live HeLa cells (top). Quantification of activation (bottom), where 0% is defined by inactive optoCAST localization and 100% is defined by ABM-only localization. Scale bar 20 µm. Bars represent mean ± SD. n = 20 biological replicates. e Time-lapse imaging of Lifeact optoCAST under blue light illumination shows increased localization of optoCAST to F-actin (white arrows) over time. Scale bar 20 µm. f Kinetics of ABS and Lifeact optoCAST activation. The ratio of optoCAST’s F-actin-localized fluorescence intensity to its cytoplasmic fluorescence intensity normalized to mCherry-only localization is plotted at several timepoints, up to 20 min. t1/2 = binding half-time. n = 3 biological replicates. Data were fit to a one-phase exponential association model (broken lines). P values were determined using a two-tailed unpaired t-test comparison with ABM-only control (c) or inactive optoCAST (d). (ns not significant P > 0.05; *P < 0.05; **P < 0.01; ****P < 0.0001). Source data are provided as a Source Data file.
Fig. 6
Fig. 6. Engineering a controllable actin crosslinker with optoCASTs in cells and tissue.
a Schematic of the design and activation of a dimeric optoCAST. A self-associating peptide (pink) is tethered to either ABS optoCAST (dOptoABS) or Lifeact optoCAST (dOptoLifeact) to form dimeric versions of optoCAST. Photoactivation of the dimeric species would then expose the two occluded ABMs, leading to actin crosslinking and bundling in cells (top). Primary sequences of dOptoABS and dOptoLifeact (bottom). b Fluorescent micrographs of HEK 293 T cells expressing either dOptoABS or dOptoLifeact before and after blue light illumination (left). Clusters of bundled filaments are present post-activation (yellow arrowhead). Quantification of cell area changes following activation (right). Scale bar 20 µm. n = 12 biological replicates. c Fluorescent micrographs of MDCK II cell islands expressing either dOptoABS or dOptoLifeact before and after blue light illumination (left). Cells contract within the island and detach from one another (red arrows). Quantification shows an increase in cell detachment post-activation (right). Scale bar 15 µm. Bars represent mean ± SD. n = 25 cell-cell contacts. P values were determined using a two-tailed unpaired t-test comparison with GFP-only control (b) or mCherry-only control (c). (ns not significant P > 0.05; *P < 0.05; **P < 0.01; ****P < 0.0001). Source data are provided as a Source Data file.
Fig. 7
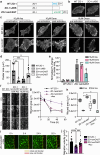
Fig. 7. Controlling ZO-1-F-actin binding with CASTs modulates cell adhesion and collective migration.
a Primary sequence of full-length WT ZO-1, ZO-1 with its ABS deleted (ZO-1ΔABS), and ZO-1 with its ABS replaced with smCAST (ZO-1smCAST). b Fluorescent micrographs of WT ZO-1 and ZO-1ΔABS expressed in live HeLa cells. ZO-1 localizes to focal complexes and large clusters of focal adhesions under the cell body, while ZO-1ΔABS localizes primarily to peripheral focal complexes. Scale bar 20 µm. c Fluorescent micrographs of WT ZO-1 and ZO−1smCAST before and after Asu, Dano, or Grazo addition in live HeLa cells. After activation, only ZO−1smCAST re-localizes to large focal adhesion clusters (lower panel). Scale bar 20 µm. d Quantification of ZO-1 cluster size in HeLa cells expressing ZO-1 variants. Bars represent the mean ± SD of clusters. n = 3 biological replicates. e Change in cluster size of ZO-1 variants before and after drug treatment. Bars represent mean ± SD. n = 3 biological replicates. f Fluorescent micrographs of collective cell migration in a wounded MDCK II monolayer over time. Stable cells lacking ZO proteins and expressing either WT ZO-1 or ZO-1smCAST were imaged with and without Asu. Scale bar 100 µm. g Quantification of wound area over time for cells expressing WT ZO-1 or ZO-1smCAST and cultured in the absence or presence of Asu. Data were presented as mean ± SD. n = 3 biological replicates. h Quantification of wound area after 52 h. The box represents 25th to 75th percentiles with the middle line as the median and whiskers as the maximum and minimum values. n = 4 biological replicates. i Time-lapse imaging of wound healing for ZO-1smCAST-expressing MDCK II cells treated with Asu. A leading edge of cells (red line) migrates from an initial wound boundary (yellow line) during wound healing. Scale bar 100 µm. j Quantification of the migration rate of cells expressing ZO-1 variants. Bars represent mean ± SD. n = 15 biological replicates. P values were determined using a two-tailed unpaired t-test. Comparison is to WT ZO-1-expressing cells treated with the same drugs (e). (ns not significant P > 0.05; *P < 0.05; **P < 0.01; ****P< 0.0001). Source data are provided as a Source Data file.

Update of

Similar articles

Cited by

  • Structure of the F-tractin-F-actin complex.
    Shatskiy D, Sivan A, Wedlich-Söldner R, Belyy A. Shatskiy D, et al. J Cell Biol. 2025 Apr 7;224(4):e202409192. doi: 10.1083/jcb.202409192. Epub 2025 Feb 10. J Cell Biol. 2025. PMID: 39928047 Free PMC article.
  • Binding memory of liquid molecules.
    Qin S, Yang Z, Liu H, Wang X, Miao B, Hou S, Huang K. Qin S, et al. Nat Commun. 2025 Jul 16;16(1):6555. doi: 10.1038/s41467-025-61630-3. Nat Commun. 2025. PMID: 40670366 Free PMC article.

References

    1. Gardel ML, Schneider IC, Aratyn-Schaus Y, Waterman CM. Mechanical integration of actin and adhesion dynamics in cell migration. Annu. Rev. Cell Dev. Biol. 2010;26:315–333. doi: 10.1146/annurev.cellbio.011209.122036. - DOI - PMC - PubMed
    1. Bisaria A, Hayer A, Garbett D, Cohen D, Meyer T. Membrane-proximal F-actin restricts local membrane protrusions and directs cell migration. Science. 2020;368:1205–1210. doi: 10.1126/science.aay7794. - DOI - PMC - PubMed
    1. Mehidi A, et al. Forces generated by lamellipodial actin filament elongation regulate the WAVE complex during cell migration. Nat. Chem. Biol. 2021;23:1148–1162. - PubMed
    1. Vasioukhin V, Bauer C, Yin M, Fuchs E. Directed actin polymerization is the driving force for epithelial cell–cell adhesion. Cell. 2000;100:209–219. doi: 10.1016/S0092-8674(00)81559-7. - DOI - PubMed
    1. Efimova N, Svitkina TM. Branched actin networks push against each other at adherens junctions to maintain cell–cell adhesion. J. Cell Biol. 2018;217:1827–1845. doi: 10.1083/jcb.201708103. - DOI - PMC - PubMed

LinkOut - more resources