. 2024 Jul 11;15(1):5585.
doi: 10.1038/s41467-024-49871-0.

The transcriptional co-repressor Runx1t1 is essential for MYCN-driven neuroblastoma tumorigenesis

Affiliations

The transcriptional co-repressor Runx1t1 is essential for MYCN-driven neuroblastoma tumorigenesis

Jayne E Murray et al. Nat Commun. .

Abstract

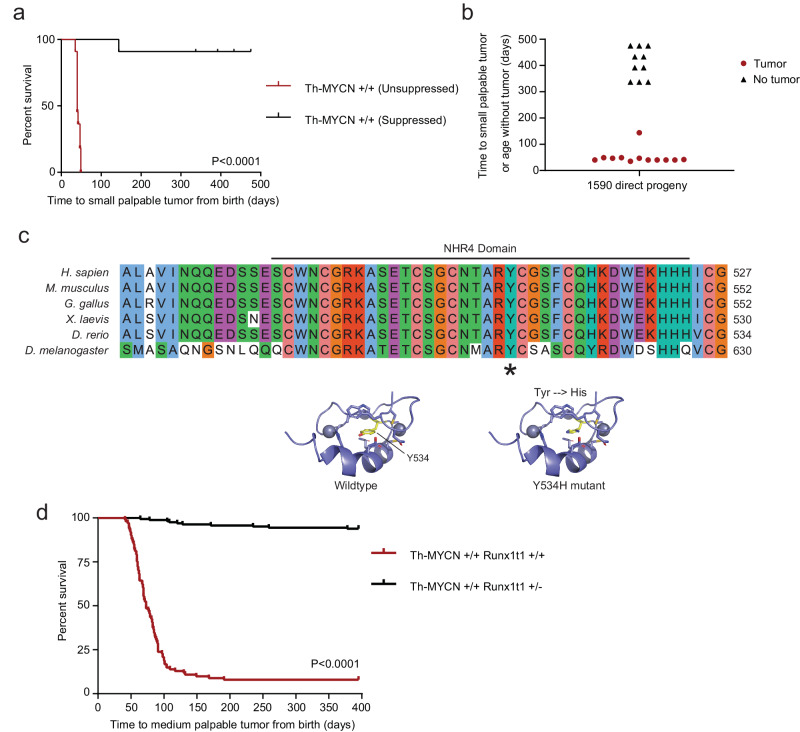
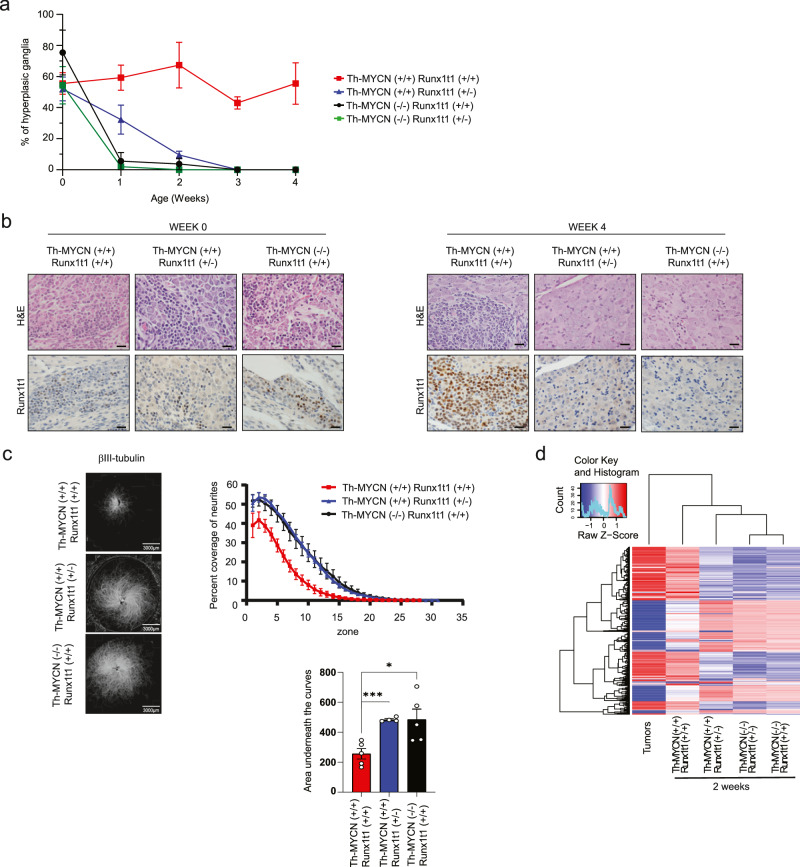
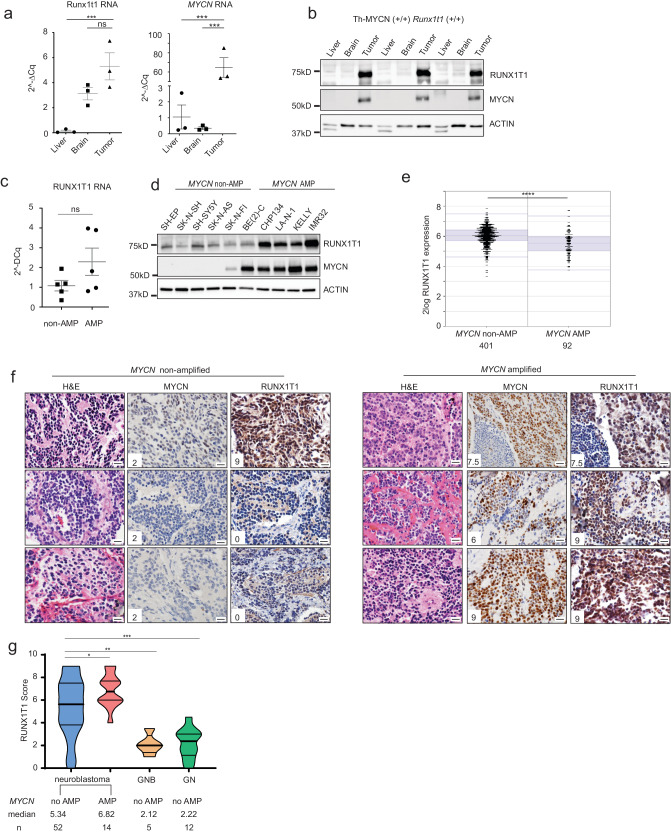
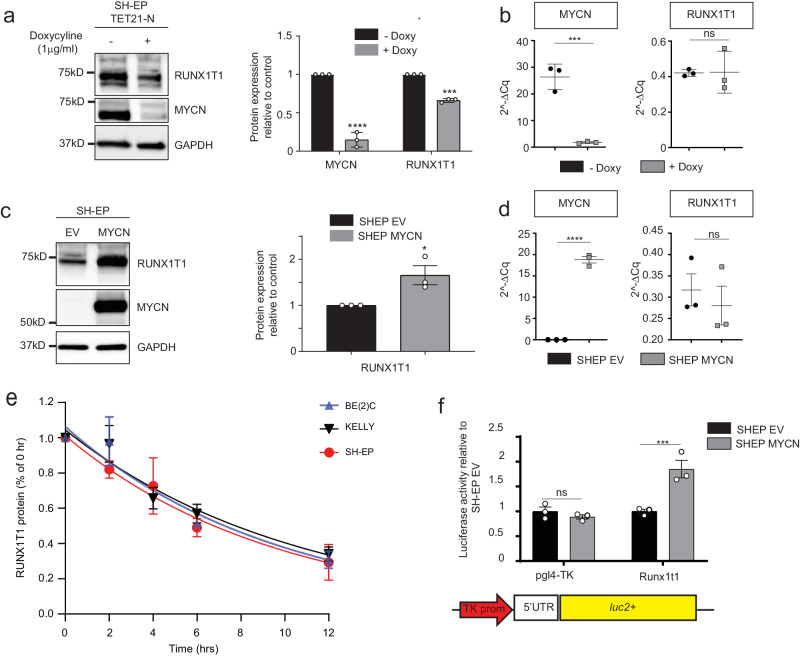
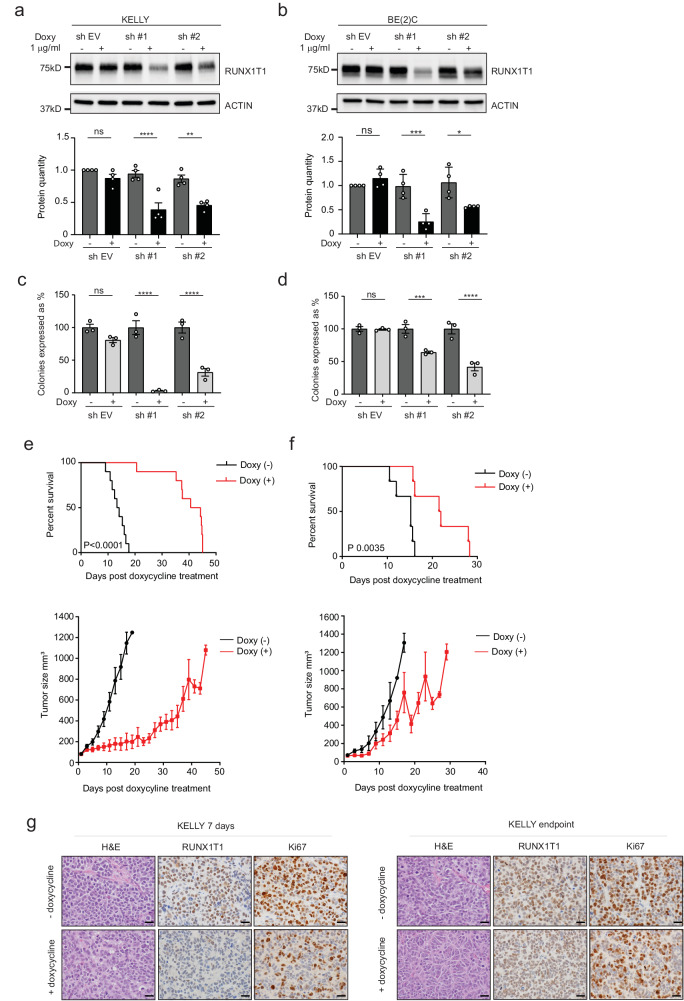
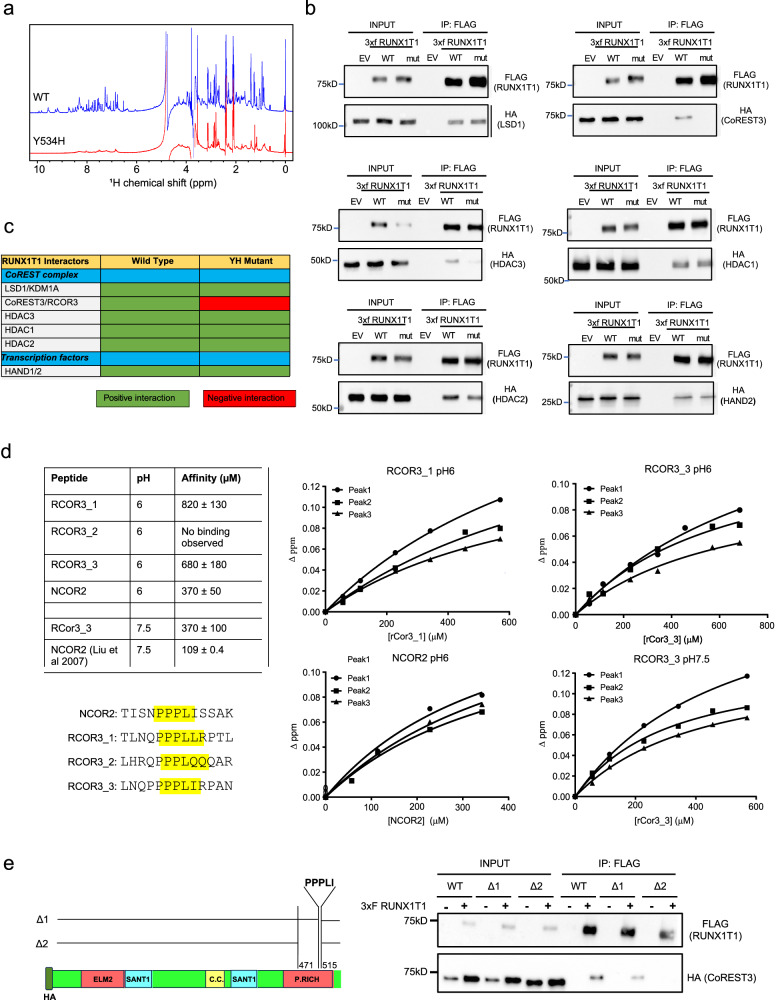
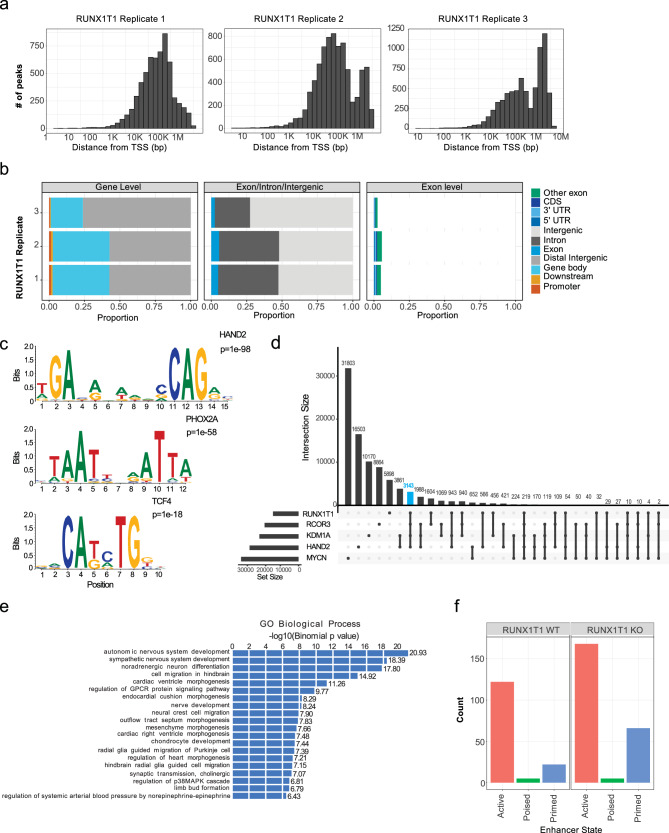
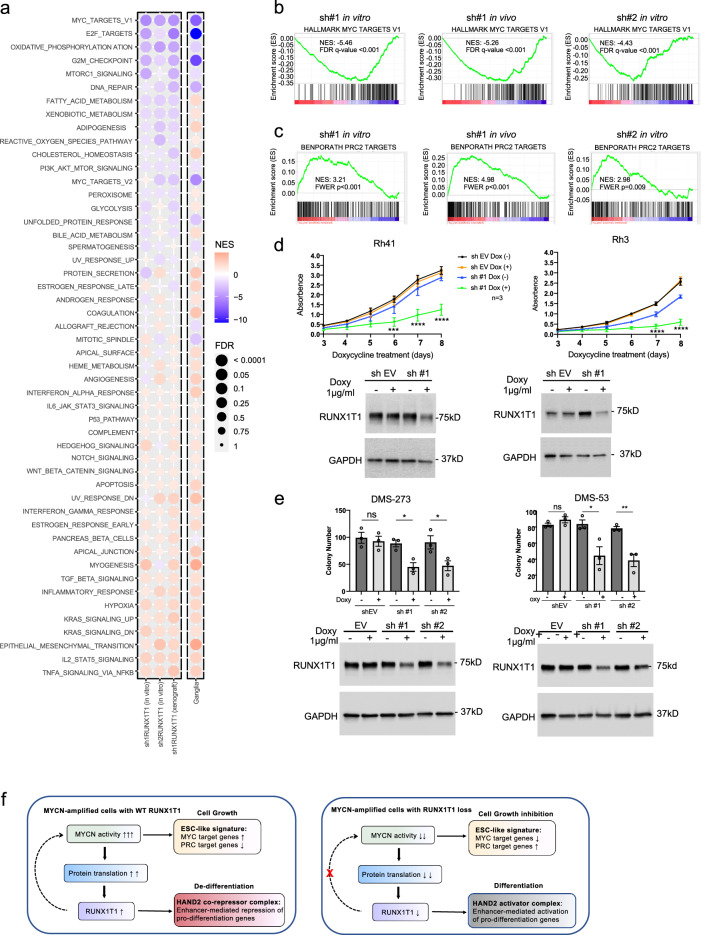
MYCN oncogene amplification is frequently observed in aggressive childhood neuroblastoma. Using an unbiased large-scale mutagenesis screen in neuroblastoma-prone transgenic mice, we identify a single germline point mutation in the transcriptional corepressor Runx1t1, which abolishes MYCN-driven tumorigenesis. This loss-of-function mutation disrupts a highly conserved zinc finger domain within Runx1t1. Deletion of one Runx1t1 allele in an independent Runx1t1 knockout mouse model is also sufficient to prevent MYCN-driven neuroblastoma development, and reverse ganglia hyperplasia, a known pre-requisite for tumorigenesis. Silencing RUNX1T1 in human neuroblastoma cells decreases colony formation in vitro, and inhibits tumor growth in vivo. Moreover, RUNX1T1 knockdown inhibits the viability of PAX3-FOXO1 fusion-driven rhabdomyosarcoma and MYC-driven small cell lung cancer cells. Despite the role of Runx1t1 in MYCN-driven tumorigenesis neither gene directly regulates the other. We show RUNX1T1 forms part of a transcriptional LSD1-CoREST3-HDAC repressive complex recruited by HAND2 to enhancer regions to regulate chromatin accessibility and cell-fate pathway genes.


Conflict of interest statement

The authors declare no competing interests.

Figures

Fig. 1
Fig. 1. Single point mutation in NHR4 domain of Runx1t1 that abrogates neuroblastoma development.
a Kaplan–Meier survival analysis of progeny of the ENU-treated Th-MYCN mouse #1590, that were either wild-type for Runx1t1 (red, unsuppressed) or had inherited the Y534H Runx1t1 mutation (black, suppressed); n = 11 per genotype, p < 0.0001 (log-rank (Mantel–Cox) test). b Scatter plot showing time to tumor development in progeny of the ENU-treated mouse #1590 that were wild-type for Runx1t1 (red), or had inherited the Y534H mutation (black), n = 11 per genotype. c Multiple protein sequence alignment of the RUNX1T1 NHR4 domain across a range of organisms. The suppressed tumor phenotype resulted from the substitution of histidine (H) for a highly conserved tyrosine residue (Y), denoted by the asterisk (upper panel). A schematic model of wild-type and mutant Runx1t1 NHR4 zinc-finger motif domain folding (bottom panel). d Kaplan–Meier survival analysis for homozygous Th-MYCN mice either wild type (Th-MYCN +/+ Runx1t1 +/+) or with heterozygous knock-out (Th-MYCN +/+ Runx1t1 +/−) of Runx1t1. Wild-type Runx1t1 mice (red) demonstrated almost complete tumor penetrance, while Runx1t1 heterozygous knock-out mice (black) almost entirely lacked the ability to form tumors (n = 101 for wild-type and n = 163 for heterozygous knock-out, log-rank (Mantel–Cox) test p < 0.0001). Source data are provided as a Source Data file.
Fig. 2
Fig. 2. Runx1t1 loss reverses MYCN-mediated sustained hyperplasia and induces ganglia neurite extension.
a The percentage neuroblast hyperplasia scored from homozygous Th-MYCN (+/+) mice or littermate mice lacking the MYCN transgene (−/−), with either wild-type (+/+) or heterozygous loss (+/−) of Runx1t1. Scoring of N = 3–8 independent mice was performed for each genotype and timepoint. All data points were N = 3, except for +/+, +/+ week 1 and week 2 (N = 4); +/+, +/− day 0 (N = 8) and week 4 (N = 4); −/−, +/− day 0 (N = 6), week 1 (N = 4) and week 4 (N = 5). The graph is mean ± SEM. b Representative histology of RUNX1T1 staining in ganglia from mice homozygous for the Th-MYCN transgene, and either wild-type or heterozygous for Runx1t1 from day 0 and 4 weeks of age. Neuroblast hyperplasia is defined as ≥30 small round blue cells within a sympathetic ganglion. Photos were taken at 600X magnification, and the scale bars represent 20 microns. c βIII-tubulin staining of sympathetic ganglia isolated from Th-MYCN mice. The percent coverage of neurites was calculated and the area under the curve determined for each ganglia. N = 4 (+/+, +/−) or 5 (−/−, +/+ and +/+, +/+), Graphs are Mean ± SEM, *p = 0.0181, ***p = 0.0007. Two-tailed unpaired t-test. d Heatmap displaying gene clustering following RNA-Seq analysis of ganglia dissected from two-week-old Th-MYCN mice with either homozygous or heterozygous Runx1t1, compared to fully developed murine neuroblastoma tumors. Source data are provided as a Source Data file.
Fig. 3
Fig. 3. RUNX1T1 protein level correlates with neuroblastoma aggressiveness.
a Runx1t1 and MYCN mRNA expression in liver, brain, and tumor samples from homozygous Th-MYCN mice with intact Runx1t1 relative to the control, Gusb. Means ± SEM (n = 3) are indicated. Data were analysed using one-way-ANOVA and corrected for the multiple comparison using the Tukey test. ***p = 0.0042, ns p = 0.1385 for Runx1t1; ***p = 0.0006 for MYCN. Three independent mice were used for each tissue. b Western blot for RUNX1T1 and MYCN in liver, brain, and tumor from homozygous Th-MYCN mice; n = 3 independent mice. c RUNX1T1 mRNA expression relative to the control GUSB in MYCN-non-amplified (non-AMP) and amplified (AMP) neuroblastoma cell lines. Means ± SEM (n = 5 data points representing five different cell lines in each group, and the value of each data point is the mean of three biological repeats) are indicated, two-tailed Mann–Whitney test, P = 0.3095. d Western blot for RUNX1T1 and MYCN across a panel of MYCN non-amplified (non-AMP) and MYCN amplified (AMP) neuroblastoma cell lines. This experiment has been repeated once with similar results. e Scatter plot of RUNX1T1 mRNA expression in MYCN non-amplified (non-AMP) and amplified (AMP) tumors from a publicly available dataset (SEQC) of tumor samples from the neuroblastoma R2 database, n = 410 non-AMP and n = 92 AMP samples; two-tailed unpaired t-test, ****p < 0.0001. f A tissue microarray (TMA) of human neuroblastoma tumor samples (n = 66) was stained with antibodies to either MYCN or RUNX1T1. Photos from three representative MYCN-non-amplified samples and three MYCN-amplified samples are shown. Numbers in panels indicate staining intensity. Photos were taken at 600× magnification, and the scale bars represent 20 microns. H&E, hematoxylin and eosin. g RUNX1T1 staining intensity was scored for all samples in the TMA. Neuroblastoma samples were split into non-amplified (n = 52) and amplified (n = 14) and compared to benign diseases of ganglioneuroblastoma (GNB) (n = 5) and ganglioneuroma (GN) (n = 12). Violin plot describes distribution of intensity, width describes frequency of score in tumors. The thick line represents the median, thin line represents the 25th and 75th percentiles. The bounds of the box show the range of scores. Unpaired t-test, two-tailed *p = 0.0403; **p = 0.0064; ***p = 0.0001. Source data are provided as a Source Data file.
Fig. 4
Fig. 4. MYCN drives increased RUNX1T1 translation.
a Western blot of SH-EP TET-21/N cells after 72 h of treatment with 1 µg/mL doxycycline (left panel). Quantitation from three independent experiments demonstrated significantly decreased MYCN (****p = 0.0001) and RUNX1T1 expression (***p < 0.0001) (right panel). Values represent means from three independent experiments ±SD, two-tailed unpaired t-test. b MYCN and RUNX1T1 mRNA expression after 72 h doxycycline treatment, showing significant downregulation of MYCN (***p = 0.0009) but no significant change in RUNX1T1 (p = 0.9559). Values represent means from three independent experiments ±SD, two-tailed unpaired t-test. c Western blot of SH-EP neuroblastoma cells overexpressing MYCN and empty vector (EV) control (left panel). Quantitation of western blot, from three independent experiments (right panel) demonstrated significantly increased RUNX1T1 expression (*p = 0.0339). Values represent means from three independent experiments ±SD, two-tailed unpaired t-test. d RUNX1T1 and MYCN mRNA expression in SH-EP cells overexpressing MYCN, relative to the control gene (GUSB). Values represent means from three independent experiments ±SD. Two-tailed unpaired t-test, ****p < 0.0001; ns: not significant (p = 0.5679). e Cyclohexamide chase experiment showing RUNX1T1 protein stability in three neuroblastoma cell lines (BE(2)-C, KELLY, SH-EP) over a 12 h time course. Values represent means from three independent experiments ±SD. f Luciferase activity following transfection of murine Runx1t1 5’UTR into MYCN overexpressing or EV SH-EP cells. Values represent means from three independent experiments ±SD. Groups were analysed using two-way ANOVA and Bonferroni multiple comparison. ***p = 0.0007; ns not significant (p = 0.9335). Source data are provided as a Source Data file.
Fig. 5
Fig. 5. RUNX1T1 knockdown reduces neuroblastoma cell proliferation both in vivo and in vitro.
a, b RUNX1T1 knock down after 72hrs of doxycycline (1 µg/mL) treatment in KELLY and BE(2)-C cells respectively, with two independent shRNA constructs. Quantitation from four independent experiments demonstrated significantly decreased RUNX1T1 levels following shRNA-mediated knockdown. Values represent means from three independent experiments ±SD. Ordinary one-way ANOVA with Tukey’s multiple comparisons test; KELLY sh#1 ****p < 0.0001, sh #2 **p = 0.0018, ns p = 0. 6962; BE(2)-C sh #1 ***p = 0.0006, sh #2 *p = 0.0295, ns p = 0.8753. c, d Colony formation after doxycycline-induced knockdown of RUNX1T1 in KELLY and BE(2)-C cells respectively, with two independent shRNA constructs. Colonies are represented as a percentage relative to the untreated control in each experiment. Values represent means from three independent experiments ±SD. RUNX1T1 shRNA-mediated knockdown resulted in significantly decreased colony numbers compared to controls. Ordinary 1-way ANOVA with Tukey’s multiple comparisons test; KELLY sh #1 ****p < 0.0001, sh #2 ****p < 0.0001, ns p = 0. 3589; BE(2)-C sh #1 ***p = 0.0005, sh #2 ****p < 0.0001, ns p = 0.8549. e, f Kaplan–Meier survival analysis of NSG mice xenografted with doxycycline-inducible RUNX1T1 shRNA#1 in KELLY and BE(2)-C cells, respectively. Mice were split into two groups (n = 10 mice per group for KELLY and n = 6 mice per group for BE(2)-C) and fed doxycycline or control food once a 50 mm3 tumor was measurable. P values were determined using the Log-Rank (Mantel–Cox) test, p < 0.0001 for KELLY and p = 0.0035 for BE(2)-C. Growth curves (lower panels) plot size over time, post-doxycycline treatment. Graphs are Mean ± SEM. g Representative images of KELLY cells at 7 days and endpoint ± doxycycline. Tumor samples were stained with H&E or immunohistochemically for RUNX1T1 and Ki67. Photos were taken at 600× magnification, and the scale bars represent 20 microns. Source data are provided as a Source Data file.
Fig. 6
Fig. 6. RUNX1T1 forms part of an LSD1, COREST, and HDAC repressor complex and binds RCOR3 via its NHR4 domain.
a One-dimensional 1H NMR spectra of the Runx1t1 MYND domain showed that the wild-type spectrum (top) has sharp peaks and good dispersion whereas the spectrum of the Y534H mutant (bottom) indicates a protein not well-ordered and/or aggregated—consistent with the mutation disrupting proper folding of the domain. b Co-IP between RUNX1T1_WT/YH-3xFLAG and LSD1-HA (top left), CoREST3-HA (top right), HDAC3-HA (middle left), HDAC1-HA (middle right), HDAC2-HA (bottom left), and HAND2-HA (bottom right). HEK-293T cells were transiently co-transfected with pCMV14 RUNX1T1_WT- or Y534H-3xFLAG and HA-tagged constructs. Nuclear fractions were immunoprecipitated with anti-FLAG antibody and immunoblotted with both anti-FLAG antibody (IP) and anti-HA (Co-IP). An experiment was performed twice. The input sample represents 5% of the non-immunoprecipitated sample and the control sample (EV) resulted from the co-transfection with the HA-tagged construct and the pCMV14 empty vector. c Summary of the Co-IP results. d Binding curves and calculated affinities for peptides RCOR3_1-3 and NCOR2 at pH 6 and RCOR3_3 and NCOR2 at pH 7.5. Binding curves were derived by tracking the combined 1H and 15N Chemical Shift Perturbations of three signals in the MYND domain 15N-HSQC following titration of each peptide in increments of 0.5 molar equivalents into samples of 15N-HNR4 MYND, each of which was fitted to a simple 1:1 binding model. The affinities reported for each peptide are the average (±SD) of three sets of measurements. We estimate the uncertainty for the KD’s to be ~25%. The affinity of NCOR2 at pH 7.5 was calculated by ref. and is listed for comparison. e Schema of CoREST3/RCOR3 deletion mutants (left). HEK-293T cells were transiently co-transfected with pCMV14 RUNX1T1_WT-3xFLAG and HA-tagged CoREST3 constructs (right, n = 1 experiment). Nuclear fractions were immunoprecipitated with anti-FLAG antibody and samples immunoblotted and probed with anti-FLAG antibody (IP, top boxes), or anti-HA (Co-IP, bottom boxes). Input represents 5% of non-immunoprecipitated sample; −/+ indicates co-transfection of pCMV14 EV and HA-CoREST3 constructs (−) or co-transfection of pCMV14 RUNX1T1_WT-3xFLAG and HA-CoREST3 constructs (+). Source data are provided as a Source Data file.
Fig. 7
Fig. 7. RUNX1T1 binds to intergenic regions and interacts with HAND2 to maintain an undifferentiated neuroblastoma phenotype.
a ChIP-seq analysis of RUNX1T1 binding across three replicates showing the number of peaks and their distance in base-pairs (bp) to the transcription start site (TSS). b Proportion of the peaks occurring at different binding site locations from the RUNX1T1 three ChIP-seq replicates. RUNX1T1 binding occurring at either a promoter, gene body, distal intergenic or downstream in relation to a gene (left), binding in an exon, intron or intergenic (middle), and binding within exons at either a coding region (CDS), 5’ untranslated region (UTR) or 3’ UTR (right). c Motif discovery using homer analysis showing significantly enriched motifs from HAND2, PHOX2A, and TCF4. d UpSet plot of the intersection of ChIP-seq peaks of RUNX1T1, HAND2, LSD1, and RCOR3. The number of peaks identified are indicated for each gene and the intersection of gene peaks. RUNX1T1 peaks that co-localized with HAND2, LSD1, and CoREST3 are shown by the blue bar. e GREAT analysis (using Binomial test) showing enriched gene ontology (GO) biological process of the common peaks between RUNX1T1, HAND2, LSD1, and RCOR3. f Number of active, poised, and primed enhancer sites where RUNX1T1 binds in the presence (wildtype; WT) and absence of RUNX1T1 (knock out; KO).
Fig. 8
Fig. 8. RUNX1T1 depletion downregulates MYCN target genes, upregulates PRC2 silenced genes in neuroblastoma, and inhibits colony formation in aRMS and SCLC cells.
a Gene set enrichment analysis (GSEA) for Hallmark gene sets performed on RNAseq data obtained following RUNX1T1 shRNA knockdown in KELLY cells. A bubble plot is shown with the size of the bubble representing the significance based on the nominal p value. NES: normalized enrichment score showing the strength and enrichment direction. The column labeled ganglia represents the same analysis performed on ganglia (Th-MYCN+/+; Runx1t1+/−) at 2 weeks versus tumor obtained from Th-MYCN+/+; Runx1t1+/+ mice. b GSEA plot showing Hallmark MYC_target_V1 genes following RUNX1T1 shRNA downregulation in KELLY cells. c GSEA showed significant enrichment of PRC2 target genes (BenPorath_PRC2_targets) following RUNX1T1 shRNA downregulation in KELLY cells. d RUNX1T1 shRNA downregulation in aRMS cell lines (Rh41 and Rh3) significantly decreased cell proliferation, n = 3 independent experiments; graph is mean ± SEM, two-way ANOVA with Dunnett’s multiple comparison. Rh41 sh #1 ± Doxy 6d ***p = 0.0003, 7d and 8d ****p < 0.0001; Rh3 sh #1 ± Doxy 6d *p = 0.0149, 7d and 8d ****p < 0.0001. The immunoblots show decreased RUNX1T1 levels following shRNA-mediated knockdown. Each experiment has been repeated three times with similar results. e RUNX1T1 shRNA downregulation in SCLC cell lines (DMS-273 and DMS-53) significantly decreased clonogenic capacity, n = 3 independent experiments, graph is mean ± SEM, unpaired two-tailed t-test. DMS-273 EV ns p = 0.6682, sh#1 *p = 0.0127, sh#2 *p = 0.0465; DMS-53 EV ns p = 0.2210, sh#1 *p = 0.0325, sh#2 **p = 0.0075. The immunoblots show decreased RUNX1T1 levels following shRNA-mediated knockdown. Each experiment has been repeated three times with similar results. f Proposed mechanism of action of RUNX1T1 in MYCN-amplified neuroblastoma. High levels of MYCN resulting from gene amplification drive increased protein translation which includes increased RUNX1T1 protein levels. High-level RUNX1T1 expression is necessary to maintain an ESC-like phenotype as well as generate enhancer-mediated repression of HAND2 targets genes otherwise required for neuronal differentiation. Loss of RUNX1T1 allows upregulation of HAND2-driven pro-differentiation genes while at the same time inhibiting MYCN activity by decreasing the level of the obligate MYCN dimerization partner MAX. Source data are provided as a Source Data file.

Similar articles

Cited by

References

    1. Brodeur GM. Neuroblastoma: biological insights into a clinical enigma. Nat. Rev. Cancer. 2003;3:203–216. doi: 10.1038/nrc1014. - DOI - PubMed
    1. Maris JM, Hogarty MD, Bagatell R, Cohn SL. Neuroblastoma. Lancet. 2007;369:2106–2120. doi: 10.1016/S0140-6736(07)60983-0. - DOI - PubMed
    1. Shimada H. Tumors of the neuroblastoma group. Pathology. 1993;2:43–59. - PubMed
    1. Westermark UK, Wilhelm M, Frenzel A, Henriksson MA. The MYCN oncogene and differentiation in neuroblastoma. Semin. Cancer Biol. 2011;21:256–266. doi: 10.1016/j.semcancer.2011.08.001. - DOI - PubMed
    1. Irwin MS, et al. Revised neuroblastoma risk classification system: a report from the children’s oncology group. J. Clin. Oncol. 2021;39:3229–3241. doi: 10.1200/JCO.21.00278. - DOI - PMC - PubMed

MeSH terms