. 2024 Jul 11;15(1):5823.
doi: 10.1038/s41467-024-50106-5.

Natural variation of TBR confers plant zinc toxicity tolerance through root cell wall pectin methylesterification

Affiliations

Natural variation of TBR confers plant zinc toxicity tolerance through root cell wall pectin methylesterification

Kaizhen Zhong et al. Nat Commun. .

Abstract

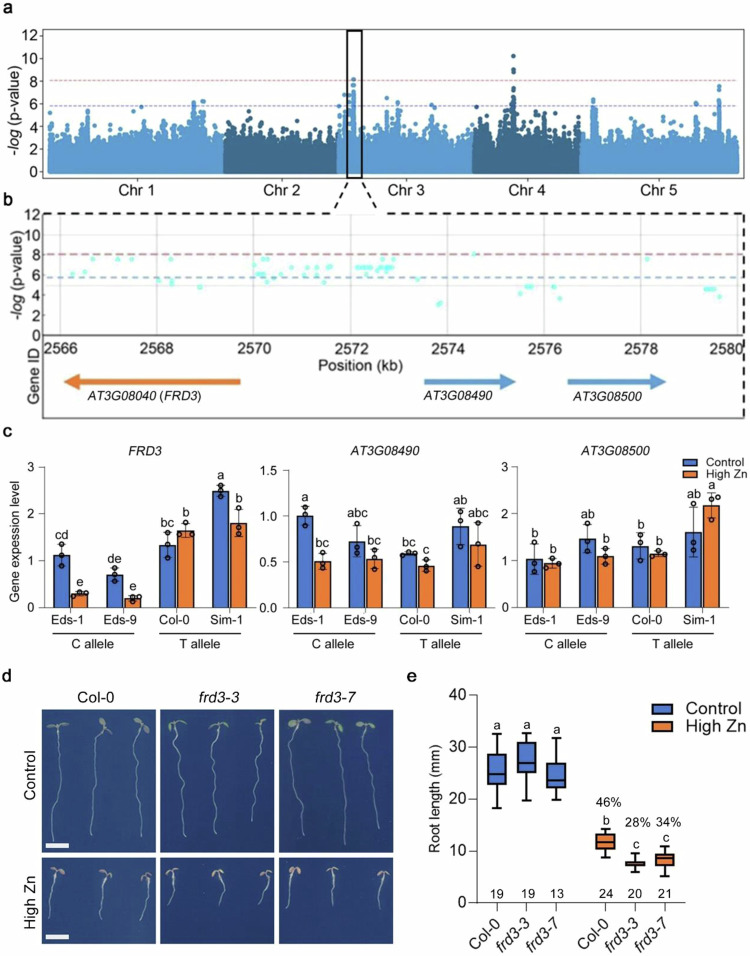
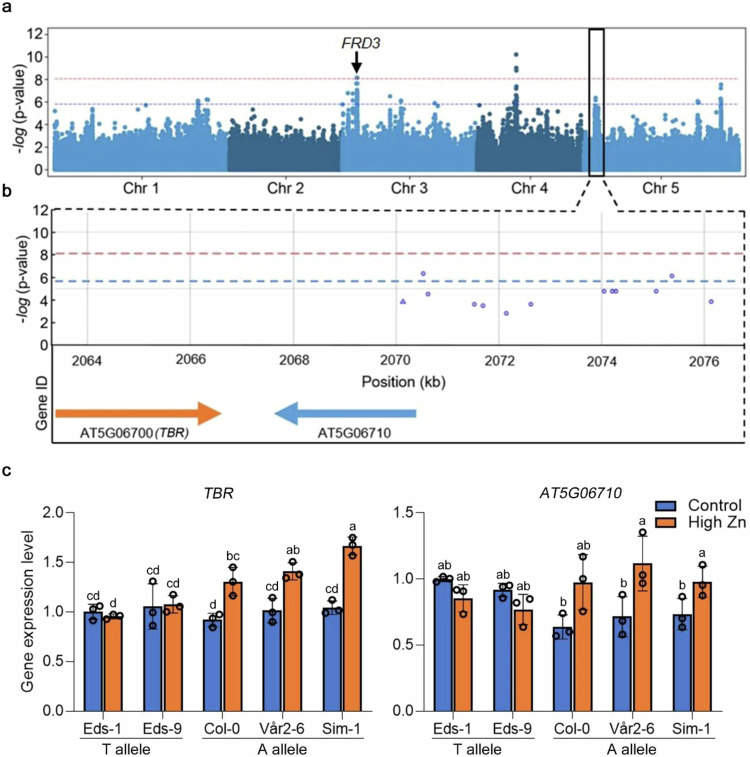
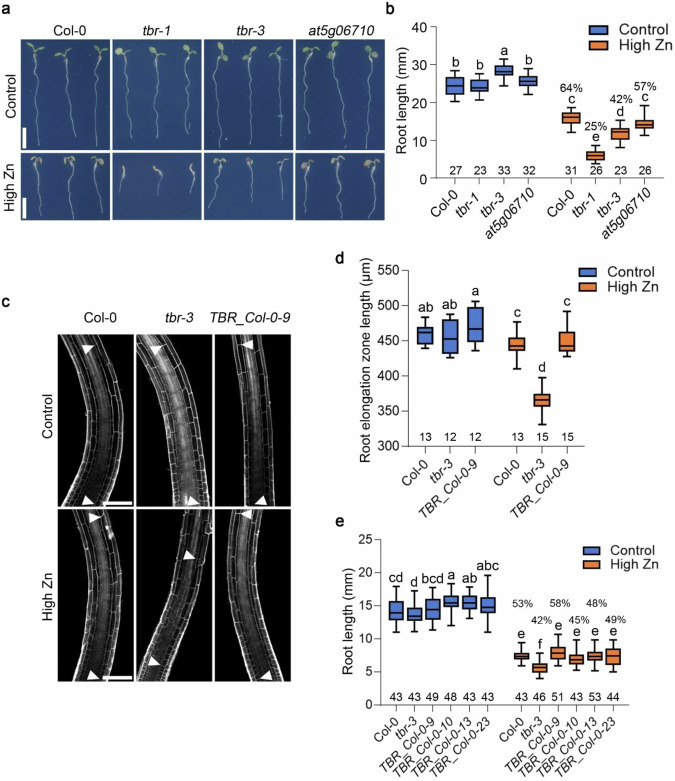
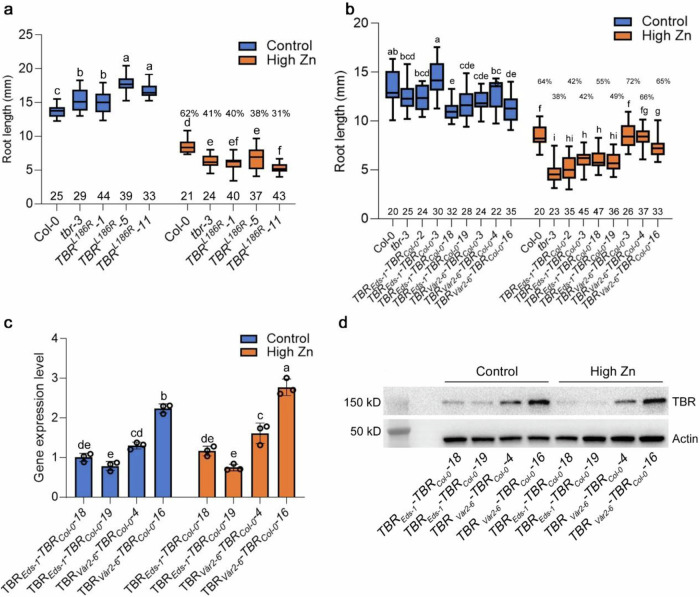
Zinc (Zn) is an essential micronutrient but can be cytotoxic when present in excess. Plants have evolved mechanisms to tolerate Zn toxicity. To identify genetic loci responsible for natural variation of plant tolerance to Zn toxicity, we conduct genome-wide association studies for root growth responses to high Zn and identify 21 significant associated loci. Among these loci, we identify Trichome Birefringence (TBR) allelic variation determining root growth variation in high Zn conditions. Natural alleles of TBR determine TBR transcript and protein levels which affect pectin methylesterification in root cell walls. Together with previously published data showing that pectin methylesterification increase goes along with decreased Zn binding to cell walls in TBR mutants, our findings lead to a model in which TBR allelic variation enables Zn tolerance through modulating root cell wall pectin methylesterification. The role of TBR in Zn tolerance is conserved across dicot and monocot plant species.


Conflict of interest statement

The authors declare no competing interests.

Figures

Fig. 1
Fig. 1. Natural allelic variation of FRD3 is associated with root growth responses to high Zn levels.
a, b Genome-wide Manhattan plot (a) and regional plot (b) of GWAS for the relative primary root length in high Zn conditions (root length high Zn / root length control) at 7 days after germination (DAG). x-axis: SNP position. y-axis: -log10 p-value of association of the SNPs according to AMM mixed model analysis. Chromosomes are depicted in different colors. The horizontal blue dashed line corresponds to a 5% significance threshold after the Benjamini Hochberg correction and the red dashed line corresponds to a 5% significance threshold after Bonferroni correction. The black box in (a) indicates the significant GWA peak on Chromosome 3. Regional plot in (b) of the significant SNPs and candidate genes surrounding the significant peak on Chromosome 3. c Gene expression levels of FRD3, AT3G08490, and AT3G08500 in roots of accessions with contrasting root responses to high Zn (Sensitive accession: Eds-1 and Eds-9; Tolerant accession: Col-0 and Sim-1). Expression levels were normalized to the expression of Eds-1 in control conditions. Data are mean ± standard deviation (S.D.). Circles indicate a single biological replication, n = 3. Statistical analysis was performed using one-way ANOVA analysis with Tukey’s HSD test (p < 0.05). d Representative images of frd3 mutants (frd3-3 and frd3-7) and their wildtype Col-0 seedlings grown on control and high Zn (300 µM) medium at 7 DAG. Scale bars: 5 mm. e Boxplots for root length of frd3 mutants and their wildtype depicted in (d). The value on the top of each box in high Zn is the relative root length (root length in high Zn / root length in control). The number below each box indicates the number of replicates. Statistical analysis was performed using one-way ANOVA analysis with Tukey’s HSD test (p < 0.05). For box plots, the horizontal line represents the median value, the lower and upper quartiles represent the 25th and 75th percentile, and the whiskers show the maximum and minimum values. Source data are provided as a Source Data file.
Fig. 2
Fig. 2. Natural allelic variation of TBR is associated with root growth responses to high Zn levels.
a, b Genome-wide Manhattan plot (a) and regional plot (b) of GWAS for the relative primary root length in high Zn conditions (root length high Zn / root length control) at 7 DAG. x-axis: SNP position. y-axis: -log10 p-value of association of the SNPs according to AMM mixed model analysis. Chromosomes are depicted in different colors. The horizontal blue dash line corresponds to a 5% significance threshold after Benjamini Hochberg correction and the red dash line corresponds to 5% significance threshold after Bonferroni correction. The black box in (a) indicates the significant GWA peak on Chromosome 5. b Regional plot of the significant SNPs and candidate genes surrounding the significant GWA peak on chromosome 5. c Gene expression levels of AT5G06700 (TBR) and AT5G06710 in roots of representative accessions (Sensitive: Eds-1 and Eds-9; Intermediate: Col-0; Tolerant: Vår2-6 and Sim-1). Expression levels were normalized to the expression of Eds-1 in control conditions. Data are mean ± S.D. Circles indicate a single biological replication, n = 3. Statistical analysis was performed using one-way ANOVA analysis with Tukey’s HSD test (p < 0.05). For qRT-PCR analysis, the seedlings were grown directly on 1/2 MS medium for 5 DAG and then transferred to control and high Zn (300 µM) liquid medium for 12 h. Source data are provided as a Source Data file.
Fig. 3
Fig. 3. TBR is required for root growth tolerance to high Zn levels.
a Pictures of seedlings of Col-0, tbr mutants, and the at5g06710 mutant grown on control and high Zn (300 µM) medium at 7 DAG. Scale bars: 5 mm. b Boxplots for root length depicted in (a). The value on the top of each box in high Zn is the relative root length (root length in high Zn / root length in control). The number below each box indicates the number of replicates. Statistical analysis was performed using one-way ANOVA analysis with Tukey’s HSD test (p < 0.05). c Confocal images of the root elongation zone of wildtype, tbr-3 and TBR_Col-0-9 complemented line at 4 DAG. The arrows indicate the border of the maturation zone and meristem zone. Scale bars: 100 µm. d Boxplots for root elongation zone length are depicted in (c). The number below each box indicates the number of replicates. Two times were repeated independently with similar results. Statistical analysis was performed using one-way ANOVA analysis with Tukey’s HSD test (p < 0.05). e Boxplots for root length of TBR_Col-0 T3 complemented lines at 4 DAG. The value on the top of each box in high Zn is the relative root length (root length in high Zn / root length in control). The number below each box indicates the number of replicates. Statistical analysis was performed using one-way ANOVA analysis with Tukey’s HSD test (p < 0.05). For box plots, the horizontal line represents the median value, the lower and upper quartiles represent the 25th and 75th percentile, and the whiskers show the maximum and minimum values. Source data are provided as a Source Data file.
Fig. 4
Fig. 4. Natural TBR variants cause variation of Zn toxicity tolerance.
a Boxplots for root length of T3 transgenic lines expressing pTBR_Eds-1::TBR_Eds-1-HA-mCITRINE-HA (TBR_Eds-1) and pTBR_Vår2-6::TBR_Vår2-6-HA-mCITRINE-HA (TBR_Vår2-6) grown on control and high Zn (300 µM) medium at 4 DAG. The value on the top of each box in high Zn is the relative root length (root length in high Zn / root length in control). The number below each box indicates the number of replicates. Statistical analysis was performed using one-way ANOVA analysis with Tukey’s HSD test (p < 0.05). b TBR transcript expression in the roots of these transgenic lines. Expression levels were normalized to the expression of TBR_Eds-1-11 in control conditions. Data are mean ± S.D. Circles indicate a single biological replication, n = 3. Statistical analysis was performed using one-way ANOVA analysis with Tukey’s HSD test (p < 0.05). c Confocal images of TBR expression in the root tip at 6 DAG. mCITRINE: yellow signal. Scale bars: 100 µm. d Boxplots for fluorescence intensity of T3 transgenic lines depicted in (c). a.u.: arbitrary units. The number below each box indicates the number of replicates. Two times were repeated independently with similar results. Statistical analysis was performed using one-way ANOVA analysis with Tukey’s HSD test (p < 0.05). e Western blot analysis of TBR protein levels. Western blot of HA-tagged TBR was conducted using an anti-HA antibody. Actin was the protein loading control. Two times were repeated independently with similar results. For transcript expression and western blot analysis, the seeds were grown directly on 1/2 MS medium for 5 DAG and then transferred to control and high Zn (300 µM) liquid medium for 12 h. For box plots, the horizontal line represents the median value, the lower and upper quartiles represent the 25th and 75th percentile, and the whiskers show the maximum and minimum values. Source data are provided as a Source Data file.
Fig. 5
Fig. 5. Natural TBR variants underlie variation of Zn toxicity tolerance through sequence variants in the TBR promoter and/or 5’-UTR.
a Boxplots for root length of T3 transgenic lines from pTBR::TBRL186R-HA-mCITRINE-HA (TBRL186R) in control and high Zn (300 µM) conditions at 4 DAG. The value on the top of each box in high Zn is the relative root length (root length in high Zn / root length in control). The number below each box indicates the number of replicates. Statistical analysis was performed using one-way ANOVA analysis with Tukey’s HSD test (p < 0.05). b Boxplots for root length of T3 transgenic lines from pTBR_Eds-1::TBR_Col-0-HA-mCITRINE-HA (TBREds-1-TBRCol-0) and pTBR_Vår2-6::TBR_Col-0-HA-mCITRINE-HA (TBRVår2-6-TBRCol-0) at 4 DAG. The value on the top of each box in high Zn is the relative root length (root length in high Zn / root length in control). The number below each box indicates the number of replicates. Statistical analysis was performed using one-way ANOVA analysis with Tukey’s HSD test (p < 0.05). c TBR transcript expression in roots of TBREds-1-TBRCol-0 and TBRVår2-6-TBRCol-0. Expression levels were normalized to the expression of TBREds-1-TBRCol-0-18 in control conditions. Data are mean±S.D. Circles indicate a single biological replication, n = 3. Statistical analysis was performed using one-way ANOVA analysis with Tukey’s HSD test (p < 0.05). d Western blot analysis of TBR protein levels. Actin is the protein loading control. Western blot of HA-tagged TBR was conducted using an anti-HA antibody. Two times were repeated independently with similar results. For box plots, the horizontal line represents the median value, the lower and upper quartiles represent the 25th and 75th percentile, and the whiskers show the maximum and minimum values. Source data are provided as a Source Data file.
Fig. 6
Fig. 6. TBR variants influence changes in pectin methylesterification and the mechanism by which TBR regulatory allelic variation confers root tolerance to elevated Zn levels.
a Pectin methylesterification degree in root cell walls of TBR allelic complemented lines. Data are mean ± S.D. Circles indicate a single biological replication, n = 4, 4, 5, 5, 3, 3, 3, 5. Statistical analysis was performed using one-way ANOVA analysis with Tukey’s HSD test (p < 0.05). b Pectin methyl esterification degree in root cell walls of TBR promoter allelic complemented lines. For the analysis, the seedlings were grown directly on control and high Zn (200 µM) medium for 7 DAG and then harvested. Data are mean ± S.D. Circles indicate a single biological replication, n = 4, 5, 4, 5, 4, 3, 4, 5. Statistical analysis was performed using one-way ANOVA analysis with Tukey’s HSD test (p < 0.05). c A proposed model illustrates how TBR regulatory allelic variation confers root tolerance to elevated Zn levels. TBR allelic variation in promoter and/or 5’-UTR induces higher mRNA levels and higher protein accumulation, which leads to lower pectin methylesterification that facilitates more Zn sequestration in root cell walls. Source data are provided as a Source Data file.
Fig. 7
Fig. 7. TBR function is required for Zn toxicity tolerance in Lotus japonicus and rice.
a Representative pictures of root growth of Gifu and Ljtbr in control and high Zn (200 µM) medium for 8 days. Scale bars: 5 mm. b Boxplots for primary root length of Gifu and Ljtbr depicted in (a). The number below each box indicates the number of replicates. Statistical analysis was performed using one-way ANOVA analysis with Tukey’s HSD test (p < 0.05). c Representative images of CRISPR/Cas9 knockout lines of Ostbl32 and wildtype in control and high Zn (1000 µM) hydroponic solution for 7 days. Scale bars: 10 mm. d Boxplots for primary root length of Ostbl31, Ostbl32 mutants, and wildtype depicted in (c). The number below each box indicates the number of replicates. Statistical analysis was performed using one-way ANOVA analysis with Tukey’s HSD test (p < 0.05). For box plots, the horizontal line represents the median value, the lower and upper quartiles represent the 25th and 75th percentile, and the whiskers show the maximum and minimum values. Source data are provided as a Source Data file.

Similar articles

Cited by

References

    1. Lin YF, Aarts MGM. The molecular mechanism of zinc and cadmium stress response in plants. Cell. Mol. Life Sci. 2012;69:3187–3206. doi: 10.1007/s00018-012-1089-z. - DOI - PMC - PubMed
    1. Broadley MR, White PJ, Hammond JP, Zelko I, Lux A. Zinc in plants. N. Phytol. 2012;173:677–702. doi: 10.1111/j.1469-8137.2007.01996.x. - DOI - PubMed
    1. Nagajyoti PC, Lee KD, Sreekanth TVM. Heavy metals, occurrence and toxicity for plants: a review. Environ. chem. Lett. 2010;8:199–216. doi: 10.1007/s10311-010-0297-8. - DOI
    1. Marschner, P. Mineral Nutrition of Higher Plants 3rd edn, (London: Academic Press, 2012).
    1. Chaney, R. L. Zinc phytotoxicity. In: Robson A. D., ed. Zinc in soil and plants. Dordrecht, the Netherlands: Kluwer Academic Publishers, 135–150 (1993).

MeSH terms

LinkOut - more resources