. 2024 Jul 11;15(1):5830.
doi: 10.1038/s41467-024-49297-8.

GolpHCat (TMEM87A), a unique voltage-dependent cation channel in Golgi apparatus, contributes to Golgi-pH maintenance and hippocampus-dependent memory

Affiliations

GolpHCat (TMEM87A), a unique voltage-dependent cation channel in Golgi apparatus, contributes to Golgi-pH maintenance and hippocampus-dependent memory

Hyunji Kang et al. Nat Commun. .

Abstract

Impaired ion channels regulating Golgi pH lead to structural alterations in the Golgi apparatus, such as fragmentation, which is found, along with cognitive impairment, in Alzheimer's disease. However, the causal relationship between altered Golgi structure and cognitive impairment remains elusive due to the lack of understanding of ion channels in the Golgi apparatus of brain cells. Here, we identify that a transmembrane protein TMEM87A, renamed Golgi-pH-regulating cation channel (GolpHCat), expressed in astrocytes and neurons that contributes to hippocampus-dependent memory. We find that GolpHCat displays unique voltage-dependent currents, which is potently inhibited by gluconate. Additionally, we gain structural insights into the ion conduction through GolpHCat at the molecular level by determining three high-resolution cryogenic-electron microscopy structures of human GolpHCat. GolpHCat-knockout mice show fragmented Golgi morphology and altered protein glycosylation and functions in the hippocampus, leading to impaired spatial memory. These findings suggest a molecular target for Golgi-related diseases and cognitive impairment.


Conflict of interest statement

The authors declare no competing interests.

Figures
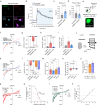
Fig. 1
Fig. 1. TMEM87A regulates Golgi pH in human astrocytes and mediates voltage- and pH-dependent, inwardly rectifying cationic currents in CHO-K1 cells.
a Colocalization of TMEM87A with the Golgin-97, Golgi marker, in cultured human astrocytes. b Comparison of resting Golgi luminal pH and buffer capacities under the absence and presence of 50 mM NH4Cl in Scrambled (gray, n = 14 cells) or TMEM87A shRNA (blue, n = 18 cells) transfected cultured human astrocytes expressing B4GALT1-RpHluorin. Arrows indicate time points in (c, d). c Golgi resting pH values. d Golgi pH values after treating the 50 mM NH4Cl at 30 s. c, d n = 21 cells for Scrambled and n = 18 cells for TMEM87A shRNA. e Schematic diagram of whole-cell patch-clamp recording from TMEM87A WT or TMEM87A-AAA (a.a. 318–320) transfected CHO-K1 cell. Inset: fluorescence image of EGFP-tagged TMEM87A. f Averaged I-V relationship from Control (gray), TMEM87A WT (pink), or TMEM87A-AAA (blue) transfected cells under voltage-ramp protocol (from +100 to −150 mV). g, h Current densities measured at −150 mV in (g) and +100 mV in (h). i The rectification index is calculated as the absolute ratio of amplitude at −150 mV over at +100 mV. gi n = 27 cells for Control, n = 16 cells for TMEM87A WT, or n = 12 cell for TMEM87A-AAA. j Representative currents from Control and TMEM87A WT transfected cells under voltage-step protocol (from +100 mV to −150 mV, 25 mV step). k Averaged I-V relationship from TMEM87A WT transfected cells with bath solutions containing Na+, NMDG+, K+, or Cs+. l, m Current densities measured at −150 mV in (l) and +100 mV in (m). km n = 21 cells for Na+ n = 8 cells for NMDG+, n = 10 cells for K+, n = 8 for Cs+. n Reversal potentials measured from TMEM87A WT transfected cells with bath solutions containing Na+ (n = 13 cells), K+ (n = 10 cells), or Cs+ (n = 8 cells). o Relative permeability ratio of Na+ to K+ (PK+/PNa+, n = 10 cells) or Cs+ (PCs+/PNa+,n = 8 cells). p Representative I-V relationship from TMEM87A WT transfected cell with or without gluconate in the bath solution. q Dose-response curve for percentage currents at −150 mV for gluconate concentrations (n = 5 cells). r Representative I-V relationship from TMEM87A WT transfected cell under various pH. s Normalized currents at −150 mV under various pH, normalized to current at pH 7.3 (n = 7 cells). Data were presented as the mean ± SEM. Statistical analyses were performed using two-tailed unpaired t-test in (c) (t = 8.453, df = 37); two-tailed unpaired t-test with Welch’s test (d) (t = 2.189, df = 37); Kruskal–Wallis test followed by Dunn’s multiple comparisons test in g (H = 25.34), h (H = 21.98), i (H = 15.61); one-way ANOVA followed by Dunnett’s multiple comparisons test in l (F(3,43) = 44.10), m (F(3,43) = 2.164), and n (F(2,28) = 7.552). Source data and exact p values are provided as a Source Data file.
Fig. 2
Fig. 2. TMEM87A is a bona fide functional ion channel in proteoliposome.
a Schematic diagram showing the procedure for reconstitution of TMEM87A into liposome (8:2, POPC:POPG) with dehydration/rehydration method for single-channel recording. b Representative spontaneous single-channel currents from the reconstituted proteoliposome of TMEM87A under voltage steps (from +90 to −150 mV, 30 mV step) from the same patch condition. c Voltage-dependent channel-opening probability (Po) of TMEM87A at each holding potential (n = 3). d I-V relationship of TMEM87A single-channel unitary current activities (n = 3). Data were fitted with a polynomial. e The unitary current × open probability-voltage relationship of TMEM87A (n = 3). f Amplitude histogram of TMEM87A single-channel unitary current activities with open (O) and closed (C) states at +90 mV (orange) and −150 mV (purple) from (b). Distribution data are fitted with a sum of two Gaussians at each holding potential. Data were presented as the mean ± SEM. The n numbers are from three independent proteoliposome experiments. Source data are provided as a Source Data file.
Fig. 3
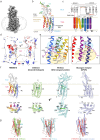
Fig. 3. Cryo-EM structure and structural feature of human TMEM87A.
a Cryo-EM density map of hTMEM87A, colored in slate gray. The density of the micelle (contoured at 0.161σ) is presented as light gray. b Overall structure of hTMEM87A, with ELD (light gray) and TMD [rainbow color from TM1 (red) to TM7 (purple)]. Disulfide bridges (orange, C74–C128, and C89–C431) and N-linked glycans (green, N62, N79, and N127) are shown as sticks. PE and cholesterol are indicated as pink and cyan sticks, respectively. c Topology of hTMEM87A. ELD consists of two α-helices and seven β-strands arranged in an anti-parallel β-sandwich. The secondary structure elements (cylinder for helix and arrow for strand) are colored as in (b). Disulfide bonds are shown as an orange line. Dashed lines denote regions where density was insufficient for model building. d Two different views of the vertical cross-section of the PE-binding pocket in TMD. The electrostatic surface potential of the central cavity is shown. The upper hydrophilic and lower hydrophobic cavities are indicated as cyan and yellow dashed circles, respectively. e Open-book views of the PE-binding pocket and the interaction details. Interaction residues with PE are shown as sticks. The hydrogen and ionic bonds are depicted as a dashed line. Cyan and yellow colored circles represent hydrophilic and hydrophobic cavities in TMD, respectively. f Structural comparison of hTMEM87A TMD with other seven transmembranes (7TM) proteins ChRmine (PDB:7W9W, pale green), Wntless (PDB:7DRT, cyan), and Glucagon receptor (PDB:5YQZ, light purple), shown as a side view (top) and top view (bottom). In the top view, ELD (hTMEM87A), luminal domain (LD, Wntless), and extracellular domain (ECD, glucagon receptor) are omitted for clarity. PE in hTMEM87A, ATR in ChRmine, and Phosphatidylcholine (PC) in Wntless are displayed as pink, cyan, and lime sticks, respectively. g Superimposition of hTMEM87A TMD and TM region of ChRmine (pale green), Wntless (cyan), or glucagon receptor (light purple). The view is a 90° rotation view of (b). along the y-axis to show the lateral opening between TM5 and TM6 of hTMEM87A TMD.
Fig. 4
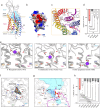
Fig. 4. Putative ion-conducting pathway in hTMEM87A.
a Organization of ion-pathway in hTMEM87A. Water-accessible cavities are shown as a cyan surface, with the putative ion conduction pathway indicated by a red arrow. Negative-charged luminal vestibule (NLV) and constriction site (CS, black-lined box) are labeled. b The surface electrostatic potential of the NLV (yellow dotted circle). ELD and ten residues (R351-S361) are omitted for clarity. c Close-up views of NLV and key negative-charged residues are shown as sticks. d Current density measured at −150 mV for hTMEM87A WT (n = 5) and NLV mutants (n = 15 for E279A, n = 10 for E298A, and n = 10 for D442A). e Representative structures of the K+ conformational dynamics in the NLV of hTMEM87A obtained from GaMD simulations 1. K+ atoms (purple sphere) and their interacting residues (light gray stick) are displayed. TM4 and TM5 are omitted for clarity. f Close-up view of gluconate binding site in hTMEM87A. Gluconate (yellow stick) with cryo-EM density map (contour level = 0.118) and interaction residues (gray sticks) are shown. The hydrogen and ionic bonds are depicted as a dashed line. Helices of hTMEM87A TMD are displayed as transparent cartoons. g Close-up views of the constriction site and the interaction details. Key interaction residues (gray) and PE (pink) are shown as sticks. Cavities are shown as cyan surfaces. Helices of hTMEM87A TMD are displayed as transparent cartoons. TM4 is omitted for clarity. h Current density measured at −150 mV for hTMEM87A WT (n = 5) and CS mutants (n = 7 for Y237A, n = 11 for E272A, n = 9 for K273A, n = 9 for S301A, n = 7 for K304A, n = 8 for R305A, and n = 10 for R309A). Data were presented as the mean ± SEM. Statistical analyses were performed using student one-way ANOVA followed by Dunnett’s multiple comparisons test in d (F(3,36) = 16.64) and h (F(7,58) = 10.84). Source data and exact p values are provided as a Source Data file.
Fig. 5
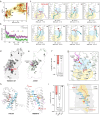
Fig. 5. Role of PE and TM3 in ion conduction in hTMEM87A channel activity.
a 2D histogram of distances (dP and dR2-Cent) for five MD trajectories (5 × 1 μs from system Sp*/L). dP and dR2-Cent are the distances from the phosphorus atom and the center of mass of the R2-fatty acid chain to the smallest-moment principal axis (Pz) of TMD, respectively. PE in cryo-EM structure (red) and seven highly populated states of PE are labeled (from S1 to S7). b Variations of distances of dP and dR2-Cent as a function of time along one trajectory. States of S4, S3, and S1 are indicated by horizontal lines. c The conformational snapshots of PE in seven different states (S1–S7). PE from cryo-EM structure (pink) and MD simulations are displayed as sticks [the phosphorus atom (orange), R1-fatty acid chain (light blue), and R2-fatty acid chain (teal)]. Dashed lines indicate Pz of TMD. Calculated distances of P and R2-Cent are indicated. Cyan and yellow colored circles represent hydrophilic and hydrophobic cavities in TMD, respectively. d, e Cross-sectional view of hTMEM87 WT and A308M. The A308M, which blocks the PE chain from entering the inner cavity, is highlighted in red. A modeled lipid in A308M is shown as a pink stick. f Current density measured at −150 mV for hTMEM87A WT and A308M (bottom, n = 5 WT and n = 10 for A308M). g Close-up view of lipid binding site in hTMEM87A A308M. h Voltage-sensing TM4 of TRIC-B1 (left, PDB: 5EGI) and potential voltage sensor in TM3 of TMEM87A (right). The conserved basic residues (cyan), nearby acidic residues (yellow), and phospholipids (pink) are shown as sticks. i Current density measured at −150 mV for hTMEM87A WT (n = 5) and mutants on either ends of TM3 (n = 7 for E288R, and n = 6 for AAA). j Water-accessible cavities (yellow surfaces) with putative ion-pathway (red arrow). PE is omitted to show the unblocked lower hydrophobic cavity. Potential voltage-sensing helix TM3 and conserved basic residues are shown as cyan. Data were presented as the mean ± SEM. Statistical analyses were performed using a two-tailed unpaired t-test in (f) (t = 4.605, df = 13); one-way ANOVA followed by Dunnett’s multiple comparisons test (i) (F(2,15) = 24.74). Source data and exact p values are provided as a Source Data file.
Fig. 6
Fig. 6. Disruption of Golgi morphology in hippocampal astrocytes and neurons of GolpHCat KO mice.
a Immunostaining for GolpHCat, GFAP, and NeuN in the hippocampus of WT and GolpHCat KO mice (left). High-magnified images showing colocalization of GolpHCat with GFAP or NeuN (right). b Fluorescence intensity of GolpHCat immunoreactivities in GFAP+ cells of WT (n = 206 cells from four mice) and GolpHCat KO (n = 102 cells from three mice) mice. c Fluorescence intensity of GolpHCat immunoreactivities in NeuN+ cells of WT (n = 241 cells from four mice) and GolpHCat KO (n = 259 cells from three mice) mice. d Colocalization of GolpHCat with Golgin-97 or Giantin in hippocampal astrocyte (GFAP) and neuron (NeuN) of WT mice, respectively. e Pearson’s correlation coefficient for colocalization of GolpHCat and Golgi markers in hippocampal astrocytes (n = 14 cells) and neurons (n = 15 cells) of WT mice. f TEM images of the Golgi apparatus in hippocampal astrocytes and neurons of WT and GolpHCat KO mice. Yellow arrows indicate Golgi. g Diagram of Golgi structure for analysis used in (h, i). h Maximum length of Golgi cisternae (left) and width of Golgi (right) in hippocampal astrocytes of WT (n = 19 cells from three mice) and GolpHCat KO (n = 15 cells from three mice) mice. i Maximum length of Golgi cisternae (left) and width of Golgi (right) in hippocampal neurons of WT (n = 14 cells from three mice) and GolpHCat KO (n = 17 cells from three mice) mice. Data were presented as the mean ± SEM. Statistical analyses were performed using two-tailed Mann–Whitney test in b (U = 365.5), c (U = 2), i width (U = 13); two-tailed unpaired t-test in (h)-length (t = 3.778, df = 32), (h)-width (t = 6.739, df = 32), (i)-length (t = 4.741, df = 29). Source data and exact p values are provided as a Source Data file.
Fig. 7
Fig. 7. A deficit of GolpHCat altered glycosylation in the hippocampus.
ae Comparison of 99 N-glycans found in the hippocampus of WT (n = 3 mice) and GolpHCat KO (n = 3 mice) mice. a Heat map for the hierarchical clustering of N-glycans. The scale bar indicates z-scores of standardized glycan value with higher or lower expressed glycans depicted in red or blue, respectively. (Sugar code: Hex_HexNAc_Fuc_NeuAc_(HexA)_sulfation(S)). b PCA analysis of hippocampus samples between WT and GolpHCat KO. c Feature influence strength for principal component 1 in (b). d Volcano plot. The red dots represent significant expression C/H-F glycans, the orange dots represent significantly expression C/H-FS glycans, and the gray dots represent insignificant expressed glycans. e Comparative distribution of all fucosylated glycans NAPI by the number of fucose residues (n = 3 mice per group). Data were presented as the mean ± SEM. Statistical analyses were performed using two-tailed t-test in (d); two-tailed unpaired t-test in (e) (#0, t = 10.18, df = 4; #1, t = 0.6246, df = 4; #>2, t = 3.827, df = 4). Source data and exact p values are provided as a Source Data file.
Fig. 8
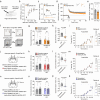
Fig. 8. GolpHCat contributes to hippocampal spatial and contextual memories.
a Schematic diagram of fEPSP recording in the Schaffer-collaterals pathway. b Input-output curve for fEPSP slope obtained with increasing stimulus intensities in WT and GolpHCat KO mice. c Paired-pulse ratios (PPR) obtained with increasing interpulse intervals. Inset: representative fEPSP traces. Scale bar: 1 mV and 500 ms. d HFS (1 s at 100 Hz)-induced LTP. Inset: representative fEPSP traces from before and after HFS-induced LTP. Scale bar: 0.5 mV and 10 ms. e Slope of fEPSP over the last 5 min. n = 10 cells from three mice for WT and n = 14 cells from three mice for GolpHCat KO in (be). f Schematic diagram of the NPR and contextual fear task. g Total object exploration time during the test phase of the NPR task. h Discrimination index during the test phase of the NPR task. i Percentage of freezing during the acquisition phase of contextual fear task (left) and retrieval phase during the 5 min (right). The orange rectangular indicates the time point of shock. n = 9 mice for WT and n = 9 mice for GolpHCat KO in (gi). j Illustration of virus injection for Scrambled (n = 9) and astrocyte-specific GolpHCat KD (Astrocytic KD; n = 9) in the stratum radiatum of the hippocampal CA1 region. k Total object exploration time during the test phase of the NPR task. l Discrimination index during the test phase of the NPR task. m Percentage of freezing during the acquisition phase of contextual fear task (left). Percentage of freezing during the retrieval phase during the 5 min (right). The pink rectangular indicates the time point of shock. n = 9 mice for Scrambled and n = 9 mice for Astrocytic KD in (k–m). n Illustration of virus injection for Scrambled and neuron-specific GolpHCat KD (Neuronal KD) in the pyramidal layer of the hippocampal CA1 region. o Total object exploration time during the test phase of the NPR task. p Discrimination index during the test phase of the NPR task. q Percentage of freezing during the acquisition phase of contextual fear task (left). Percentage of freezing during the retrieval phase during the 5 min (right). The purple rectangular indicates the time point of shock. n = 8 mice for Scrambled and n = 10 mice for Neuronal KD in (oq). Data were presented as the mean ± SEM. Statistical analyses were performed using two-way ANOVA followed by Šídák’s multiple comparisons test in b (F(6,32) = 0.8259), c (F(6,132) = 1.021), i acquisition, (F(10,160) = 0.7738), m acquisition (F(10,160) = 0.2676), q acquisition (F(10,160) = 1.002); two-tailed unpaired t-test in e (t = 2.426, df = 22), i retrieval (t = 2.367, df = 16), l (t = 2.786, df = 16), m retrieval (t = 2.502, df = 16), and p (t = 2.523, df = 16); two-tailed paired t-test in g (WT (t = 4.361, df = 8), KO (t = 2.275, df = 8), k (Scrambled (t = 2.969, df = 8), Astrocytic KD (t = 0.3143, df = 8), o (Scrambled (t = 2.600, df = 7), Neuronal KD (t = 0.1794, df = 9); two-tailed Mann–Whitney test in (h) (U = 0), and q retrieval (U = 16). Source data and exact p values are provided as a Source Data file.

Similar articles

Cited by

References

    1. Rivinoja A, Hassinen A, Kokkonen N, Kauppila A, Kellokumpu SJJ. Elevated Golgi pH impairs terminal N‐glycosylation by inducing mislocalization of Golgi glycosyltransferases. J. Cell Physiol. 2009;220:144–154. doi: 10.1002/jcp.21744. - DOI - PubMed
    1. Maeda, Y. & Kinoshita, T. J. M. The acidic environment of the Golgi is critical for glycosylation and transport. Methods Enzymol. 480, 495–510 (2010). - PubMed
    1. Maeda Y, Ide T, Koike M, Uchiyama Y, Kinoshita T. GPHR is a novel anion channel critical for acidification and functions of the Golgi apparatus. Nat. Cell Biol. 2008;10:1135–1145. doi: 10.1038/ncb1773. - DOI - PubMed
    1. Fan J, et al. Golgi apparatus and neurodegenerative diseases. Int. J. Dev. Neurosci. 2008;26:523–534. doi: 10.1016/j.ijdevneu.2008.05.006. - DOI - PubMed
    1. Joshi G, Bekier ME, Wang YJF. Golgi fragmentation in Alzheimer’s disease. Front. Neurosci. 2015;9:340. doi: 10.3389/fnins.2015.00340. - DOI - PMC - PubMed

MeSH terms