. 2024 Jul 11;7(1):849.
doi: 10.1038/s42003-024-06539-1.

Activation of AMPD2 drives metabolic dysregulation and liver disease in mice with hereditary fructose intolerance

Affiliations

Activation of AMPD2 drives metabolic dysregulation and liver disease in mice with hereditary fructose intolerance

Ana Andres-Hernando et al. Commun Biol. .

Abstract

Hereditary fructose intolerance (HFI) is a painful and potentially lethal genetic disease caused by a mutation in aldolase B resulting in accumulation of fructose-1-phosphate (F1P). No cure exists for HFI and treatment is limited to avoid exposure to fructose and sugar. Using aldolase B deficient mice, here we identify a yet unrecognized metabolic event activated in HFI and associated with the progression of the disease. Besides the accumulation of F1P, here we show that the activation of the purine degradation pathway is a common feature in aldolase B deficient mice exposed to fructose. The purine degradation pathway is a metabolic route initiated by adenosine monophosphate deaminase 2 (AMPD2) that regulates overall energy balance. We demonstrate that very low amounts of fructose are sufficient to activate AMPD2 in these mice via a phosphate trap. While blocking AMPD2 do not impact F1P accumulation and the risk of hypoglycemia, its deletion in hepatocytes markedly improves the metabolic dysregulation induced by fructose and corrects fat and glycogen storage while significantly increasing the voluntary tolerance of these mice to fructose. In summary, we provide evidence for a critical pathway activated in HFI that could be targeted to improve the metabolic consequences associated with fructose consumption.


Conflict of interest statement

The authors declare the following competing interests: R.J.J. and M.A.L. have several patents and patent applications related to blocking fructose metabolism in the treatment of metabolic diseases. R.J.J, M.A.L. and D.R.T. are also members of Colorado Research Partners LLC, that is developing inhibitors of fructose metabolism. R.J.J. also has some shares with XORT therapeutics, which is a startup company developing novel xanthine oxidase inhibitors. All other authors declare no competing interests.

Figures
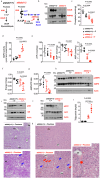
Fig. 1
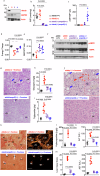
Fig. 1. Activation of AMPD2 and hepatic metabolic dysregulation in aldob(-/-) mice.
a Proposed schematic of AMPD2 activation in HFI. In wild type (aldob(+/+)) mice, fructose is metabolized to fructose-1-phosphate (F1P) by fructokinase (KHK) and to glyceraldehyde and dihydroxyacetone phosphate (DHAP) by aldolase B. However, in aldob(-/-) mice, the accumulation of F1P leads to intracellular phosphate depletion and the activation of AMPD2. AMPD2 deaminates AMP to inosine monophosphate (IMP) in the first step of the purine degradation pathway which in humans results in uric acid formation. b Representative western blot from liver extracts for AMPD2, aldolase B and Actin in wild type and aldob(-/-) mice. c Intracellular phosphate levels in wild type (aldob(+/+)) and aldob(-/-) mice fed sucrose-free (W) or chow containing 1% (w/w) fructose (F) for 2 weeks. d Hepatic AMPD activity in the same mouse groups as in c. eg Intrahepatic ATP, ADP and AMP levels and calculated energy charge and AMP/ATP ratio in the same mouse groups as in c. h Representative western blot from liver extracts for activated (pAMPK), total AMPK and Actin control in the same groups as in (c). i Top, representative western blot from liver extracts for inhibited (pGS), total GS and Actin control in 1% fructose-fed wild type and aldob(-/-) mice. Bottom, representative liver PAS image from 1% fructose-fed wild type and aldob(-/-) mice. Blue arrows denote macrosteatotic areas. j Representative western blot from liver extracts for inhibited (pACC), total ACC and Actin control in 1% fructose-fed wild type and aldob(-/-) mice. k Representative liver H&E image from 1% fructose-fed wild type and aldob(-/-) mice. l Liver triglycerides in wild type (aldob(+/+)) and aldob(-/-) mice fed sucrose-free or chow containing 1% (w/w) fructose for 2 weeks. Blue arrows denote macrosteatotic areas. Red arrows indicate areas with ductal reaction. Size Bar: 20 µM. PT Portal triad, CV Central vein. The data in (bg) were presented as the means ± SEM and analyzed by One Way ANOVA with Tukey post hoc analysis. n = 6 mice per group.
Fig. 2
Fig. 2. Blockade of AMPD2 ameliorates metabolic dysregulation in aldob(-/-) mice.
a Representative western blot from liver extracts for AMPD2, aldolase B and Actin control in wild type (aldob(+/+)), aldob(-/-) control, AMPD2 heterozygous and AMPD2 homozygous mice. Hepatic IMP (b), AMP (c), energy charge (d) and AMP/ATP ratio (e) in the same mouse groups as in (a). f Representative western blot from liver extracts for activated (pAMPK), total AMPK and Actin control in the same groups as in a. Representative liver PAS image (g) in fructose-fed and glycogen content (h) in the same groups as in (g). Blue arrows denote macrosteatotic areas. Liver triglyceride content (i) in the same groups as in (g) and representative H&E image (j) in fructose-fed aldob(-/-) and aldob/ampd2(-/-) mice. Blue arrows denote macrosteatotic areas. Red arrows indicate inflammation. Insert shows presence of pigmented macrophages. k Representative picro-sirius red under brightfield (left) and polarized light (right) images in fructose-fed aldob(-/-) and aldob/ampd2(-/-) mice. Liver hydroxyproline (l), liver injury score (m) and liver transaminases (n) in the same groups as in (g). Size Bar: 20 µM. PT Portal Triad. CV Central Vein. The data in (be), hi and ln were presented as the means ± SEM and analyzed by One Way ANOVA with Tukey post hoc analysis. n = 6 mice per group.
Fig. 3
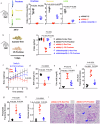
Fig. 3. Blockade of AMPD2 improves the tolerance to fructose of aldob(-/-) mice.
a Average daily intake of 5% (w/v) fructose, sucrose and high fructose corn syrup (HFCS) solutions in wild type (aldob(+/+)), aldob(-/-) and aldob/ampd2(-/-) mice. b Average daily intake sucrose-free (Suc free) or 1% fructose-containing chow in wild type (aldob(+/+)), aldob(-/-) and aldob/ampd2(-/-) mice. Body weight (c) and body weight change (d) in sucrose-free maintained diet and after switching to a 1% fructose diet in wild type (aldob(+/+)), aldob(-/-) and aldob/ampd2(-/-) mice. e Plasma uric acid levels in wild type (aldob(+/+)), aldob(-/-) and aldob/ampd2(-/-) mice fed 1% fructose chow for 5 weeks. Fractional excretion of uric acid (f), phosphate (g) and urinary glucose excretion (h) in the same groups as in (e). i Representative kidney PAS image in sucrose-free and 5-week 1% fructose-fed aldob(-/-) mice. Size Bar: 20 µM. Blue arrows denote tubules with minimal cast. The data in (ah) were presented as the means ± SEM and analyzed by One Way ANOVA with Tukey post hoc analysis. n = 6 mice per group Illustration created with royalty-free images obtained from pixabay (2018) (www.pixabay.com).
Fig. 4
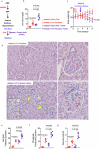
Fig. 4. Raising uric acid exacerbates growth retardation in fructose-exposed aldob(-/-) mice.
a Schematic of the effect of targeting uricase (UOx) by oxonic acid (OxAc) in mice. b Plasma uric acid levels in aldob(-/-) (KW) mice control (red) or on oxonic acid (purple) fed sucrose-free or 1% fructose diets for 5 weeks. c Body weight in the same groups as in (b). d Representative kidney PAS image in 1% fructose alone or in combination with oxonic acid fed aldob(-/-) mice. Yellow arrows point to areas of interstitial inflammation and pigmented macrophages. Red circle indicate glomerular mesangial expansion. Size Bar: 20 µM. Fractional excretion of uric acid (e), phosphate (f) and urinary glucose excretion (g) in the same groups as in (b). The data in (b, c and eg) were presented as the means ± SEM and analyzed by One Way ANOVA with Tukey post hoc analysis. n = 6 mice per group.
Fig. 5
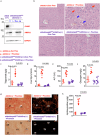
Fig. 5. Liver-specific deletion of AMPD2 prevents liver injury in fructose-fed aldob(-/-) mice.
a Representative western blot from liver extracts for AMPD2, aldolase B and Actin control in wild type (aldob(+/+)) and aldob/ampd2Fl/FLxAlbCre(-/-) mice in kidney (K), liver (L), duodenum (Duo) and jejunal (Jej) extracts. b Representative liver H&E image in sucrose-free and fructose-fed aldob(-/-) and aldob/ampd2Fl/FLxAlbCre(-/-) mice. Blue arrows denote macrosteatotic areas. Red arrows indicate inflammation. c Liver triglyceride content. d Liver injury score. e Plasma ALT. f Liver glycogen g Representative picro-sirius red images under brightfield (left) and polarized light (right) and h) Liver hydroxyproline levels in sucrose-free and fructose-fed aldob(-/-) and aldob/ampd2Fl/FLxAlbCre(-/-) mice. Size Bar: 20 µM. PT Portal Triad. CV Central Vein. The data in cf) and h) were presented as the means ± SEM and analyzed by One Way ANOVA with Tukey post hoc analysis. n = 6 mice per group.
Fig. 6
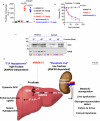
Fig. 6. AMPD2 deletion do not protect mice from fructose-dependent acute hypoglycemia.
a Intrahepatic fructose-1-phosphate (F1P) levels in wild type (aldob(+/+)), aldob(-/-) and aldob/ampd2(-/-) at baseline or 120’ after receiving 1.5 mg/g fructose by oral gavage. b Continuous plasma glucose (% change from baseline) levels in wild type (aldob(+/+)), aldob(-/-) and aldob/ampd2(-/-) mice after receiving 1.5 mg/g fructose by oral gavage. c Hepatic nuclear and cytosolic glucokinase (GCK) and nuclear marker control (CREB) expression in wild type (aldob(+/+)), aldob(-/-) and aldob/ampd2(-/-) mice after receiving 1.5 mg/g fructose by oral gavage. d Proposed schematic on the differential effects of fructose metabolism in aldob(-/-) mice. Fructose metabolism in aldob(-/-) mice leads to both accumulation of F1P and the activation of AMPD2 via phosphate depletion. F1P causes acute hypoglycemia in response to high fructose exposure via activation of GCK and glycolysis. On the other hand, AMPD2 activation at low fructose concentrations triggers hepatic metabolic dysregulation characterized by low energy charge, defective glycogen and lipid metabolism and the production and accumulation of uric acid. In the kidney, renal tubular acidosis upon fructose exposure is manifested by Fanconi syndrome and inefficient tubular reabsorption leading to nutrient waste and failure to thrive. Illustration created with royalty-free images obtained from pixabay (2018) (www.pixabay.com). The data in a, b were presented as the means ± SEM and analyzed by One Way ANOVA with Tukey post hoc analysis. For a, **P < 0.01 versus respective vehicle-gavage control. For B), **P < 0.01 versus fructose-gavage wild type (1.5 mg/g). n = 6 mice per group.

Similar articles

References

    1. Powell ES, Smith-Taillie LP, Popkin BM. Added Sugars Intake Across the Distribution of US Children and Adult Consumers: 1977-2012. J. Acad. Nutr. Diet. 2016;116:1543–1550.e1541. doi: 10.1016/j.jand.2016.06.003. - DOI - PMC - PubMed
    1. Johnson RJ, et al. Potential role of sugar (fructose) in the epidemic of hypertension, obesity and the metabolic syndrome, diabetes, kidney disease, and cardiovascular diseased. Am. J. Clin. Nutr. 2007;86:899–906. doi: 10.1093/ajcn/86.4.899. - DOI - PubMed
    1. Organization, W. H. Guideline: Sugars intake for adults and children. 1–50 (Genea, 2015). - PubMed
    1. Gitzelmann R, Baerlocher K. Vorteile und Nachteile der Frucosein der Nahrung. Padiat. Fortbildk. Prxis. 1973;37:40–55.
    1. James CL, Rellos P, Ali M, Heeley AF, Cox TM. Neonatal screening for hereditary fructose intolerance: frequency of the most common mutant aldolase B allele (A149P) in the British population. J. Med. Genet. 1996;33:837–841. doi: 10.1136/jmg.33.10.837. - DOI - PMC - PubMed

Publication types

MeSH terms