. 2024 Jul 12;9(1):181.
doi: 10.1038/s41392-024-01896-z.

Synergistic induction of mitotic pyroptosis and tumor remission by inhibiting proteasome and WEE family kinases

Affiliations

Synergistic induction of mitotic pyroptosis and tumor remission by inhibiting proteasome and WEE family kinases

Zhan-Li Chen et al. Signal Transduct Target Ther. .

Abstract

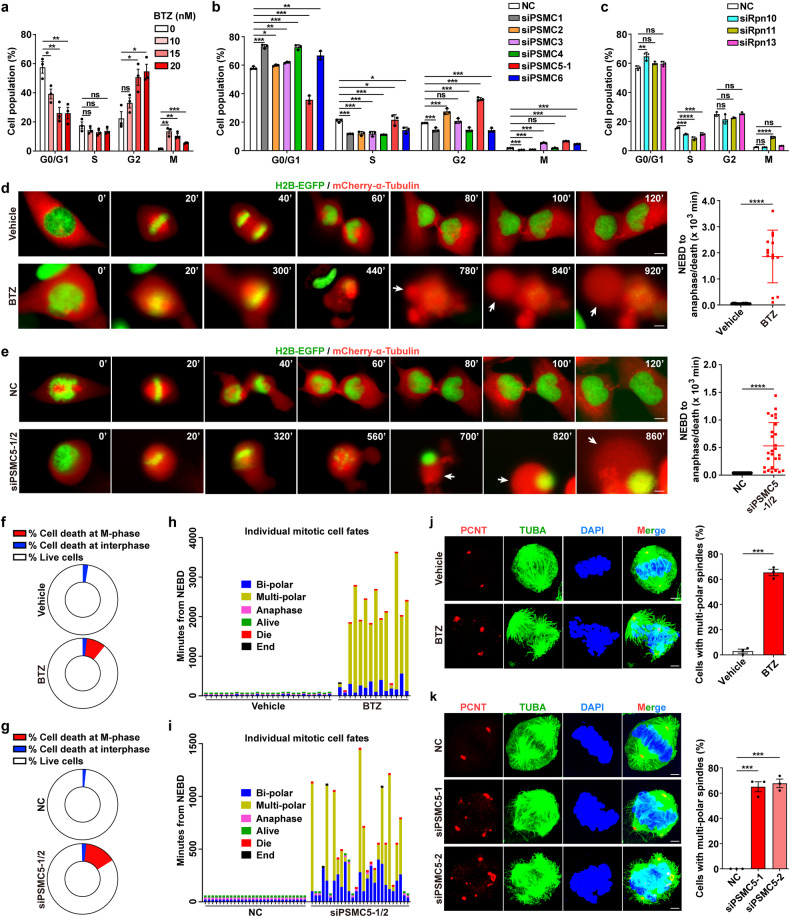
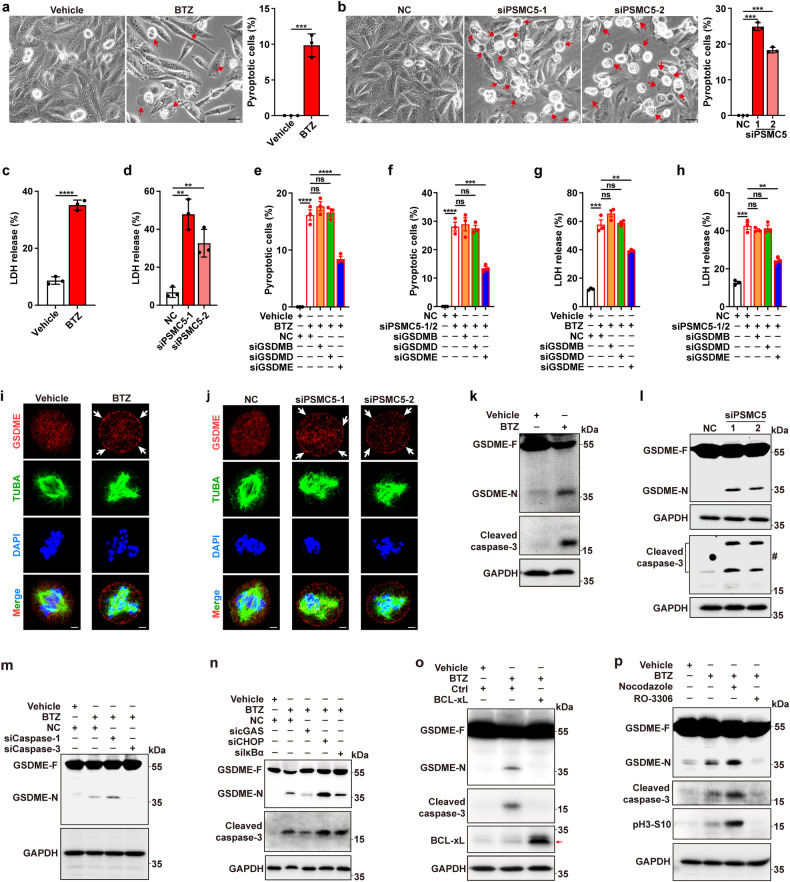
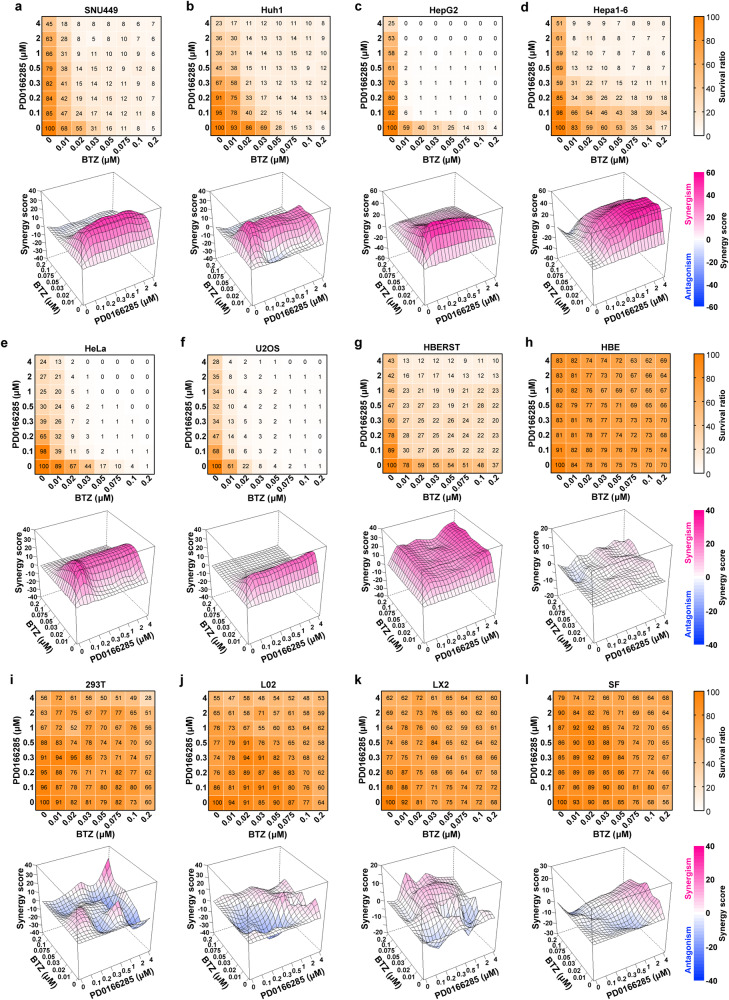
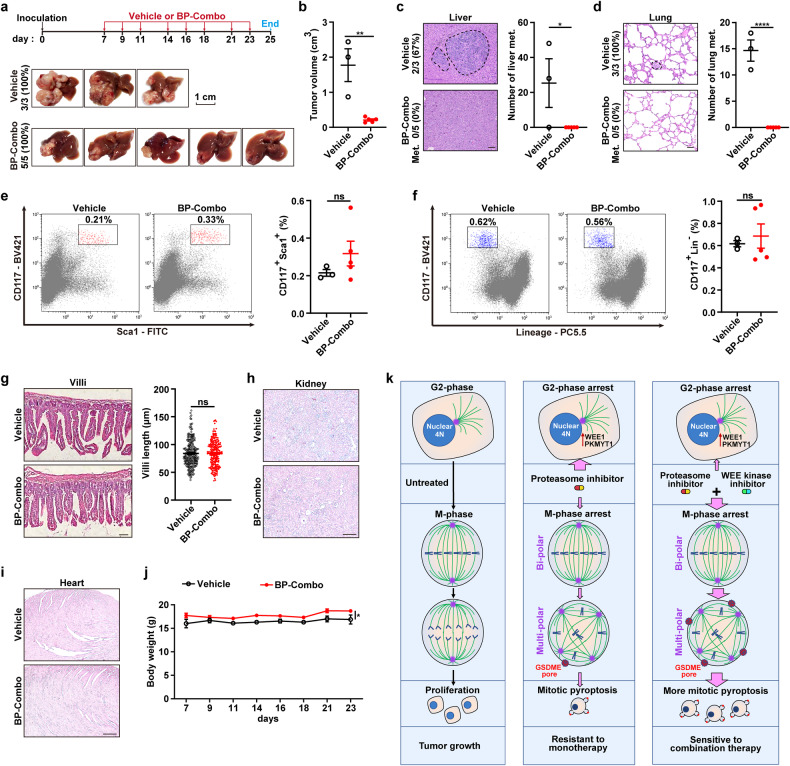
Mitotic catastrophe (MC), which occurs under dysregulated mitosis, represents a fascinating tactic to specifically eradicate tumor cells. Whether pyroptosis can be a death form of MC remains unknown. Proteasome-mediated protein degradation is crucial for M-phase. Bortezomib (BTZ), which inhibits the 20S catalytic particle of proteasome, is approved to treat multiple myeloma and mantle cell lymphoma, but not solid tumors due to primary resistance. To date, whether and how proteasome inhibitor affected the fates of cells in M-phase remains unexplored. Here, we show that BTZ treatment, or silencing of PSMC5, a subunit of 19S regulatory particle of proteasome, causes G2- and M-phase arrest, multi-polar spindle formation, and consequent caspase-3/GSDME-mediated pyroptosis in M-phase (designated as mitotic pyroptosis). Further investigations reveal that inhibitor of WEE1/PKMYT1 (PD0166285), but not inhibitor of ATR, CHK1 or CHK2, abrogates the BTZ-induced G2-phase arrest, thus exacerbates the BTZ-induced mitotic arrest and pyroptosis. Combined BTZ and PD0166285 treatment (named BP-Combo) selectively kills various types of solid tumor cells, and significantly lessens the IC50 of both BTZ and PD0166285 compared to BTZ or PD0166285 monotreatment. Studies using various mouse models show that BP-Combo has much stronger inhibition on tumor growth and metastasis than BTZ or PD0166285 monotreatment, and no obvious toxicity is observed in BP-Combo-treated mice. These findings disclose the effect of proteasome inhibitors in inducing pyroptosis in M-phase, characterize pyroptosis as a new death form of mitotic catastrophe, and identify dual inhibition of proteasome and WEE family kinases as a promising anti-cancer strategy to selectively kill solid tumor cells.


Conflict of interest statement

The authors declare no competing interests.

Figures

Fig. 1
Fig. 1
Inhibition of proteasome induces M-phase arrest, multi-polar spindle formation and mitotic catastrophe. ac The effects of proteasome inhibition on cell cycle progression. SNU449 cells were treated with the indicated dose of BTZ (a) for 30 h or transfected with the indicated RNA duplexes for 60 h (b, c), then stained for Ser-10-phosphorylated histone H3 (pH3-S10) to indicate M-phase cells and stained with propidium iodide (PI) to indicate DNA content, followed by FACS for phase distribution of the cell cycle. di Inhibition of proteasome induced mitotic arrest, multi-polar spindle formation and ballooning bubbles from cell membranes. SNU449 subline that stably expressed histone H2B-EGFP and mCherry-α-tubulin were treated with vehicle or 30 nM BTZ (d, f, h), or transfected with NC or siPSMC5-1/2 (mixture of siPSMC5-1 and siPSMC5-2) for 24 h (e, g, i), followed by live-cell imaging for 46 h (d, f, h) or 70 h (e, g, i). For d (Vehicle, n = 25; BTZ, n = 14) and e (NC, n = 28; siPSMC5-1/2, n = 27), the time from nuclear envelope breakdown (NEBD) to the end of anaphase or cell death was designated as mitotic duration (right panel). White arrows indicate the large bubbles blowing from the plasma membrane. Scale bar, 5 μm. For f and g, cell death was determined by the emergence of pyroptosis characteristics or cell detachment, and the fractions of cells died at interphase or M-phase were quantified based on at least 118 cells in each group. For h (Vehicle, n = 25; BTZ, n = 14) and i (NC, n = 28; siPSMC5-1/2, n = 27), the fates of individual mitotic cell are shown. For d, e, h and i, the time point of NEBD was set as 0. j, k Inhibition of proteasome caused multi-polar spindle formation. SNU449 cells were treated with vehicle or 15 nM BTZ for 30 h (j), or transfected with the indicated RNA duplexes for 60 h (k), then stained for pericentrin (PCNT, red), α-tubulin (TUBA, green) and DAPI (blue) to indicate centrosome, spindle and chromosome, respectively. The proportion of mitotic cells possessing multi-polar spindles was calculated (right panel). Scale bar, 2.5 μm. Error bars: SEM from at least three independent experiments. One-way ANOVA (ac and k) and Student’s t test (d, e and j) were used. *P < 0.05; **P < 0.01; ***P < 0.001; ****P < 0.0001; ns not significant
Fig. 2
Fig. 2
Inhibition of proteasome induces mitotic pyroptosis via GSDME. a, b Proteasome inhibition induced morphology of pyroptosis. Five random fields in each well were captured and then subjected to analysis for the rate of cells with pyroptosis morphology. One of the five fields is shown as representative image for each group. Red arrows indicate the pyroptotic cells with large ballooning bubbles. The proportion of pyroptotic cells was calculated (right panel). Scale bar, 20 μm. c, d Proteasome inhibition stimulated LDH release. e, f GSDME silencing attenuated the proteasome inhibition-induced increase of pyroptotic cells. g, h GSDME knockdown abrogated proteasome inhibition-induced LDH release. For eh, SNU449 cells were transfected with NC or siRNA targeting the indicated gasdermins (siGSDMs) for 24 h, then treated with 15 nM BTZ for another 48 h (e, g), or cells were co-transfected with siGSDMs and siPSMC5-1/2 for 72 h (f, h) before phase-contrast imaging (e, f) or LDH release assay (g, h). i, j Proteasome inhibition induced translocation of GSDME to the plasma membrane of multi-polar mitotic cell. White arrows indicate the clusterization of GSDME on cell membrane. Scale bar, 2.5 μm. k, l Proteasome inhibition induced the cleavage of caspase-3 and GSDME. SNU449 cells were treated with 15 nM BTZ for 48 h (a, c, i, k), or transfected with the indicated RNA duplexes for 72 h (b, d, j, l) before phase-contrast imaging (a, b), LDH detection (c, d), immunofluorescent staining for GSDME (Red), α-tubulin (TUBA, green) and chromosomes (DAPI, blue) (i, j), or immunoblotting (k, l). #, unspecific band. m Silencing caspase-3 but not caspase-1 blocked the BTZ-induced GSDME cleavage. n Silencing cGAS but not CHOP or IκBα attenuated the BTZ-induced cleavage of caspase-3 and GSDME. For m, n, SNU449 cells were transfected with NC or the indicated siRNA for 24 h, then treated with 15 nM BTZ for another 48 h before immunoblotting. o Ectopic expression of BCL-xL attenuated the BTZ-induced cleavage of caspase-3 and GSDME. SNU449-BCL-xL and its control line SNU449-Ctrl were treated with vehicle or 15 nM BTZ for 48 h before immunoblotting. Red arrows indicate the target band. p BTZ-induced cleavage of GSDME was enhanced by nocodazole but was inhibited by CDK1 inhibitor RO-3306. SNU449 cells were pretreated with vehicle, 50 ng/mL nocodazole or 10 μM RO-3306 for 6 h, followed by treatment with vehicle or 15 nM BTZ for another 48 h before immunoblotting. Error bars: SEM from at least three independent experiments. Student’s t test (a and c) and one-way ANOVA (b and dh) were used. **P < 0.01; ***P < 0.001; ****P < 0.0001; ns not significant
Fig. 3
Fig. 3
PD0166285 abrogates BTZ-induced G2-phase arrest and enhances BTZ-induced mitotic catastrophe. a BTZ increased the protein levels of CHK1, WEE1, PKMYT1 and Tyr15-phosphorylated CDK1. SNU449 cells were treated with BTZ at the indicated concentrations for 18 h before immunoblotting. b, c PD0166285 effectively alleviated BTZ-induced G2-phase arrest. Schematic diagrams of study design are shown in b. The triangles indicate the time points for the indicated treatment. SNU449 cells were pretreated with vehicle or 20 nM BTZ for 18 h, followed by treatment with vehicle or 0.5 μM of the indicated inhibitors for another 2 h before pH3-S10/PI staining and FACS (c). d Ectopic expression of the dominant active mutant CDK1-T14A/Y15F enhanced the BTZ-induced up-regulation of pH3-S10. SNU449-CDK1, SNU449-CDK1-T14A/Y15F and control line SNU449-Ctrl were treated with BTZ at the indicated concentrations for 30 h before immunoblotting. e Concurrent exposure to PD0166285 potentiated BTZ-induced accumulation of mitotic cells. SNU449 cells were treated with vehicle, 20 nM BTZ, 0.25 μM PD0166285, or BP-Combo (20 nM BTZ and 0.25 μM PD0166285) for 24 h before pH3-S10/PI staining and FACS. fi PD0166285 amplified the effects of BTZ in inducing mitotic arrest and mitotic cell death. SNU449 subline that stably expressed histone H2B-EGFP and mCherry-α-tubulin were treated with 20 nM BTZ, 0.25 μM PD0166285, or BP-Combo, followed by live-cell imaging for a total of 2600 min. Representative images (f) and quantification of mitotic duration (g) are shown. White arrows indicate the large bubbles blowing from the plasma membrane (f). Scale bar, 5 μm. The cell death was determined by the emergence of pyroptosis characteristics or cell detachment, and the fractions of cell death at interphase or M-phase were quantified based on at least 146 cells in each group (h). In i, the fates of each cell within 2600 min are presented, each horizontal line represents one cell, and a fork in the line indicates cell division and cell fate of each daughter cell is also shown. The beginning time of BTZ treatment was set as 0. For a and d, red arrows indicate the target band. Error bars: SEM from at least three independent experiments. One-way ANOVA (c, e and g) was used. *P < 0.05; **P < 0.01; ***P < 0.001; ****P < 0.0001; ns not significant
Fig. 4
Fig. 4
PD0166285 augments BTZ-induced pyroptosis. a PD0166285 enhanced the role of BTZ in increasing the proportion of cells with pyroptosis morphology. Red arrows indicate the pyroptosis cells with large bubbles. Five random fields in each well were captured and then subjected to analysis for the rate of cells with pyroptosis morphology. One of the five fields is shown as representative image for each group. Scale bar, 50 μm. b PD0166285 enhanced the role of BTZ in increasing the fraction of cells with Annexin V/PI double-staining. c PD0166285 promoted the effects of BTZ in promoting LDH release. d PD0166285 enhanced the role of BTZ in promoting GSDME cleavage. Red arrows indicate the target band. For ad, SNU449 (left panel) and HeLa (right panel) cells were exposed to vehicle, 20 nM BTZ, 0.25 μM PD0166285, or BP-Combo for 30 h (SNU449) or 24 h (HeLa) before phase-contrast imaging (a), Annexin V/PI staining (b), LDH release assay (c) and immunoblotting (d). Error bars: SEM from at least three independent experiments. One-way ANOVA (ac) was used. *P < 0.05; **P < 0.01; ***P < 0.001; ****P < 0.0001; ns not significant
Fig. 5
Fig. 5
BTZ and PD0166285 shows synergistic effect in killing cancer cells but not immortalized cells. ag Various cancer cell lines were sensitive to BP-Combo treatment. hl Immortalized cell lines and normal cells were resistant to BP-Combo treatment. Cancer cell lines from hepatoma (SNU449, Huh1, HepG2, Hepa1-6), cervical cancer (HeLa) and osteosarcoma (U2OS), transformed human bronchial epithelial cell line (HBERST), immortalized cell lines (HBE, 293T, L02, LX2) and normal cell (SF) were treated for 48 h with a combination of BTZ and PD0166285 at the indicated concentration. Cell survival was measured by Alamar Blue assay. Cooperativity screens (upper panels) and Loewe plots (down panels) for the synergistic effect of BTZ and PD0166285 are shown based on at least three independent experiments. In upper panels, color bars indicate the percentage of surviving cells in BP-Combo-treated group, which was normalized to untreated group. In down panels, color bars indicate synergy score in the Lowe plots; a score greater than 0 indicates synergism, and less than 0 indicates antagonism
Fig. 6
Fig. 6
BTZ and PD0166285 has a synergistic effect in suppressing growth of subcutaneous tumor xenografts. a, b BP-Combo showed much stronger effect than BTZ or PD0166285 monotreatment in repressing colony formation of tumor cells. SNU449 and HeLa cells were treated with vehicle, BTZ or PD0166285 alone, or with BP-Combo for 10 days before staining with 0.1% crystal violet. The representative images (a) and colony quantification (b) are shown. Scale bar, 2 mm. Error bars: SEM from at least three independent experiments. cg BP-Combo showed much stronger effect than BTZ or PD0166285 monotreatment in inhibiting subcutaneous tumor xenograft development. The BALB/c nude mice were subcutaneously injected with HeLa cells, and then intraperitoneally injected with the indicated inhibitors one day after tumor cell implantation (early treatment, c), or when tumor volumes reached ~50 mm3 (late treatment, d, e). Early treatment: n = 5 (vehicle), 6 (BTZ), 6 (PD0166285) and 6 (BP-Combo). Late treatment: n = 3 (vehicle), 3 (BTZ), 3 (PD0166285) and 4 (BP-Combo). For f, g, C57BL/6J mice were subcutaneously injected with Hepa1-6 cells, and then intraperitoneally injected with the indicated inhibitors when tumor volumes reached ~50 mm3. n = 4 for each group. h BP-Combo had much stronger effect than BTZ or PD0166285 monotreatment in increasing pH3-S10 level and inducing GSDME cleavage in tumor xenografts. Mouse xenograft tissues from late treatment groups in Figures d and e were analyzed. i, j Silencing of GSDME diminished the anti-tumor effect of BP-Combo. C57BL/6J mice were subcutaneously injected with Hepa1-6-shNC or Hepa1-6-shGsdme cells, and then intraperitoneally administered with vehicle or BP-Combo treatment when tumor volumes reached ~50 mm3. n = 3 for each group. One-way ANOVA (b, c, e, g) and two-way ANOVA (d, f, i, j) were used. *P < 0.05; **P < 0.01; ***P < 0.001; ****P < 0.0001; ns not significant
Fig. 7
Fig. 7
BP-Combo inhibits the growth and metastasis of mouse autochthonous liver tumors. ac BP-Combo suppressed the growth of mouse autochthonous liver tumors. The day when C57BL/6J mice were hydrodynamically injected with the indicated plasmids was set as day 0 (upper panels). The tumor incidences and photographs of the livers (left panels), the number of macroscopic tumor nodules in the livers (middle panel) and the maximal diameter of macroscopic tumor nodules (right panels) are shown in a and b. The representative images of hematoxylin-eosin (H&E) staining and the numbers of microscopic tumor foci in the livers of c-myc/sgTP53-injected mice are shown in c. Scale bars, 1 cm (a, b) and 100 μm (c). d, e BP-Combo inhibited pulmonary metastasis of c-Myc/sgTP53-induced liver tumors. Photographs of the lungs (left panel) and the number of macroscopic metastatic nodules (right panel) are shown in d. H&E staining (left panel), the number (middle panel) and maximal diameter (right panel) of microscopic pulmonary metastatic foci are shown in e. Metastasis rates are indicated under the images (e). Scale bars, 1 mm (d) and 100 μm (e). Met. metastases. f BP-Combo improved the survival of mice with c-Myc/sgTP53-induced liver tumors. Student’s t test (ae) and the log-rank test (f) was used. *P < 0.05; **P < 0.01
Fig. 8
Fig. 8
BP-Combo represses the growth and metastasis of liver orthotopic xenografts and has no obvious toxicity on normal tissues. a, b BP-Combo suppressed the growth of liver orthotopic xenografts. Hepa1-6 cells were inoculated under the capsule of the left hepatic lobe of C57BL/6 mice. Vehicle or BP-Combo treatment was intraperitoneally administered at the indicated time. The tumor incidences and photographs of dissected livers (a) and the tumor volume (b) are shown. c, d BP-Combo suppressed metastasis of liver xenografts. The representative images of H&E staining and metastasis rates (left panel) and the number of the intrahepatic (c) or pulmonary (d) metastatic foci (right panel) are shown. Scale bar, 50 μm (c) and 25 μm (d). Met. metastases. e, f The proportion of hematopoietic stem and progenitor cells were not affected in BP-Combo-treated mice. Bone marrow cells were isolated from the vehicle or BP-Combo-treated mice and analyzed by flow cytometry to detect CD117+Sca1+ population (e) and CD117+Lin population (f). g BP-Combo did not change the lengths of ileum villi. H&E staining of the ileum villi are shown (left panel) and the villi lengths were calculated (right panel). Scale bar, 25 μm. BP-Combo did not affect the size and tissue structure of kidney (h) and heart (i). Scale bar, 50 μm (h, i). j BP-Combo did not influence mouse body weight. For bj, samples/mice from a were subjected to the indicated analyses. k The working model of synergistic interaction between proteasome and WEE kinase inhibitors. Student’s t test (bg) and two-way ANOVA (j) were used. *P < 0.05; **P < 0.01; ****P < 0.0001; ns not significant

Similar articles

Cited by

References

    1. Vitale I, Galluzzi L, Castedo M, Kroemer G. Mitotic catastrophe: a mechanism for avoiding genomic instability. Nat. Rev. Mol. Cell Biol. 2011;12:385–392. doi: 10.1038/nrm3115. - DOI - PubMed
    1. Galluzzi L, et al. Molecular mechanisms of cell death: recommendations of the Nomenclature Committee on Cell Death 2018. Cell Death Differ. 2018;25:486–541. doi: 10.1038/s41418-017-0012-4. - DOI - PMC - PubMed
    1. Sazonova, E. V., Petrichuk, S. V., Kopeina, G. S. & Zhivotovsky, B. A link between mitotic defects and mitotic catastrophe: detection and cell fate. Biol. Direct16, 25 (2021). - PMC - PubMed
    1. Dominguez-Brauer C, et al. Targeting Mitosis in Cancer: Emerging Strategies. Mol. Cell. 2015;60:524–536. doi: 10.1016/j.molcel.2015.11.006. - DOI - PubMed
    1. Denisenko TV, Sorokina IV, Gogvadze V, Zhivotovsky B. Mitotic catastrophe and cancer drug resistance: A link that must to be broken. Drug Resist. Update. 2016;24:1–12. doi: 10.1016/j.drup.2015.11.002. - DOI - PubMed

Publication types

MeSH terms

LinkOut - more resources