. 2024 Jul 11;14(1):16051.
doi: 10.1038/s41598-024-67021-w.

Epigenetically associated IGF2BP3 upregulation promotes cell proliferation by regulating E2F1 expression in hepatocellular carcinoma

Affiliations

Epigenetically associated IGF2BP3 upregulation promotes cell proliferation by regulating E2F1 expression in hepatocellular carcinoma

Chenghao Liu et al. Sci Rep. .

Abstract

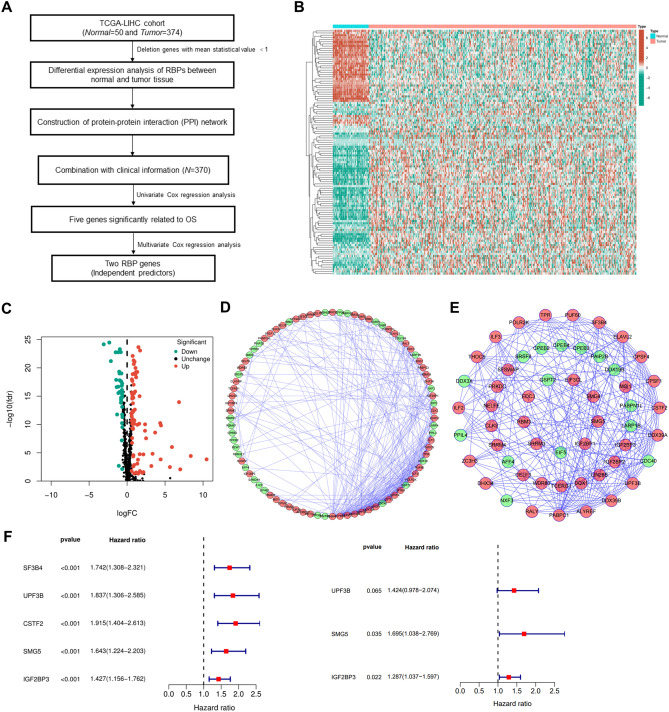
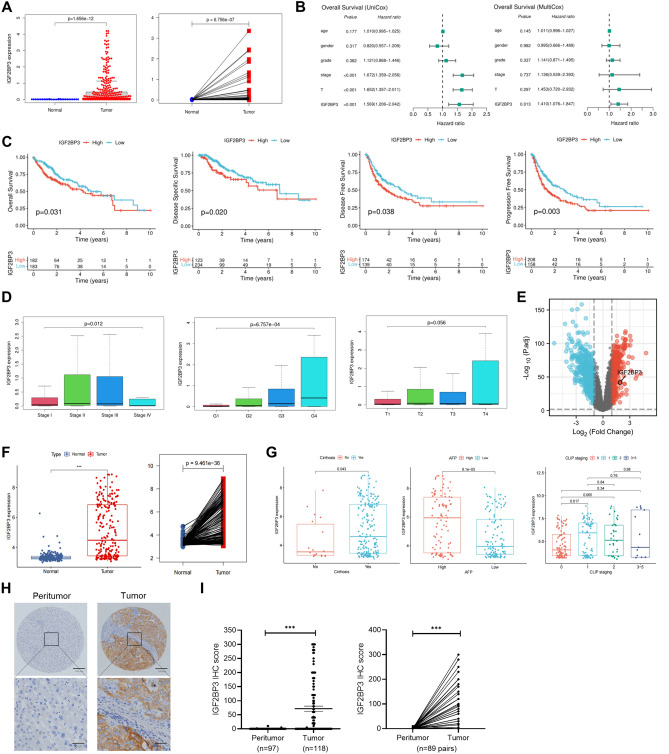
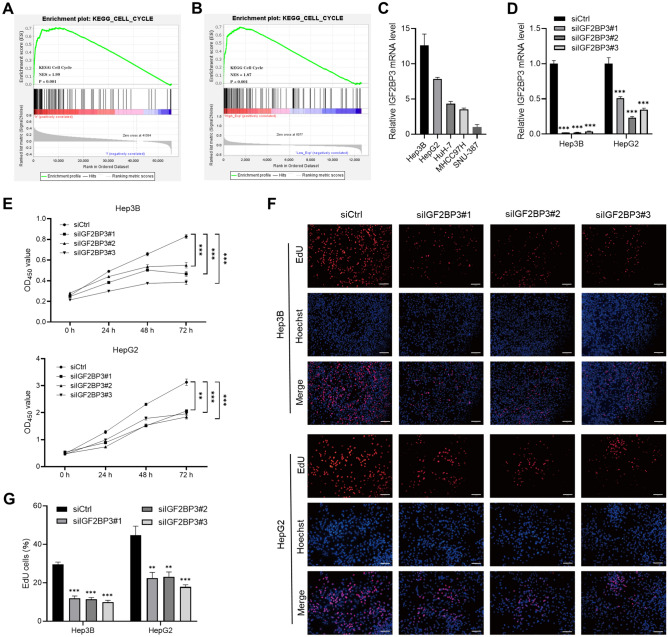
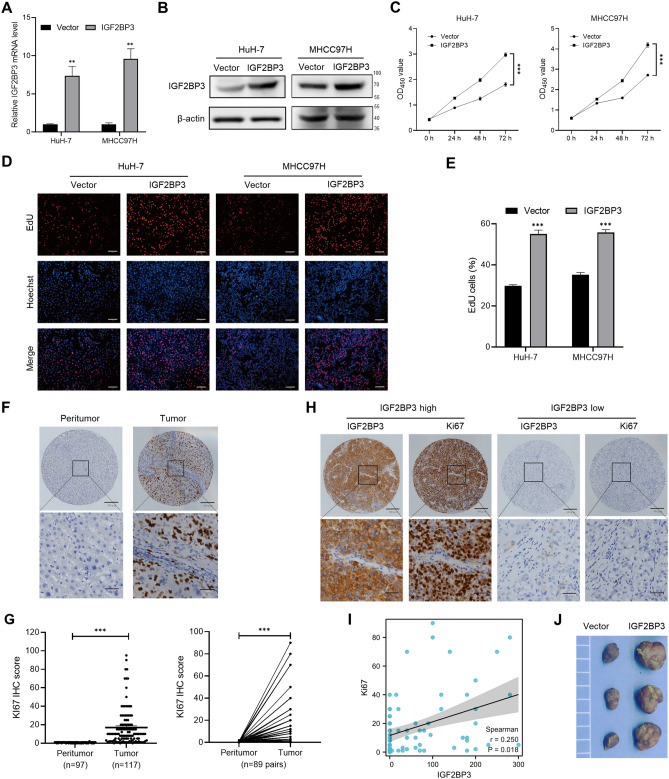
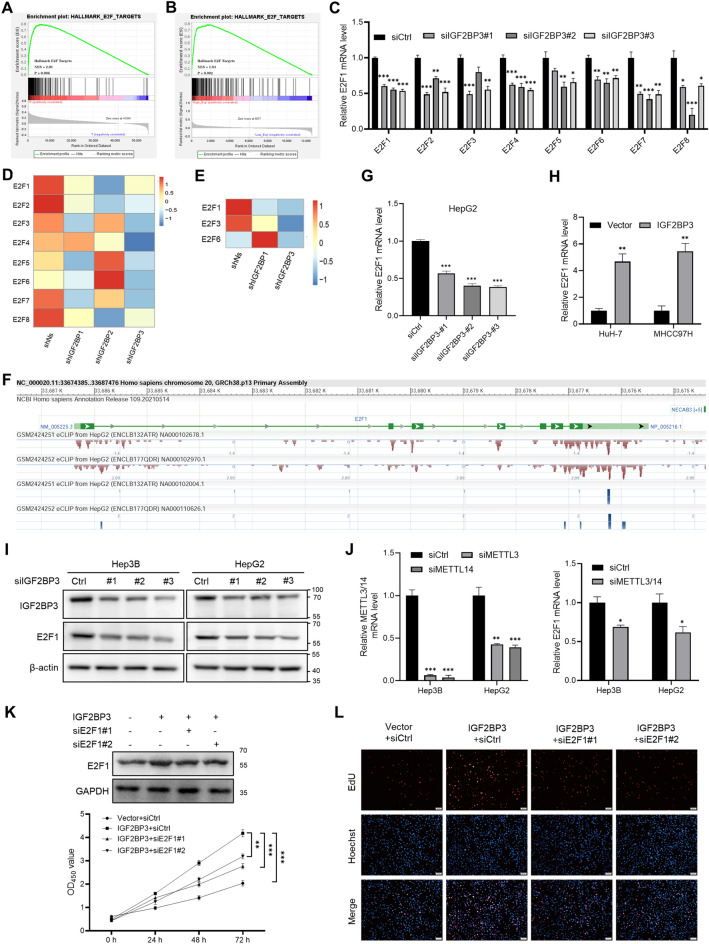
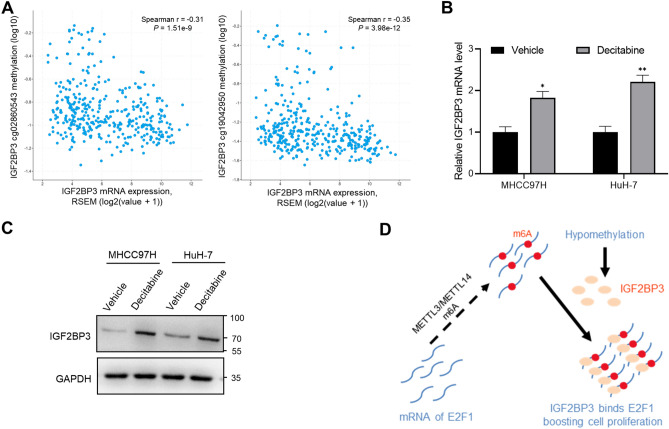
RNA-binding proteins (RBPs) are a class of proteins that primarily function by interacting with different types of RNAs and play a critical role in regulating the transcription and translation of cancer-related genes. However, their role in the progression of hepatocellular carcinoma (HCC) remains unclear. In this study, we analyzed RNA sequencing data and the corresponding clinical information of patients with HCC to screen for prognostic RBPs. Insulin-like growth factor 2 mRNA-binding protein 3 (IGF2BP3) was identified as an independent prognostic factor for liver cancer. It is upregulated in HCC and is associated with a poor prognosis. Elevated IGF2BP3 expression was validated via immunohistochemical analysis using a tissue microarray of patients with HCC. IGF2BP3 knockdown inhibited the proliferation of Hep3B and HepG2 cells, whereas IGF2BP3 overexpression promoted the expansion of HuH-7 and MHCC97H cells. Mechanistically, IGF2BP3 modulates cell proliferation by regulating E2F1 expression. DNA hypomethylation of the IGF2BP3 gene may increase the expression of IGF2BP3, thereby enhancing cell proliferation in HCC. Therefore, IGF2BP3 may act as a novel prognostic biomarker and a potential therapeutic target for HCC.

Keywords: E2F1; HCC; Methylation; Prognosis; RNA-binding protein.


Conflict of interest statement

The authors declare no competing interests.

Figures

Figure 1
Figure 1
Selection of prognosis-related RBPs in HCC. (A) Flowchart demonstrating the workflow of identification of critical prognostic RBPs. (B) Heatmap of differentially expressed RBPs. (C) Volcano plot of differentially expressed RBPs. Upregulated and downregulated genes are represented in red and green, respectively. FDR, false discovery rate. (D,E) PPI network of all and core module-related differentially expressed RBPs (Interaction Score > 0.4) and subnetworks built through the MCODE plugin (Degree Cutoff = 2). The density of the lines represents the ability to interact. Red and green nodes represent upregulated and downregulated RBPs, respectively. (F) Univariate and multivariate Cox regression analyses for identification of critical prognosis-related RBPs.
Figure 2
Figure 2
IGF2BP3 is a potential marker for the prognosis of HCC. (A) IGF2BP3 expression in unpaired (left) and paired (right) HCC and normal tissues in TCGA-LIHC dataset. (B) Univariate (left) and multivariate (right) Cox regression analyses for IGF2BP3. (C) Kaplan–Meier analysis for examining the correlation between IGF2BP3 expression and overall, disease-specific, disease-free, and progression-free survival in TCGA-LIHC dataset. (D) Correlation between IGF2BP3 expression and clinical characteristics of patients in TCGA-LIHC dataset. (E) Volcano plot of differentially expressed RBPs in the GSE14520 dataset. Upregulated and downregulated genes are represented in red and blue, respectively. (F) IGF2BP3 expression in unpaired (left) and paired (right) HCC and normal tissues in the GSE14520 dataset. (G) Correlation between IGF2BP3 expression and clinical characteristics of patients with HCC in the GSE14520 dataset. (H) Representative images of immunohistochemical staining of IGF2BP3 in peri-tumor (left) and tumor (right) tissues. (I) Statistical analysis of immunohistochemical scores in unpaired (left) or paired (right) tumor and peri-tumor tissues. Significant differences were estimated using the Mann–Whitney test ((I), left) and the Wilcoxon matched-pairs signed-rank test ((I), right).
Figure 3
Figure 3
Silencing of IGF2BP3 inhibits the proliferation of HCC cells. (A,B) Gene set enrichment analysis was used to evaluate the enrichment scores of the indicated gene set in the high- and low-IGF2BP3-expression groups in TCGA-LIHC and GSE14520 cohorts. NES, normalized enrichment score; FDR, false discovery rate. (C) qRT-PCR was used to assess IGF2BP3 expression in hepatic tumor cells. (D) qRT-PCR validated the siRNA-mediated knockdown of IGF2BP3 in Hep3B and HepG2 cells. (E) CCK-8 assay revealed that siRNA-mediated downregulation of IGF2BP3 significantly decreased the growth rate of Hep3B (top) and HepG2 (bottom) cells. (F, G) Representative micrographs and quantification of EdU incorporation in the indicated cells. Significant differences were estimated via two-way ANOVA (E) or one-way ANOVA with Turkey post hoc tests (D,G).
Figure 4
Figure 4
IGF2BP3 promotes the proliferation of HCC cells. (A,B) qRT-PCR and western blotting were performed to verify the upregulation of IGF2BP3 in HuH-7 and MHCC97H cells after ectopic expression of IGF2BP3. (C) CCK-8 assay revealed that upregulation of IGF2BP3 via transduction with a recombinant lentivirus significantly increased the growth rate of HuH-7 (left) and MHCC97H (right) cells. (D,E) Representative micrographs and quantification of EdU incorporation in the indicated cells. (F) Representative images of immunohistochemical staining of Ki67 in peri-tumor (left) and tumor (right) tissues. (G) Statistical analysis of immunohistochemical scores in unpaired (left) or paired (right) tumor and peri-tumor tissues. (H) Representative immunohistochemical staining of IGF2BP3 (left) and Ki67 (right) expression in HCC samples. (I) A scatter plot showing the correlation between the IHC scores of IGF2BP3 and Ki67. (J) Tumors formed by subcutaneous injection of HuH-7 cells with IGF2BP3 overexpression or vector control in nude mice. Significant differences were estimated using unpaired Student’s t-test (A,E), two-way ANOVA (C), Mann–Whitney test ((G), left), and Wilcoxon matched-pairs signed-rank test ((G), right).
Figure 5
Figure 5
IGF2BP3 modulates cell proliferation by regulating E2F1 expression. (A,B) Gene set enrichment analysis was used to evaluate the enrichment scores of the indicated gene set in the high- and low-IGF2BP3-expression groups in TCGA-LIHC and GSE14520 cohorts. (C) qRT-PCR was performed to verify the reduced expression of E2F18 in Hep3B cells after IGF2BP3 knockdown. (D,E) Heatmap showing reduced gene expression and mRNA half-lives of E2Fs in HepG2 cells with IGF2BP knockdown. (F) The enrichment of IGF2BP3 binding peaks in the transcript of E2F1 derived from GSE92220 (crosslinking and immunoprecipitation of IGF2BP3). (G,H) qRT-PCR was used to assess E2F1 expression in the indicated cells. (I) Western blotting was used to verify reduced E2F1 expression in Hep3B and HepG2 cells after IGF2BP3 knockdown. (J) qRT-PCR was used to verify reduced E2F1 expression in Hep3B and HepG2 cells after METTL3/14 knockdown. (K,L) CCK-8 and EdU assays showed that upregulation of IGF2BP3 significantly enhanced the growth of HuH-7 cells, which could be reversed by E2F1 silencing. Significant differences were estimated using the one-way ANOVA with Turkey post hoc tests (C, G, and J), unpaired Student’s t-test (H and J), and two-way ANOVA (K).
Figure 6
Figure 6
DNA methylation is negatively correlated with IGF2BP3 expression. (A) The correlation between IGF2BP3 expression and methylation status in the promoter regions was visualized using the cBioPortal for Cancer Genomics. Spearman correlation coefficients and P-values for IGF2BP expression and methylation status are shown. (B) qRT-PCR was used to analyze IGF2BP3 expression in MHCC97H and HuH-7 cells treated with decitabine. Significant differences were estimated using the unpaired Student’s t-test. (C) Analysis of IGF2BP3 expression in MHCC97H and HuH-7 cells treated with decitabine by western blotting. (D) A proposed model for IGF2BP3 promoting tumor proliferation by regulating E2F1.

Similar articles

Cited by

References

    1. Bray F, et al. Global cancer statistics 2022: GLOBOCAN estimates of incidence and mortality worldwide for 36 cancers in 185 countries. CA Cancer J. Clin. 2024;74:229–263. doi: 10.3322/caac.21834. - DOI - PubMed
    1. Wu TK, et al. Hepatocellular carcinoma: Advances in systemic therapies. F1000Res. 2024;13:104. doi: 10.12688/f1000research.145493.2. - DOI - PMC - PubMed
    1. Villanueva A. Hepatocellular carcinoma. N. Engl. J. Med. 2019;380:1450–1462. doi: 10.1056/NEJMra1713263. - DOI - PubMed
    1. Mei Z, et al. Emerging mutual regulatory roles between mA modification and microRNAs. Int. J. Mol. Sci. 2023;24:773. doi: 10.3390/ijms24010773. - DOI - PMC - PubMed
    1. Guillemin A, Kumar A, Wencker M, Ricci E. Shaping the innate immune response through post-transcriptional regulation of gene expression mediated by RNA-binding proteins. Front. Immunol. 2021;12:796012. doi: 10.3389/fimmu.2021.796012. - DOI - PMC - PubMed

MeSH terms

LinkOut - more resources