

An optical photothermal infrared investigation of lymph nodal metastases of oral squamous cell carcinoma
- PMID: 38992088
- PMCID: PMC11239877
- DOI: 10.1038/s41598-024-66977-z
An optical photothermal infrared investigation of lymph nodal metastases of oral squamous cell carcinoma
Abstract
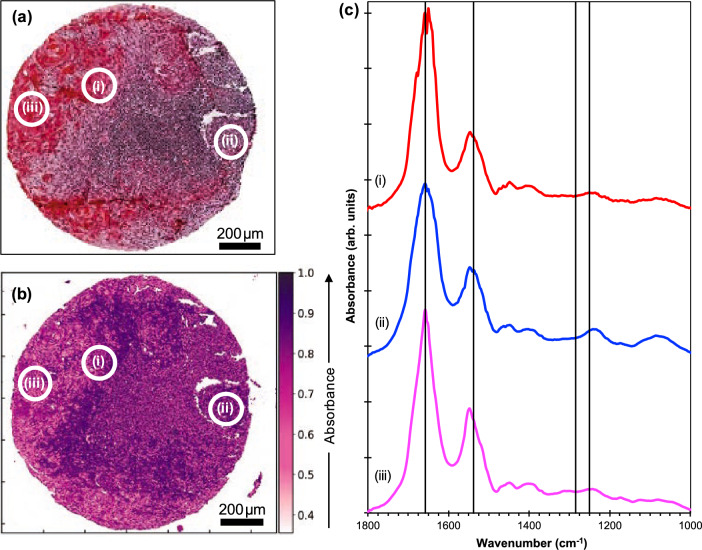
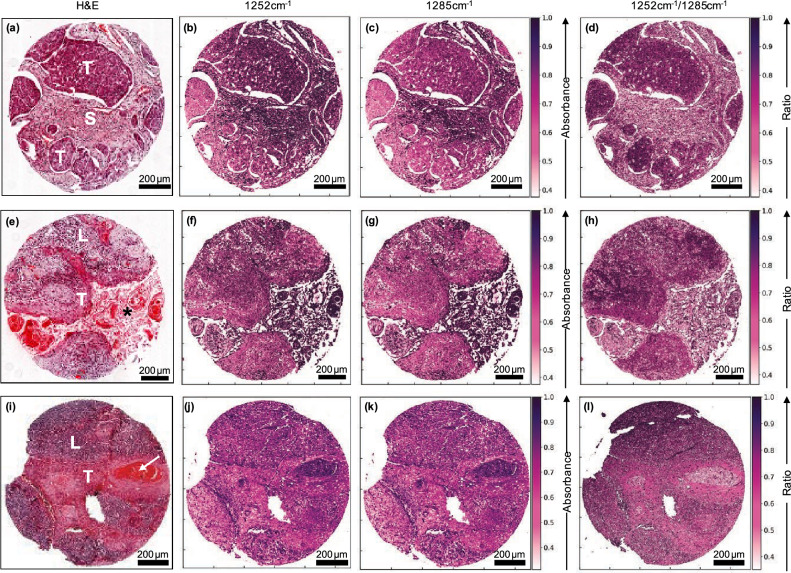
In this study, optical photothermal infrared (O-PTIR) spectroscopy combined with machine learning algorithms were used to evaluate 46 tissue cores of surgically resected cervical lymph nodes, some of which harboured oral squamous cell carcinoma nodal metastasis. The ratios obtained between O-PTIR chemical images at 1252 cm-1 and 1285 cm-1 were able to reveal morphological details from tissue samples that are comparable to the information achieved by a pathologist's interpretation of optical microscopy of haematoxylin and eosin (H&E) stained samples. Additionally, when used as input data for a hybrid convolutional neural network (CNN) and random forest (RF) analyses, these yielded sensitivities, specificities and precision of 98.6 ± 0.3%, 92 ± 4% and 94 ± 5%, respectively, and an area under receiver operator characteristic (AUC) of 94 ± 2%. Our findings show the potential of O-PTIR technology as a tool to study cancer on tissue samples.
© 2024. The Author(s).
Conflict of interest statement
There authors declare no competing interests.
Figures

Similar articles
-
Usefulness of 3T diffusion-weighted MRI for discrimination of reactive and metastatic cervical lymph nodes in patients with oral squamous cell carcinoma: a pilot study.Dentomaxillofac Radiol. 2014;43(3):20130202. doi: 10.1259/dmfr.20130202. Epub 2014 Jan 22. Dentomaxillofac Radiol. 2014. PMID: 24408820 Free PMC article.
-
Predicting Lymph Node Metastasis From Primary Cervical Squamous Cell Carcinoma Based on Deep Learning in Histopathologic Images.Mod Pathol. 2023 Dec;36(12):100316. doi: 10.1016/j.modpat.2023.100316. Epub 2023 Aug 26. Mod Pathol. 2023. PMID: 37634868
-
Detection of micro-metastasis using cytokeratins (AE1/AE3) in haematoxylin & eosin-stained N0 lymph nodes of oral squamous cell carcinoma.Indian J Med Res. 2023 Apr;157(4):316-321. doi: 10.4103/ijmr.IJMR_489_20. Indian J Med Res. 2023. PMID: 37282394 Free PMC article.
-
Lymph nodes in oral squamous cell carcinoma: a comprehensive anatomical perspective.Clin Exp Metastasis. 2024 Dec;41(6):877-890. doi: 10.1007/s10585-024-10317-y. Epub 2024 Oct 8. Clin Exp Metastasis. 2024. PMID: 39377834 Review.
-
Prognostic value of the nodal yield in oral squamous cell carcinoma: a systematic review and meta-analysis.Expert Rev Anticancer Ther. 2023 Mar;23(3):339-345. doi: 10.1080/14737140.2023.2168648. Epub 2023 Jan 22. Expert Rev Anticancer Ther. 2023. PMID: 36645663
Cited by
-
To explore the targeting of toluidine blue: low molecular dextran-40 to the lymphatic system and its effect assessment.Sci Rep. 2025 Jul 5;15(1):24030. doi: 10.1038/s41598-025-09020-z. Sci Rep. 2025. PMID: 40617947 Free PMC article.
References
MeSH terms
Grants and funding
LinkOut - more resources
Full Text Sources
Medical
