. 2024 Dec;31(12):1898-1908.
doi: 10.1038/s41594-024-01356-w. Epub 2024 Jul 11.

A roadmap for ribosome assembly in human mitochondria

Affiliations

A roadmap for ribosome assembly in human mitochondria

Elena Lavdovskaia et al. Nat Struct Mol Biol. 2024 Dec.

Abstract

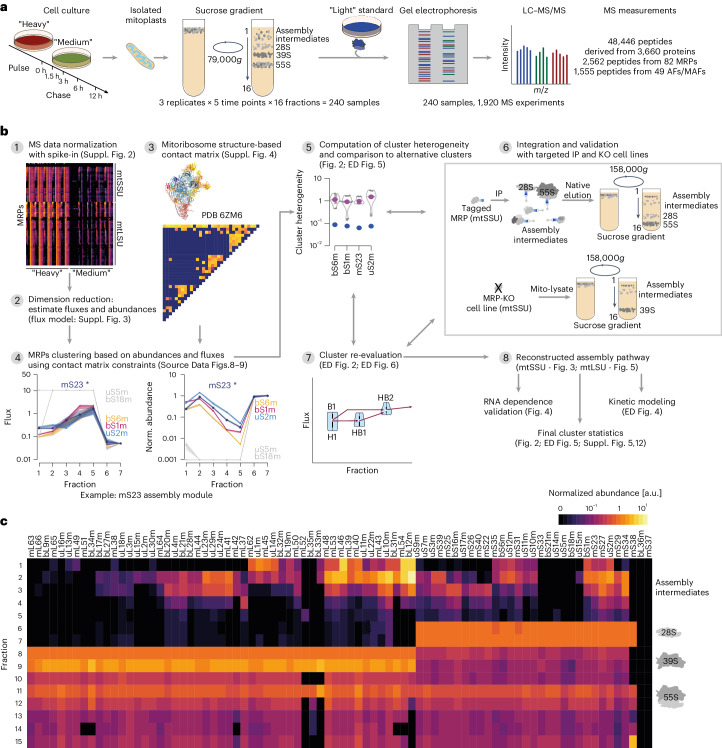
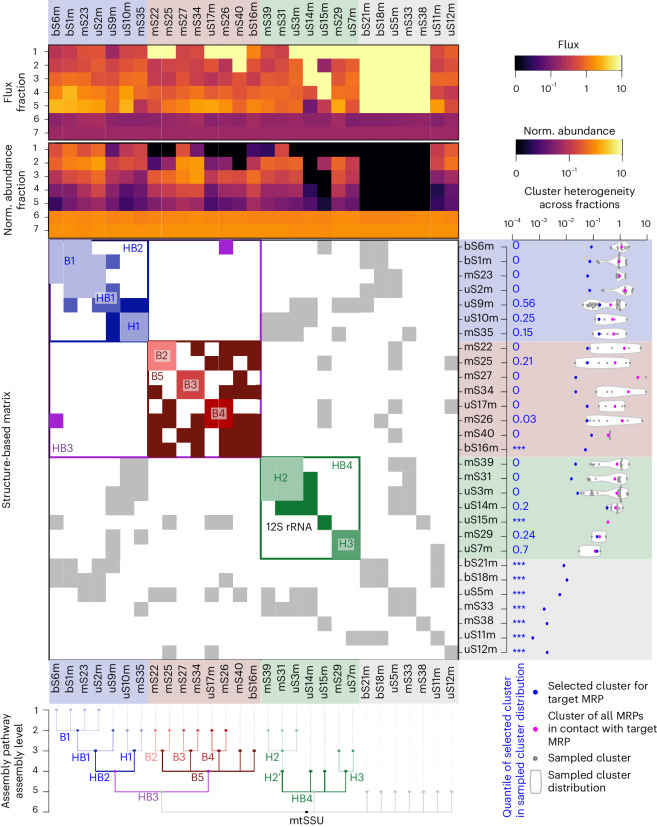
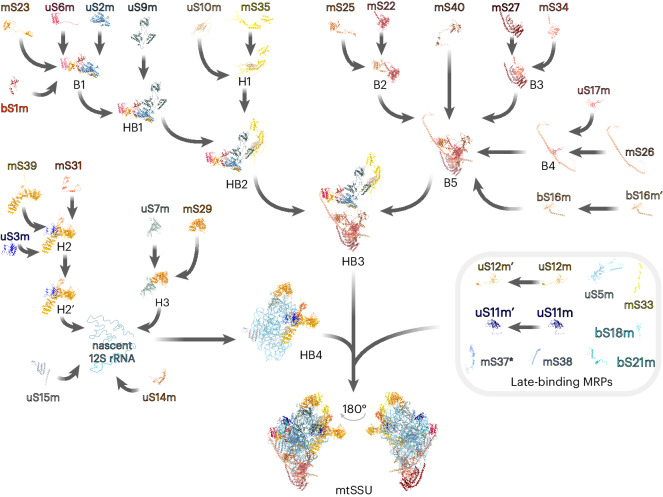
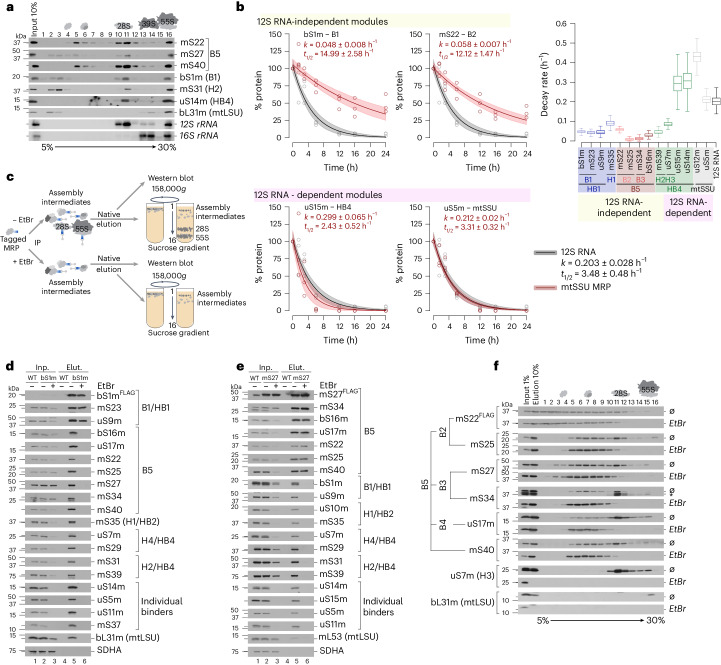
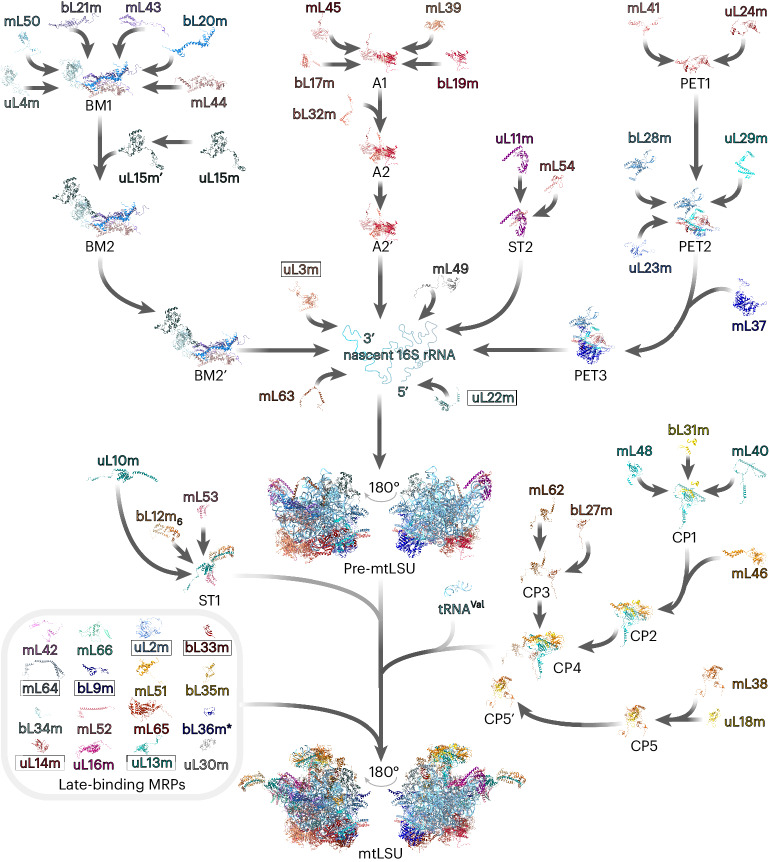
Mitochondria contain dedicated ribosomes (mitoribosomes), which synthesize the mitochondrial-encoded core components of the oxidative phosphorylation complexes. The RNA and protein components of mitoribosomes are encoded on two different genomes (mitochondrial and nuclear) and are assembled into functional complexes with the help of dedicated factors inside the organelle. Defects in mitoribosome biogenesis are associated with severe human diseases, yet the molecular pathway of mitoribosome assembly remains poorly understood. Here, we applied a multidisciplinary approach combining biochemical isolation and analysis of native mitoribosomal assembly complexes with quantitative mass spectrometry and mathematical modeling to reconstitute the entire assembly pathway of the human mitoribosome. We show that, in contrast to its bacterial and cytosolic counterparts, human mitoribosome biogenesis involves the formation of ribosomal protein-only modules, which then assemble on the appropriate ribosomal RNA moiety in a coordinated fashion. The presence of excess protein-only modules primed for assembly rationalizes how mitochondria cope with the challenge of forming a protein-rich ribonucleoprotein complex of dual genetic origin. This study provides a comprehensive roadmap of mitoribosome biogenesis, from very early to late maturation steps, and highlights the evolutionary divergence from its bacterial ancestor.


Conflict of interest statement

Competing interests: The authors declare no competing interests.

Figures

Fig. 1
Fig. 1. Triple-SILAC experimental design and data analysis summary.
a, Overview of the experimental workflow. HEK293 cells were pulse-labeled with H amino acids (Arg-10 and Lys-8; red) and then chased with M amino acids (Arg-6 and Lys-4; green) for indicated time intervals. Mitoribosomal complexes were separated by sucrose gradient ultracentrifugation (low-resolution’ gradient, 79,000g for 15 h). Isolated fractions were spiked with an L standard (isolated 55S mitoribosomes, blue; Arg-0 and Lys-0) and analyzed by LC–MS/MS (n = 3). b, Schematic of the data analysis workflow to reconstruct mtSSU and mtLSU assembly pathways. Illustrated are all essential steps with references to more detailed figures. IP, immunoprecipitation; KO, knockout. c, Normalized MRP steady-state abundance across sucrose gradient fractions. Normalized protein abundance is indicated as a range from black (zero) to light yellow (maximal value). MRPs are arranged on the basis of a hierarchical clustering of abundances across all sucrose gradient fractions. AF, mitoribosome assembly factor; MAF, mitoribosome-associated factor. Source data
Fig. 2
Fig. 2. Cluster analysis of mtSSU assembly pathway.
Top, the fluxes and normalized steady-state abundances of all MRPs are shown as a heat map. The mtSSU MRPs are aligned according to their clusters. Center, contact matrix showing all pairwise MRP contacts derived from the known structure of the assembled mtSSU, colored according to their assigned assembly module. Right, cluster heterogeneity for each target MRP indicated as blue dots and compared to the heterogeneity of all possible clusters based only on contact matrix constraints (gray dots and violin plots). Blue numbers define the quantile of the selected target cluster (blue dot) within the alternative cluster distribution, where 0 indicates that the selected target cluster has the lowest heterogeneity and *** indicates the absence of alternative clusters. The resulting assembly pathway is shown as a dendrogram with indicated assembly levels for all MRPs and mtSSU modules. Source data
Fig. 3
Fig. 3. Reconstructed in vivo pathway of the mtSSU assembly.
The biogenesis of the 28S mtSSU involves the sequential incorporation of preassembled MRP clusters to the 12S rRNA moieties. Eight MRPs bind to the maturing mtSSU as individual proteins in the final stages of assembly to fine-tune established biogenesis intermediates. H, mtSSU head; B, mtSSU body; HB, mtSSU head–body assembly module. The prime symbol indicates differences in the kinetic properties of the MRPs and assembly module with the identical MRP composition. *Although not continuously detected in our data set, mS37 presents the last assembling MRP according to structural analysis of late mtSSU assembly intermediates.
Fig. 4
Fig. 4. Formation of assembly modules is independent of the presence of rRNA.
a, rRNA and MRP distribution across sucrose gradient fractions. Mitoribosome complexes were isolated from HEK293 wild-type cells and separated by sucrose gradient ultracentrifugation (high-resolution gradient, 158,000g, 15 h). MRP distribution across fractions was detected by western blotting with indicated antibodies. RNA was isolated from collected fractions and analyzed by northern blotting using probes against mtRNR1 (12S rRNA) and mtRNR2 (16S rRNA). b, MRP turnover upon repression of mt-rRNA synthesis by ethidium bromide (EtBr). Plotted are the relative MRP (red) and 12S rRNA (gray) abundance at indicated time points after treatment as a percentage of the starting abundance (time point, 0 h). Solid lines indicate the median and shaded areas indicate the 5th and 95th percentiles of model fits using n = 3 biological replicates. Right, the decay of 12S rRNA-independent versus 12S rRNA-dependent assembly modules or individual MRPs (Supplementary Fig. 7). t1/2, half-life; k, decay rate. Box plots indicate the median, first quartile, third quartile and minimum and maximum after outlier removal. c, Experimental setup for validation of rRNA-independent nature of MRP assembly modules. d,e, Immunoisolation of assembly modules using FLAG-tagged constituents bS1m (d) and mS27 (e) in the absence of rRNA (with EtBr). f, Formation of the B5 assembly module in the absence of rRNA. B5 was isolated using FLAG-tagged mS22 in the presence (Ø) or absence (with EtBr) of 12S rRNA and separated by sucrose gradient ultracentrifugation. Source data
Fig. 5
Fig. 5. Reconstructed in vivo pathway of the mtLSU assembly.
The biogenesis of the 39S mtLSU entails a stepwise association of preassembled MRP clusters with the 16S rRNA elements. uL22m and uL3m bind the 5′ and 3′ ends of the 16S rRNA, respectively, to launch domain compaction and mtLSU assembly. During the late stages of assembly, a set of MRPs attach to the maturing mtLSU as discrete proteins, refining already established biogenesis intermediates. The prime symbol indicates differences in the kinetic properties of the MRPs and assembly modules with the identical MRP composition. Boxed MRPs were detected in the low-density gradient fraction but not involved in the MRP assembly modules. *bL36m was placed as a late-assembling protein according to previous studies, but was not continuously detected during our MS analysis. uL1m is not included in the assembly scheme as it was not resolved in the mitoribosome structure used for the pathway reconstruction (PDB 6ZM6).
Extended Data Fig. 1
Extended Data Fig. 1. Global intracellular turnover of MRPs and mitoribosome assembly factors.
a, Triple SILAC approach. HEK293 cells were pulse labelled with ‘heavy’ amino acids (red) and then first chased with ‘medium’ amino acids (green) for 12 h, followed by a second chase with ‘light’ labelled amino acids (blue) for indicated time intervals (0h-24h). Samples were then analyzed by MS. b, Schematics of the employed models. In the one-state-model proteins are produced with rate p and degraded with rate ka. In the two-state-model proteins are also transferred from state A to state B with rate kab and proteins in state B are degraded with rate kb. c, d, Raw mass spectrometry data, model fits of normalized data and posterior distribution of model parameters of protein uS2m (as example) in whole cell lysate (c) and isolated mitochondria (d). Time points 0 and 24 are omitted from modelling for their inconsistency with other time points (Methods: Protein turnover estimation – no sucrose gradient). State A (in two-state-model) represents transient state with faster turn-over while state B is more stable (based on the values of ka, kab and kb). This allows the model to have different short-term and long-term dynamics. See medium and light isotopes of two-state-model in early vs late time-points. Solid lines indicate median and shaded areas indicate 5%-ile and 95%-ile of model fits. Boxplots indicate median, 1st quartile, 3rd quartile, as well as minimum and maximum after outlier removal. e, f, Global distribution (across protein groups) of parameters derived from isolated mitochondria (e) and whole cell lysate (f). In (cf) n = 3 biological replicates were used for parameter estimation. Source data
Extended Data Fig. 2
Extended Data Fig. 2. Clustering of mtSSU assembly modules.
Left-hand panel: schematic representation of the mtSSU assembly modules and their position in the mature mtSSU (PDB: 6zm6). Right-hand panel: clustering reveals 12 distinct mtSSU assembly modules. Shown are violin plots illustrating the distribution of estimated fluxes and abundances over mtSSU MRPs that are grouped into the same assembly module depending on the sucrose gradient fraction they were detected in. Arrows indicate the further assembly direction of a submodule. Color labels correspond to left panel. H – mtSSU head; B – mtSSU body; HB – mtSSU head-body assembly module. Source data
Extended Data Fig. 3
Extended Data Fig. 3. Biochemical validation of mtSSU assembly modules.
a-c, and e-f, The composition of the B5 (a-c), HB1 (e), and H1 (f) mtSSU assembly clusters. Mitoribosomal complexes were immuno-isolated via FLAG-tagged constituents mS27 (a), mS25 (b), mS40 (c), bS1m (e), and uS10m (f) and separated by sucrose gradient centrifugation. d, g, Sucrose gradient sedimentation analysis of mitoribosomal complexes in mS40 (d) or uS7m (g) deficient cells. H – mtSSU head; B – mtSSU body; HB – mtSSU head-body assembly module. Source data
Extended Data Fig. 4
Extended Data Fig. 4. Kinetics of mtSSU assembly pathway.
a, Overview of mtSSU kinetic modelling and sensitivity analysis. The kinetic model consists of four reactions for each MRP: supply (sup) and turnover (k) rates indicating transport of MRPs into mitochondria and removal of MRPs from mitochondria (MRP recycling), binding (on) and unbinding (off) rates indicating incorporation of MRPs into complexes (association) and their dissociation. Bayesian inference was employed to estimate the most likely values for each kinetic rate in the full model (Methods: mtSSU kinetic modelling). (Solid lines indicate median and shaded areas indicate 5%-ile and 95%-ile of model fits.) Finally, local sensitivity analysis was performed to determine the rates, which have the strongest impact on mtSSU steady state abundance by changing a given rate and simulating the resulting mtSSU steady state abundance. Comparison of resulting mtSSU abundance fold change, allows to detect non-sensitive and sensitive kinetic rates. Latter can be either enhancing or inhibiting rates. b, Fold changes of mtSSU steady state abundance upon increase or decrease of binding and unbinding rates. c, Fold changes of mtSSU steady state abundance upon increase or decrease of supply and degradation rates. d, Hierarchical clustering reveals sensitive and non-sensitive kinetic rates. Shown are the fold changes of mtSSU steady state abundance, indicated as a range from black (minimal value) to light yellow (maximal value), for all kinetic rates. Source data
Extended Data Fig. 5
Extended Data Fig. 5. Cluster analysis of mtLSU assembly pathway.
Fluxes and normalized steady state abundances of all MRPs are shown as heatmap (top). mtLSU MRPs are aligned according to their clusters. The contact matrix in the center shows all pairwise MRP contacts derived from the known structure of the assembled mtLSU, colored according to their assigned assembly module. Cluster heterogeneity is indicated (right panel) for each target MRP as blue dots and compared to the heterogeneity of all possible clusters based only on contact matrix constraints (grey dots and violin plots). Blue indicated numbers define the quantile of the selected target cluster (blue dot) within the alternative cluster distribution, where 0 indicates that the selected target cluster has the lowest heterogeneity and *** indicates absence of alternative clusters. The resulting assembly pathway is shown as dendrogram with indicated assembly levels for all MRPs and mtLSU modules. Source data
Extended Data Fig. 6
Extended Data Fig. 6. Cluster analysis of mtLSU assembly modules.
Left-hand panel: schematic representation of the mtLSU assembly modules and their position in the mature mtLSU (PDB: 6zm6). Right-hand panel: clustering reveals 15 distinct mtLSU assembly modules. Violin plots illustrate the distribution of estimated fluxes and abundances over mtLSU MRPs that are grouped into the same assembly module depending on the sucrose gradient fraction they were detected in. Arrows indicate the further assembly direction of a submodule. Color labels correspond to left panel. ST – L7/L12 stalk; CP – central protuberance; PET – polypeptide exit tunnel; A – mitoribosome membrane anchor; BM – central body assembly module. Source data
Extended Data Fig. 7
Extended Data Fig. 7. Assembly of the central protuberance.
a, Formation of the CP assembly module upon 16 S mt-rRNA depletion caused by ethidium bromide (EtBr) treatment; non-treated cell line (Ø) serves as a control. Mitoribosomal complexes were immuno-isolated via FLAG-tagged CP constituent mL62 and separated by sucrose gradient ultracentrifugation. Upper panel indicates the position of the CP4 and CP5 assembly modules in the mature mtLSU (PDB: 6zm6). b, The composition of the CP2 assembly cluster. Mitoribosomal complexes were immuno-isolated via FLAG-tagged CP constituent bL31m and separated by sucrose gradient centrifugation. c, Formation of the CP cluster upon rRNA depletion. Mitoribosomal complexes isolated from ethidium bromide-treated (EtBr) or untreated cells (Ø) were separated by sucrose gradient ultracentrifugation. d, Sucrose gradient sedimentation of the mitoribosomal complexes formed in the absence of mL62. e, Mitochondrial translation in mL62-deficient cells was monitored by de novo incorporation of [35S]Methionine and visualized by autoradiography. ST – L7/L12 stalk; CP – central protuberance; PET – polypeptide exit tunnel; A – mitoribosome membrane anchor; BM – central body assembly module. Source data
Extended Data Fig. 8
Extended Data Fig. 8. Assembly of the L7/L12 stalk.
a-c, The composition of the ST assembly cluster. Mitoribosomal complexes were immuno-isolated via FLAG-tagged ST constituents uL11m (a), bL12m (b) or uL10m (c) and separated by sucrose gradient centrifugation. Left-hand panel in (a) indicates the position of the ST1 and ST2 assembly modules in the mature mtLSU (PDB: 6zm6). d-e, Immunoisolation of ST1 and ST2 assembly modules via FLAG-tagged constituents bL12m (d) and uL11m (e), respectively in the absence of rRNA (EtBr +). f, Formation of the ST cluster upon rRNA depletion. Mitoribosomal complexes isolated from ethidium bromide-treated (EtBr) or untreated cells (Ø) were separated by sucrose gradient ultracentrifugation. ST – L7/L12 stalk; CP – central protuberance; PET – polypeptide exit tunnel; A – mitoribosome membrane anchor; BM – central body assembly module. Source data
Extended Data Fig. 9
Extended Data Fig. 9. Formation of the mitoribosomal central body module.
a, The composition of the BM assembly cluster. Mitoribosomal complexes were immuno-isolated via FLAG-tagged BM constituent mL44 and separated by sucrose gradient centrifugation. Left-hand panel indicates the position of the BM assembly module in the mature mtLSU (PDB: 6zm6). b, Immunoisolation of BM assembly module via FLAG-tagged constituent mL44 in the absence of rRNA (EtBr +). c, Formation of the BM cluster upon rRNA depletion. Mitoribosomal complexes isolated from ethidium bromide-treated (EtBr) or untreated cells (Ø) were separated by sucrose gradient ultracentrifugation. d, Sucrose gradient sedimentation analysis of mitoribosomal complexes formed in cell lines deficient for uL4m, bL20m or mL44. ST – L7/L12 stalk; CP – central protuberance; PET – polypeptide exit tunnel; A – mitoribosome membrane anchor; BM – central body assembly module. Source data
Extended Data Fig. 10
Extended Data Fig. 10. Biogenesis of the mitoribosome anchor and polypeptide exit tunnel modules.
a, The composition of the A assembly cluster. Mitoribosomal complexes were immuno-isolated via FLAG-tagged A constituent mL39 and separated by sucrose gradient centrifugation. mtSSU constituent uS7m serves as a negative control. Upper panel indicates the position of the A module in the mature mtLSU (PDB: 6zm6). b, Formation of the A cluster upon rRNA depletion. Mitoribosomal complexes isolated from ethidium bromide-treated (EtBr) or untreated cells (Ø) were separated by sucrose gradient ultracentrifugation. c, Sucrose gradient sedimentation analysis of mitoribosome complexes in mL45-deficient cells. d, Formation of the PET cluster upon rRNA depletion was assessed as in b. Upper panel indicates the position of the PET assembly module in the mature mtLSU (PDB: 6zm6). e, Sucrose gradient sedimentation analysis of the MRPs which assemble into the mtLSU individually. ST – L7/L12 stalk; CP – central protuberance; PET – polypeptide exit tunnel; A – mitoribosome membrane anchor; BM – central body assembly module. Source data

References

    1. Amunts, A., Brown, A., Toots, J., Scheres, S. H. W. & Ramakrishnan, V. The structure of the human mitochondrial ribosome. Science348, 95–98 (2015). - PMC - PubMed
    1. Greber, B. J. et al. The complete structure of the 55S mammalian mitochondrial ribosome. Science348, 303–308 (2015). - PubMed
    1. Hilander, T., Jackson, C. B., Robciuc, M., Bashir, T. & Zhao, H. The roles of assembly factors in mammalian mitoribosome biogenesis. Mitochondrion60, 70–84 (2021). - PubMed
    1. Maiti, P., Lavdovskaia, E., Barrientos, A. & Richter-Dennerlein, R. Role of GTPases in driving mitoribosome assembly. Trends Cell Biol.31, 284–297 (2021). - PMC - PubMed
    1. Lavdovskaia, E., Hillen, H. S. & Richter-Dennerlein, R. Hierarchical folding of the catalytic core during mitochondrial ribosome biogenesis. Trends Cell Biol.32, 182–185 (2021). - PubMed

MeSH terms

LinkOut - more resources