

A visual marker for early atrophy of the supraspinatus muscle on conventional MRI: introduction of the blackbird sign
- PMID: 38992107
- PMCID: PMC11632038
- DOI: 10.1007/s00330-024-10946-7
A visual marker for early atrophy of the supraspinatus muscle on conventional MRI: introduction of the blackbird sign
Abstract
Objectives: The aim of this study was to introduce the blackbird sign as a fast, qualitative measure of early supraspinatus (SSP) muscle atrophy and to correlate the sign with quantitatively assessed muscle volume and intramuscular fat fraction (FF) in patients with full-thickness SSP tears.
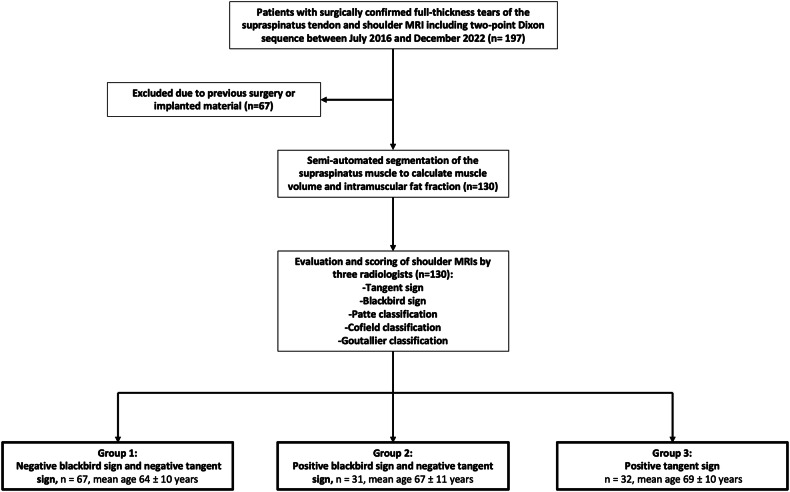
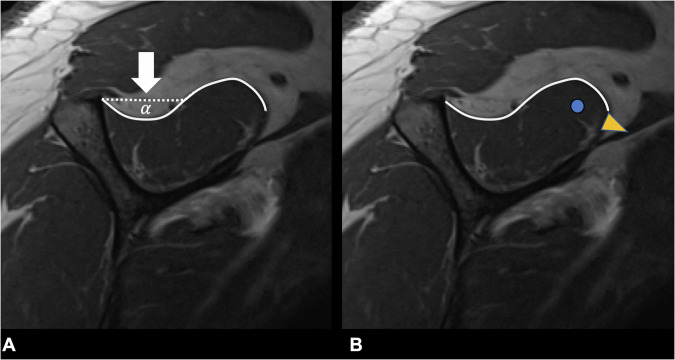
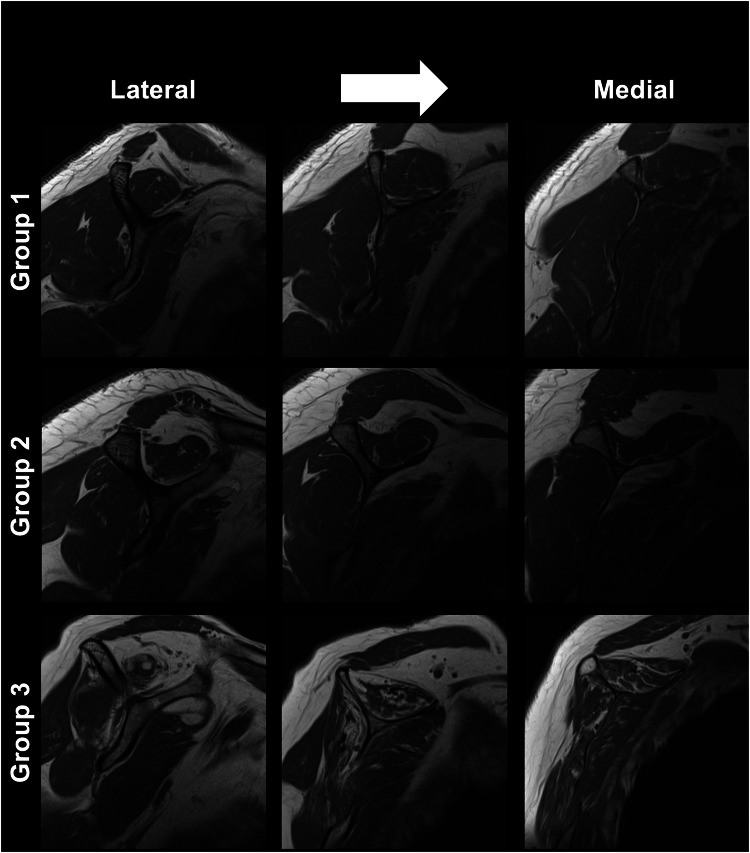
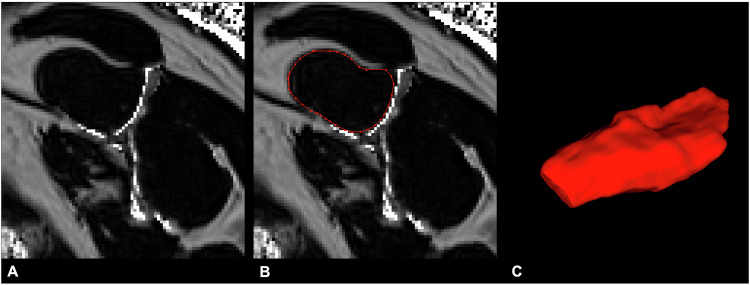
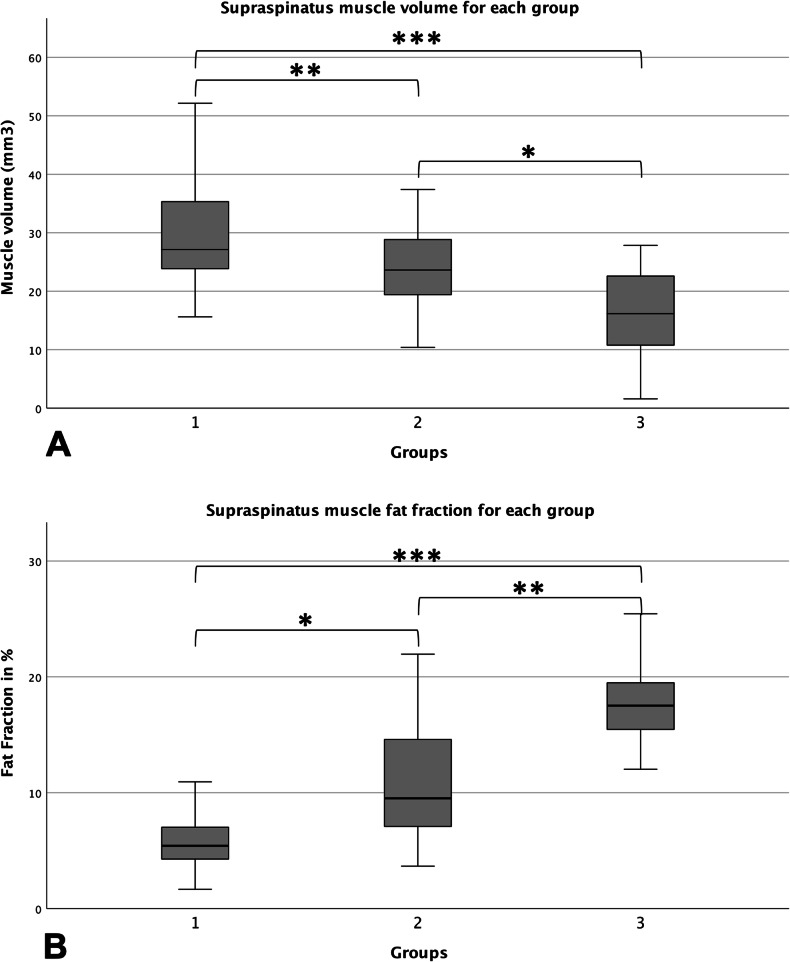
Materials and methods: The blackbird sign describes the asymmetric pattern of early SSP atrophy: on sagittal MR images, the supero-posterior contour of the muscle becomes concave, resembling the shape of a blackbird. MRIs of patients with full-thickness SSP tears were retrospectively reviewed for the presence of the blackbird and tangent signs. Patients were then divided into group 1: negative tangent sign and negative blackbird sign (n = 67), group 2: negative tangent sign and positive blackbird sign (n = 31), and group 3: positive tangent sign (n = 32). A 2-point Dixon sequence was acquired in all patients from which quantitative FF and muscle volumes were calculated.
Results: In total 130 patients (mean age 67 ± 11 years) were included. Mean SSP volume was significantly smaller in group 3 (15.8 ± 8.1 cm3) compared to group 2 (23.9 ± 7.0 cm3, p = 0.01) and group 1 (29.7 ± 9.1 cm3, p < 0.01). Significantly lower muscle volumes were also found in group 2 compared to group 1 (p = 0.02), confirming that the blackbird sign is able to identify early SSP atrophy. Mean FF in the SSP was significantly higher in group 3 (18.5 ± 4.4%) compared to group 2 (10.9 ± 4.7%, p < 0.01) and group 1 (6.1 ± 2.6%, p < 0.01).
Conclusion: Visual assessment of early muscle atrophy of the SSP is feasible and reproducible using the blackbird sign, allowing the diagnosis of early SSP atrophy.
Clinical relevance statement: In routine clinical practice, the blackbird sign may be a useful tool for assessing early muscle degeneration before the risk of postoperative rotator cuff re-tears increases with progressive muscle atrophy and fatty infiltration.
Key points: Quantitative measurements of rotator cuff injuries require time, limiting clinical practicality. The proposed blackbird sign is able to identify early SSP atrophy. Reader agreement for the blackbird sign was substantial, demonstrating reproducibility and ease of implementation in the clinical routine.
Keywords: Magnetic resonance imaging; Muscular atrophy; Rotator cuff.
© 2024. The Author(s).
Conflict of interest statement
Compliance with ethical standards. Guarantor: The scientific guarantor of this publication is Georg C. Feuerriegel. Conflict of interest: Balgrist University Hospital has an academic research agreement with Siemens Healthineers. Statistics and biometry: No complex statistical methods were necessary for this paper. Informed consent: Written informed consent was obtained from all subjects (patients) in this study. Ethical approval: Institutional Review Board approval was obtained. Study subjects or cohorts overlap: None. Methodology: Retrospective Observational Performed at one institution
Figures
Similar articles
-
Three-dimensional quantitative measurements of atrophy and fat infiltration in sub-regions of the supraspinatus muscle show heterogeneous distributions: a cadaveric study.Arch Orthop Trauma Surg. 2022 Jul;142(7):1395-1403. doi: 10.1007/s00402-021-03765-8. Epub 2021 Jan 23. Arch Orthop Trauma Surg. 2022. PMID: 33484308
-
Advantages of 3-dimensional Measurements for Supraspinatus Intramuscular Fatty Evaluation in Patients With Medium to Massive Rotator Cuff Tears: Comparison With a Single Sagittal Slice.Am J Sports Med. 2022 Mar;50(3):699-707. doi: 10.1177/03635465211068854. Epub 2022 Jan 19. Am J Sports Med. 2022. PMID: 35044262
-
MRI-based 3-dimensional volumetric assessment of fatty infiltration and muscle atrophy in rotator cuff tears.J Shoulder Elbow Surg. 2022 Jun;31(6):1272-1281. doi: 10.1016/j.jse.2021.12.037. Epub 2022 Jan 31. J Shoulder Elbow Surg. 2022. PMID: 35101606
-
Efficacy of Imaging Modalities Assessing Fatty Infiltration in Rotator Cuff Tears.JBJS Rev. 2019 Apr;7(4):e3. doi: 10.2106/JBJS.RVW.18.00042. JBJS Rev. 2019. PMID: 30969180
-
Assessment of the Rotator Cuff Muscles: State-of-the-Art MRI and Clinical Implications.Radiology. 2025 May;315(2):e242131. doi: 10.1148/radiol.242131. Radiology. 2025. PMID: 40326869 Review.
Cited by
-
Assessment of calf muscle constitution in chronic Achilles tendon disease using Dixon-based MRI.Skeletal Radiol. 2025 Jul;54(7):1457-1468. doi: 10.1007/s00256-024-04845-7. Epub 2024 Dec 11. Skeletal Radiol. 2025. PMID: 39661156 Free PMC article.
References
-
- Williams GR Jr, Rockwood CA Jr, Bigliani LU et al (2004) Rotator cuff tears: Why do we repair them? J Bone Joint Surg Am 86:2764–2776 - PubMed
-
- Melis B, Nemoz C, Walch G (2009) Muscle fatty infiltration in rotator cuff tears: descriptive analysis of 1688 cases. Orthop Traumatol Surg Res 95:319–324 - PubMed
-
- McElvany MD, McGoldrick E, Gee AO et al (2015) Rotator cuff repair: published evidence on factors associated with repair integrity and clinical outcome. Am J Sports Med 43:491–500 - PubMed
-
- Fuchs B, Gilbart MK, Hodler J et al (2006) Clinical and structural results of open repair of an isolated one-tendon tear of the rotator cuff. J Bone Joint Surg Am 88:309–316 - PubMed
MeSH terms
LinkOut - more resources
Full Text Sources
Medical
