Randomized Controlled Trial
. 2024 Oct;30(10):2867-2877.
doi: 10.1038/s41591-024-03124-1. Epub 2024 Jul 11.

Lipidome changes due to improved dietary fat quality inform cardiometabolic risk reduction and precision nutrition

Affiliations
Randomized Controlled Trial

Lipidome changes due to improved dietary fat quality inform cardiometabolic risk reduction and precision nutrition

Fabian Eichelmann et al. Nat Med. 2024 Oct.

Abstract

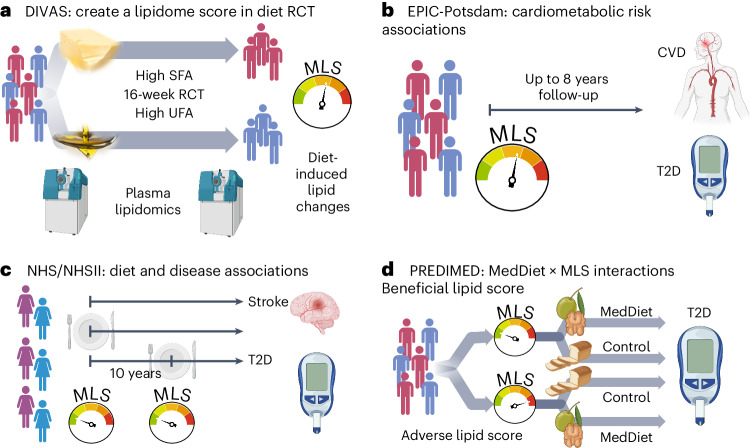
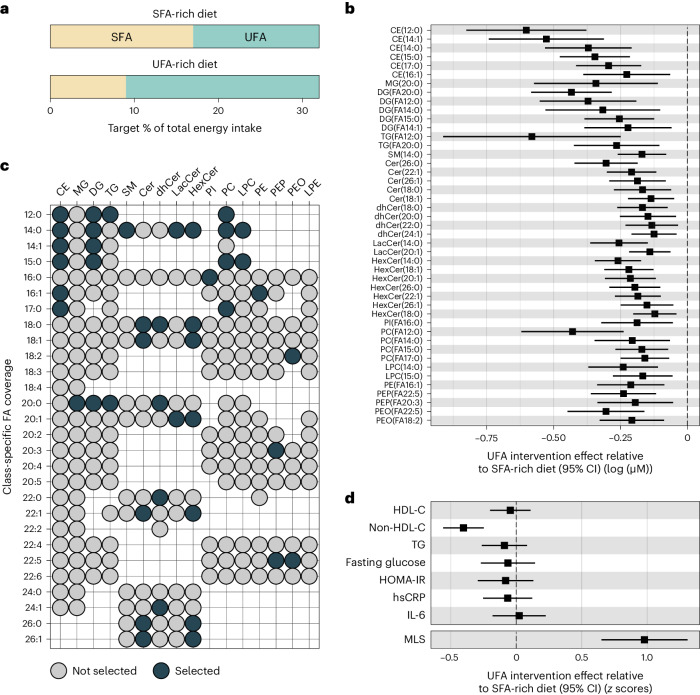
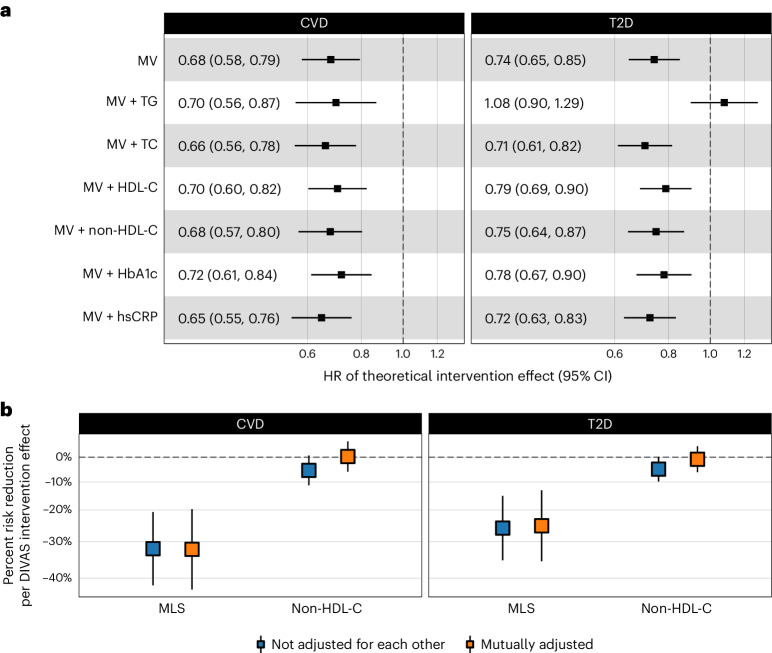
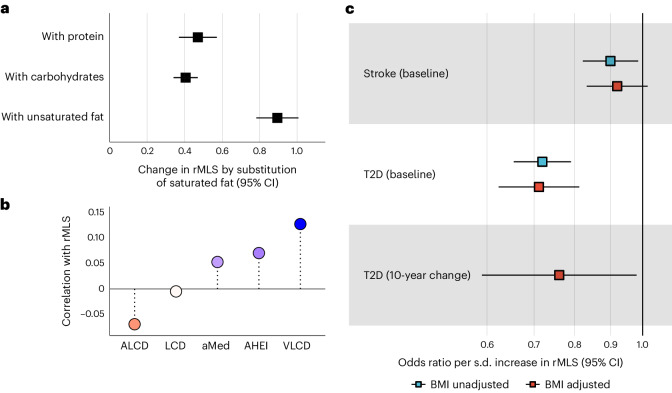
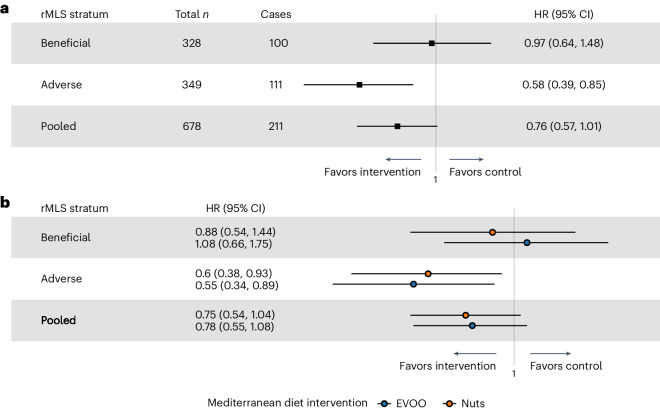
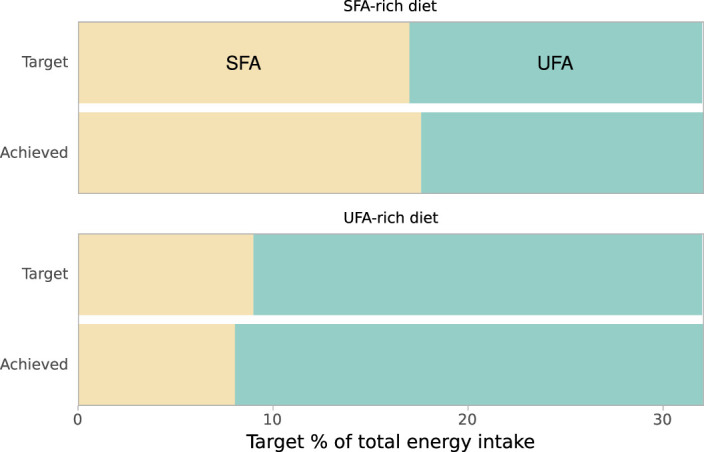
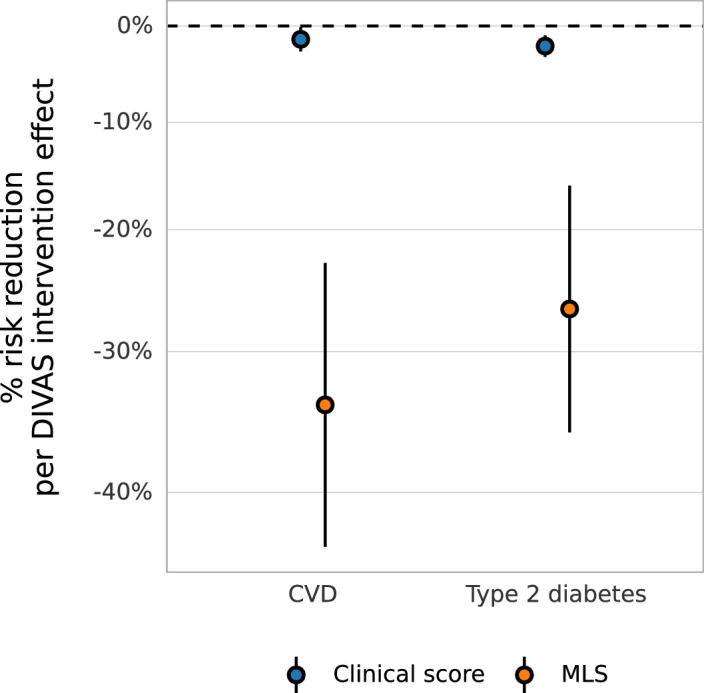
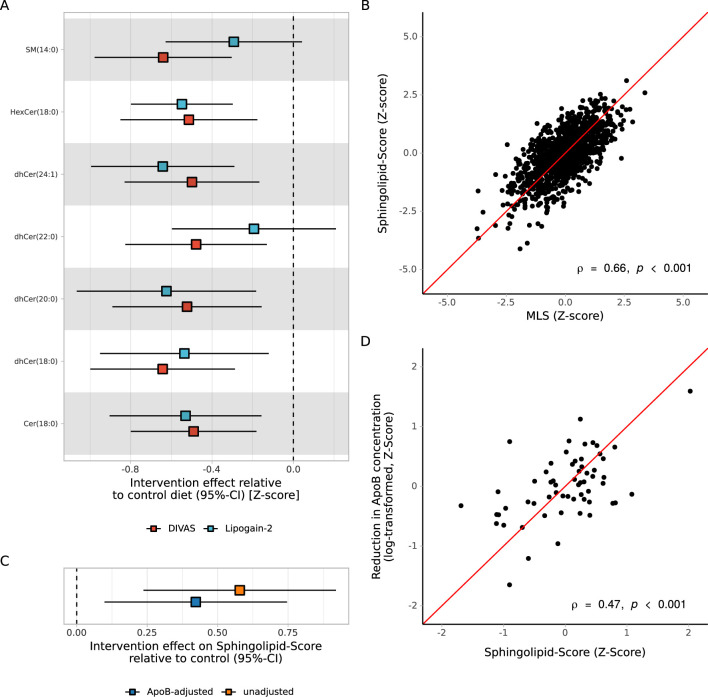
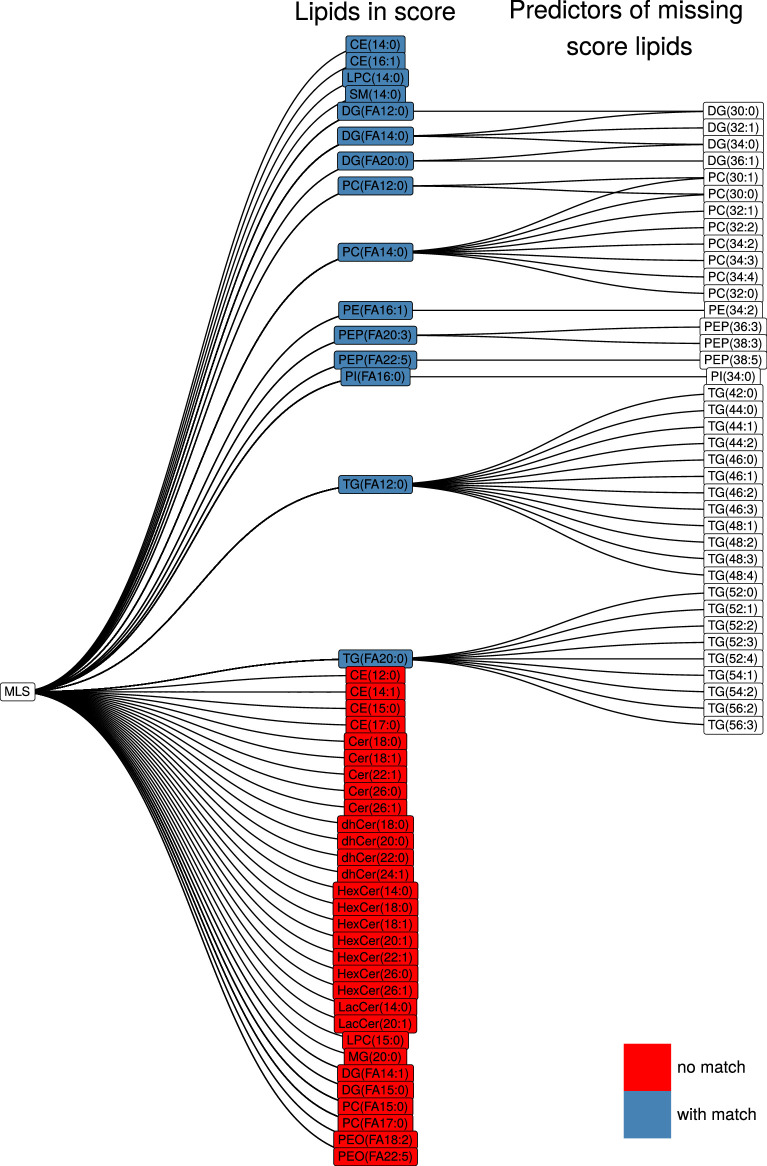
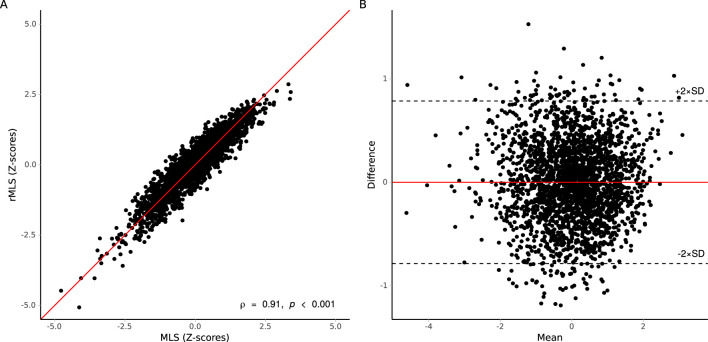
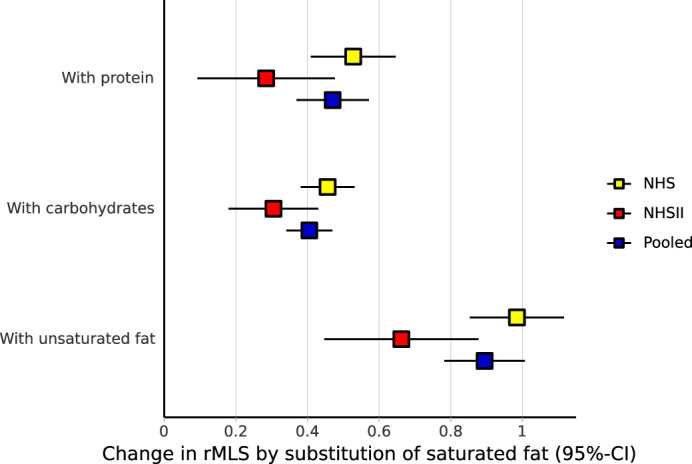
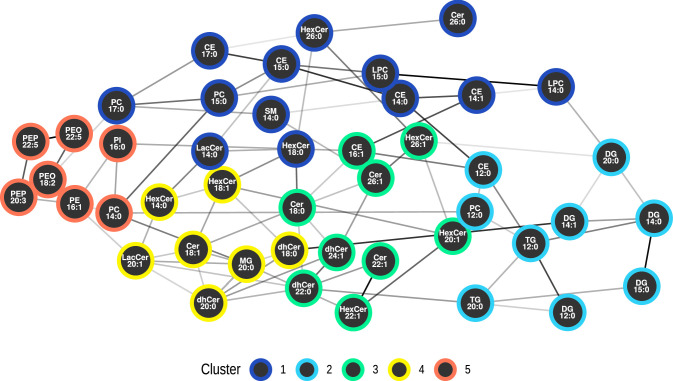
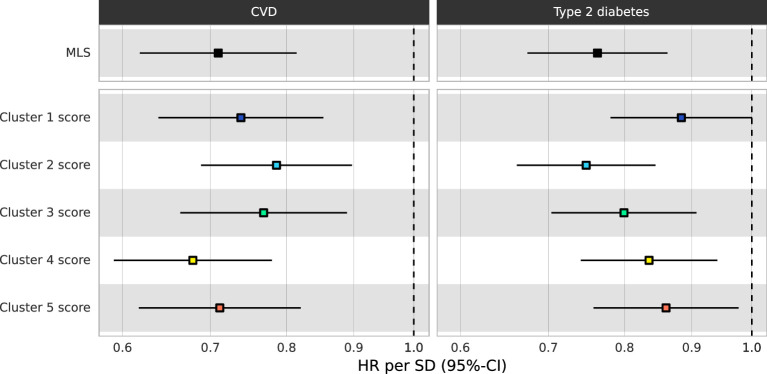
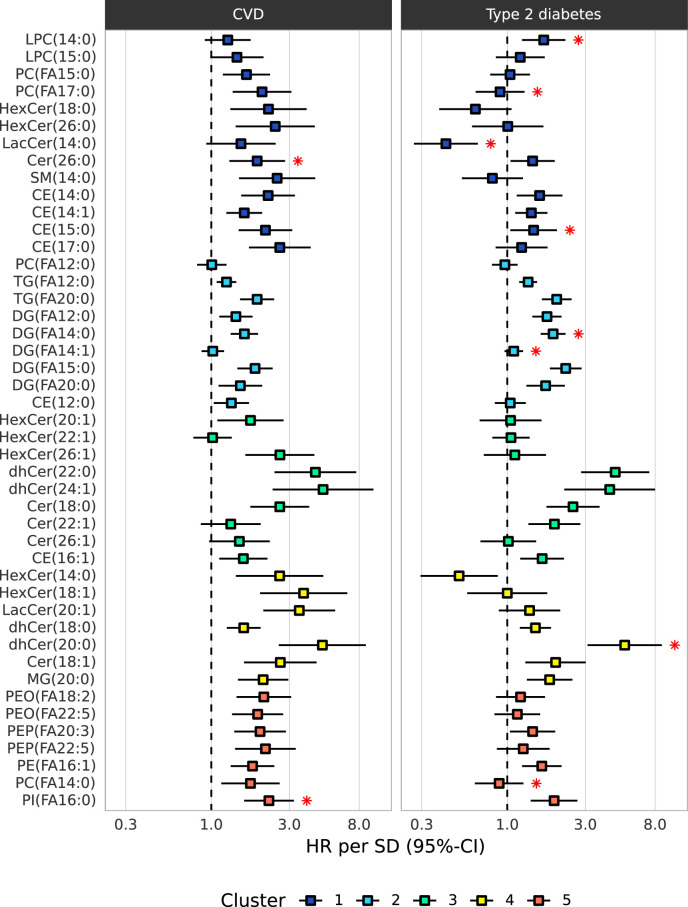
Current cardiometabolic disease prevention guidelines recommend increasing dietary unsaturated fat intake while reducing saturated fats. Here we use lipidomics data from a randomized controlled dietary intervention trial to construct a multilipid score (MLS), summarizing the effects of replacing saturated fat with unsaturated fat on 45 lipid metabolite concentrations. In the EPIC-Potsdam cohort, a difference in the MLS, reflecting better dietary fat quality, was associated with a significant reduction in the incidence of cardiovascular disease (-32%; 95% confidence interval (95% CI): -21% to -42%) and type 2 diabetes (-26%; 95% CI: -15% to -35%). We built a closely correlated simplified score, reduced MLS (rMLS), and observed that beneficial rMLS changes, suggesting improved dietary fat quality over 10 years, were associated with lower diabetes risk (odds ratio per standard deviation of 0.76; 95% CI: 0.59 to 0.98) in the Nurses' Health Study. Furthermore, in the PREDIMED trial, an olive oil-rich Mediterranean diet intervention primarily reduced diabetes incidence among participants with unfavorable preintervention rMLS levels, suggestive of disturbed lipid metabolism before intervention. Our findings indicate that the effects of dietary fat quality on the lipidome can contribute to a more precise understanding and possible prediction of the health outcomes of specific dietary fat modifications.


Conflict of interest statement

J.S.S. received grants through his institution and support for attending meetings/travel from the Nut and Dried Fruit Foundation. He is a nonpaid member of the Scientific Committee of the Nut and Dried fruit Foundation and the Scientific Committee of Danone Institute International and was a member of the Executive Committee of Danone Institute Spain. He received personal fees for serving as a Member of the Institute Danone Spain Advisory Board. J.A.L. was Deputy Chair of the UK Government’s Scientific Advisory Committee on Nutrition (SACN) and SACN’s Saturated Fat Working Group (2015–2019). C.W. has contributed to a precision nutrition seminar for the research and development department of Barilla G. e R. Fratelli S.p.A. (2023). The other authors declare no competing interests.

Figures

Fig. 1
Fig. 1. Study design.
a, DIVAS trial. First, we use the DIVAS trial to generate an MLS of controlled unsaturated-for-saturated fat substitution. b, EPIC-Potsdam cohort. Second, we reconstruct the MLS and use it as a surrogate marker to estimate the expected cardiometabolic risk effects of the DIVAS intervention diet. c, NHS/NHSII cohorts. Third, we construct a highly correlated rMLS based on another lipidomics platform and link baseline levels and 10-year changes of this rMLS to cardiometabolic disease risk. d, PREDIMED trial. Fourth, we examine potential differences in the Mediterranean diet intervention effect on T2D risk across participants with different preintervention rMLS levels (effect modification). Figure created with BioRender.com.
Fig. 2
Fig. 2. Deriving an MLS of modified dietary fatty acid composition in the DIVAS trial and benchmarking against established risk biomarkers.
a, Target percentage of total energy intake from SFA and UFA sources per intervention arm. b, Effect of UFA-rich diet interventions relative to the SFA-rich diet on lipid concentrations (n = 113) modeled as postintervention concentration differences (95% CI) between SFA- and UFA-rich diets adjusting for baseline concentration, age, BMI and sex. Only statistically significantly changed lipids (FDR < 0.05) are shown. The center indicates the β-coefficient, and whiskers indicate 95% CIs. c, Selected lipids (FDR < 0.05) for the MLS calculation according to lipid class and fatty acid. d, Effect of UFA-rich diet interventions relative to the SFA-rich diet on MLS and established risk biomarkers (n = 113). MLS was calculated as weighted sum. Observed intervention effects served as weights. For comparison, MLS and risk biomarkers were variance standardized (unit = 1 s.d.). Data were modeled as postintervention score or concentration differences between SFA- and UFA-rich diets adjusting for baseline score level or concentration, age, BMI and sex. Results for established risk markers were originally published in Vafeiadou et al.. The center indicates the β-coefficient, and the whiskers indicate the 95% CI. FA, fatty acid; TG, triglycerides; HOMA-IR, homeostatic model assessment for insulin resistance; IL-6, interleukin-6; hsCRP, high-sensitivity C-reactive protein. Source data
Fig. 3
Fig. 3. Distribution and correlations of the MLS in the EPIC-Potsdam subcohort.
a, Univariate distribution of the MLS (n = 1,148). b, Distribution of the MLS in men (n = 438) and women (n = 710). The center line indicates the median, hinges indicate the first and third quartiles, and whiskers indicate the median ± 1.5 × interquartile range. c, Spearman correlation of the MLS with age, anthropometry, blood pressure and standard clinical biomarkers. d, Spearman correlation of the MLS with self-reported habitual intake of different food groups. Highlighted are the strongest positively (margarine) and negatively (butter) correlated foods. BP, blood pressure; TC, total cholesterol. Source data
Fig. 4
Fig. 4. Association of the MLS with CVD and T2D incidence in the EPIC-Potsdam cohort.
a, MLS–cardiometabolic disease risk associations in different multivariable-adjusted Cox proportional hazards models adjusted for age, sex, waist circumference, height, leisure-time physical activity, highest achieved education level, fasting status at blood draw, total energy intake, blood pressure (systolic and diastolic), smoking status, alcohol intake, use of antihypertensive medication, lipid-lowering medication and acetylsalicylic acid medication (T2D: n/cases = 1,886/775; CVD: n/cases = 1,671/551). The center indicates the hazard ratio, and the whiskers indicate 95% CI. MV, multivariable adjusted; HR, hazard ratio. b, Comparison of multivariable-adjusted disease risk associations between the MLS and non-HDL-C, which was the only significantly affected standard biomarker in the DIVAS trial. The center indicates the percent risk reduction, and whiskers indicate the 95% CI. Source data
Fig. 5
Fig. 5. Diet and disease association of the rMLS in the NHS cohorts.
a, Change in rMLS by substitution of 8% total energy from saturated fat for isocaloric energy intake from alternative macronutrient sources, that is, protein, carbohydrates or unsaturated fats (n = 10,381). The center indicates the β-coefficient, and whiskers indicate the 95% CI. b, Spearman correlation between established diet scores and rMLS (sample sizes for respective correlations: LCD, n = 6,045; animal-based LCD score (ALCD), n = 6,045; vegetable-based LCD score (VLCD), n = 6,045; aMed, n = 6,593; AHEI, n = 6,370). c, T2D (n case–control pairs = 728) and stroke (n case–control pairs = 336) risk in relation to baseline rMLS levels and 10-year rMLS change (n case–control pairs = 244). Data for change analyses are not available for stroke. The T2D case–control study was matched for age, race, fasting status (all fasted), ethnicity and season of blood collection, and conditional logistic regression models were adjusted for the AHEI, smoking status and subsequently BMI; the stroke case–control study was matched for age, fasting and smoking status, and conditional logistic regression models were adjusted for the AHEI and subsequently BMI. Source data
Fig. 6
Fig. 6. Modification of the effect of Mediterranean diet intervention on T2D by rMLS levels in the PREDIMED trial.
a, Effect of the Mediterranean diet intervention (pooled nuts and extra virgin olive oil-rich arms) versus a control diet on T2D risk in the PREDIMED trial across preintervention rMLS strata (n = 687). b, Comparison of the effects of a tree nuts-rich Mediterranean diet intervention and an extra virgin olive oil-rich Mediterranean diet intervention versus a control diet on T2D risk across preintervention rMLS strata. The center indicates the hazard ratio, and whiskers indicate the 95% CI. EVOO, extra virgin olive oil. Source data
Extended Data Fig. 1
Extended Data Fig. 1. Comparison of target versus average achieved SFA and UFA intake in DIVAS.
Achieved SFA and UFA intakes were estimated from 4-day weighed diet diaries collected during the intervention. Source data
Extended Data Fig. 2
Extended Data Fig. 2. Cardiometabolic risk associations of MLS vs a clinical score based on glucose, HDL-C, non-HDL-C, total triglycerides, and hsCRP.
Derivation of clinical score irrespective of prespecified benchmark (FDR < 0.05) used for MLS (n = 113). The clinical score summarizes the nominal effects of the DIVAS diet intervention on HDL-C, non-HDL-C, hsCRP, glucose, and total triglycerides independent of statistical significance. Similar to the MLS, the clinical score was scaled by the observed intervention effect on the clinical score in the DIVAS trial. Source data
Extended Data Fig. 3
Extended Data Fig. 3. Replication of diet effects on a reduced, sphingolipid-based score (Sphingolipid-Score) in the LIPOGAIN-2 trial.
a, Comparison of intervention effects on sphingolipids that are part of the MLS and available in the LIPOGAIN-2 trial (n = 60). Center = beta coefficient, whiskers = 95% confidence interval. b, Scatter plot and Spearman correlation between MLS and Sphingolipid-Score in the EPIC-Potsdam cohort. Two-sided test, p value < 2.2*10−16. c, Observed effect of LIPOGAIN-2 intervention on Sphingolipid-Score (n = 60). The Sphingolipid-Score was scaled by the observed effect in the DIVAS trial, therefore a change in one unit indicates the same effect as observed in DIVAS. Center = beta coefficient, whiskers = 95% confidence interval. d, Scatter plot and Spearman correlation between change in apolipoprotein B and Sphingolipid-Score in the LIPOGAIN-2 trial. Two-sided test, p-value = 0.00015. Shown values are post-intervention levels adjusted for baseline levels, age, sex, BMI, and intervention. Source data
Extended Data Fig. 4
Extended Data Fig. 4. Matching of Metabolon and Broad Institute lipidomics data.
Shown are all lipids that are part of the MLS. Color coding indicates presence or absence in rMLS. In case of no direct match between datasets, where possible we generated predicted concentrations based on available isobaric species level in the EPIC-Potsdam cohort.
Extended Data Fig. 5
Extended Data Fig. 5. Correlation and agreement of MLS and rMLS.
a, Scatter plot of the Spearman correlation between MLS based on Metabolon lipidomics data and rMLS based on lipids that are also available through the Broad Insitute lipidomics platform in the EPIC-Potsdam subcohort (n=1,262). Shown is Spearman correlation, two-sided test, p-value < 2.2*10−16. b, Bland-Altman plot showing the agreement between MLS and rMLS in the EPIC-Potsdam cohort. Source data
Extended Data Fig. 6
Extended Data Fig. 6. Projection of DIVAS targets for dietary UFA-to-SFA ratio and total energy from fats onto the pooled NHS/NHSII study population.
Shown are total energy from fat and dietary UFA-to-SFA ratio of NHS/NHSII cohort participants with metabolomics data (n = 10,381). Source data
Extended Data Fig. 7
Extended Data Fig. 7. Effect of substituting dietary SFA with other macronutrients on rMLS.
Change in rMLS by substitution of 8% total energy from saturated fat for isocaloric energy intake from alternative macronutrient sources, that is, protein, carbohydrates, or unsaturated fats in the Nurses’ Health Study (NHS, n = 7,457) and Nurses’ Health Study II (NHS2, n = 3,412) and the pooled analysis of both cohorts (n = 10,869). Center = beta coefficient, whiskers = 95% confidence interval. Source data
Extended Data Fig. 8
Extended Data Fig. 8. Conditional independence network and clusters of all MLS lipids.
The network was derived using the PC-algorithm in the EPIC-Potsdam subcohort (n = 1,262) based on the lipids in the MLS. The nodes in this network correspond to the UFA-rich diet-affected lipids, and links correspond to correlations between a lipid pair that are robust against adjustment for any subset of other network lipids. Many links in this data-driven network connect lipid metabolites that contain the same fatty acid residual but belong to different lipid classes (for example, C12:0 in cholesteryl esters, phosphatidylcholines, triglycerides, and diglycerides; C18:0 in ceramides and hexosylceramides) or lipids of the same class with metabolically related fatty acid residuals (for example, C20:1 and C22:1 hexosylceramides). Based on this network, we used the Louvain modularity detection algorithm to derive data-driven lipid clusters. Cluster 1 was enriched in odd- and short-chain acyl chain-containing cholesterol esters and phospholipids. Cluster 2 mainly featured di- and triglycerides. Cluster 3 was primarily composed of medium to long-chain fatty acid-containing ceramides (including dihydro-, lactosyl-, and hexosyl-ceramides). Cluster 4 was primarily composed of medium to long-chain fatty acid-containing ceramides (including dihydro-, lactosyl-, and hexosyl-ceramides). Cluster 5 was dominated by phosphatidylethanolamines (including those with ether bonds). Abbreviations – MLS: multi-lipid score; HR, hazard ratio; UFA: unsaturated fatty acids; CVD: cardiovascular disease; T2D: type 2 diabetes. Source data
Extended Data Fig. 9
Extended Data Fig. 9. MLS cluster-specific risk associations in the EPIC-Potsdam cohort.
Multi-variable-adjusted Cox proportional hazards models adjusted for age, sex, waist circumference, height, leisure-time physical activity, highest achieved education level, fasting status at blood draw, total energy intake, blood pressure (systolic and diastolic), smoking status, alcohol intake, use of anti-hypertensive medication, lipid-lowering medication, and acetylsalicylic acid medication. The CVD risk associations were remarkably robust when restricted MLS were constructed based only on lipids from each cluster. The strongest CVD risk association was assessed for the Cluster 4-based MLS, and all cluster-restricted MLS were associated with a substantial and statistically significant CVD risk reduction. The T2D risk associations of the cluster-restricted MLS were also all directionally consistent with a T2D risk reduction related to the UFA-rich diet imprint. The di- and triglyceride-dominated cluster 2 was particularly informative for T2D risk. The T2D risk association of the hexosyl- and lactosyl-ceramide-enriched cluster 1-based MLS was suggestively inverse but not statistically significant. These robust inverse cardiometabolic risk associations of UFA-rich diet imprint in granular lipidomics network clusters suggest that the depth of lipidomics profiling may be more critical than breadth. However, it appears that ceramide and phosphatidylethanolamine metabolites are particularly informative for the link between UFA-rich diets and CVD risk. At the same time, reduced concentrations of medium and long-chain fatty acid-containing di- and triglycerides are critical to linking UFA-rich diets to T2D risk. Center = hazard ratio, whiskers = 95% confidence interval. Abbreviations – MLS: multi-lipid score; HR, hazard ratio; UFA: unsaturated fatty acids; CVD: cardiovascular disease; T2D: type 2 diabetes. Source data
Extended Data Fig. 10
Extended Data Fig. 10. Associations of MLS-contained lipids with cardiometabolic risk in the EPIC-Potsdam cohort.
Associations are derived from multi-variable-adjusted Cox proportional hazards models adjusted for age, sex, waist circumference, height, leisure-time physical activity, highest achieved education level, fasting status at blood draw, total energy intake, blood pressure (systolic and diastolic), smoking status, alcohol intake, use of anti-hypertensive medication, lipid-lowering medication, and acetylsalicylic acid medication. Red asterisks indicate that these lipid-disease associations were robust against adjustment for interrelated diet-affected lipids. Center = hazard ratio, whiskers = 95% confidence interval. Abbreviations – HR: hazard ratio; SD: standard deviation; CVD: cardiovascular disease; T2D, type 2 diabetes. Source data

Similar articles

Cited by

References

    1. Mensah, G. et al. Global burden of cardiovascular diseases and risks, 1990–2022. J. Am. Coll. Cardiol.82, 2350–2473 (2023). - PMC - PubMed
    1. Chatterjee, S., Khunti, K. & Davies, M. J. Type 2 diabetes. Lancet389, 2239–2251 (2017). - PubMed
    1. Zhou, X. et al. Cost-effectiveness of diabetes prevention interventions targeting high-risk individuals and whole populations: a systematic review. Diabetes Care43, 1593–1616 (2020). - PubMed
    1. Leong, D. P. et al. Reducing the global burden of cardiovascular disease, part 2: prevention and treatment of cardiovascular disease. Circ. Res.121, 695–710 (2017). - PubMed
    1. World Health Organization. Saturated Fatty Acid and Trans-Fatty Acid Intake for Adults and Children: WHO Guideline (World Health Organization, 2023). - PubMed

Publication types

LinkOut - more resources