. 2024 Jul 11;81(1):296.
doi: 10.1007/s00018-024-05338-5.

CD74 is a functional MIF receptor on activated CD4+ T cells

Affiliations

CD74 is a functional MIF receptor on activated CD4+ T cells

Lin Zhang et al. Cell Mol Life Sci. .

Abstract

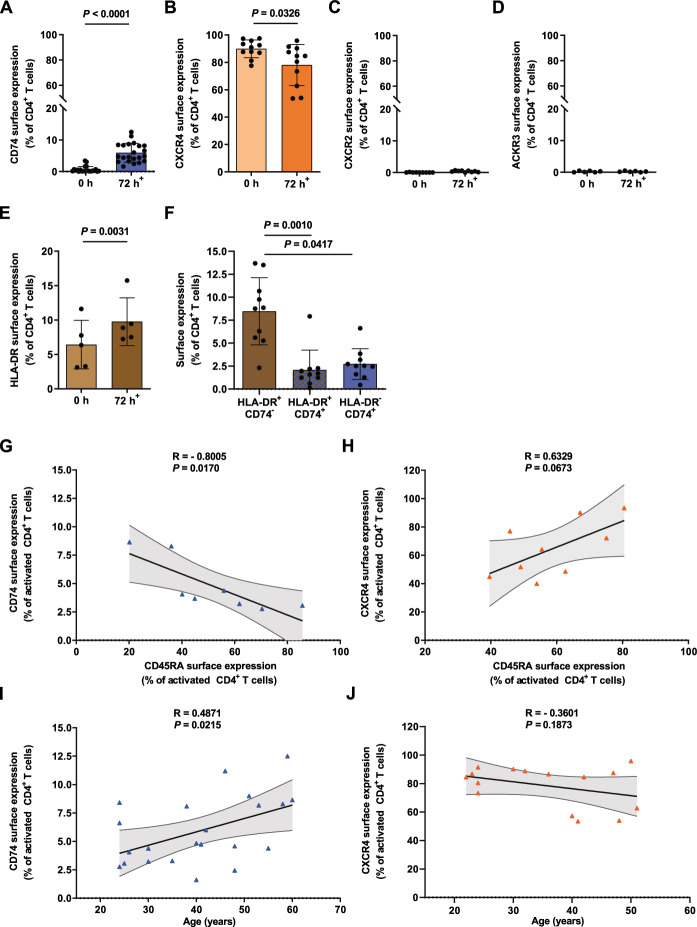
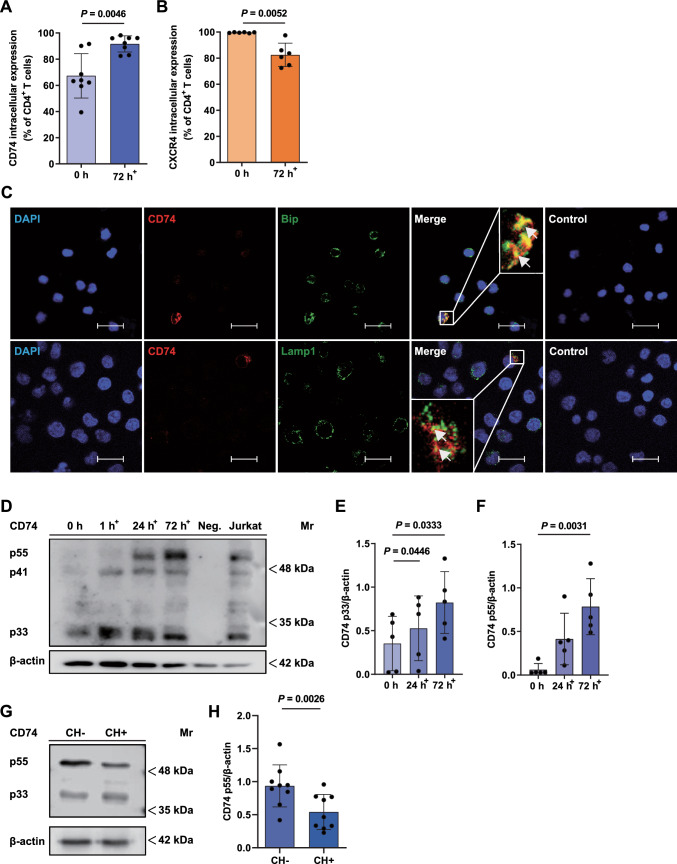
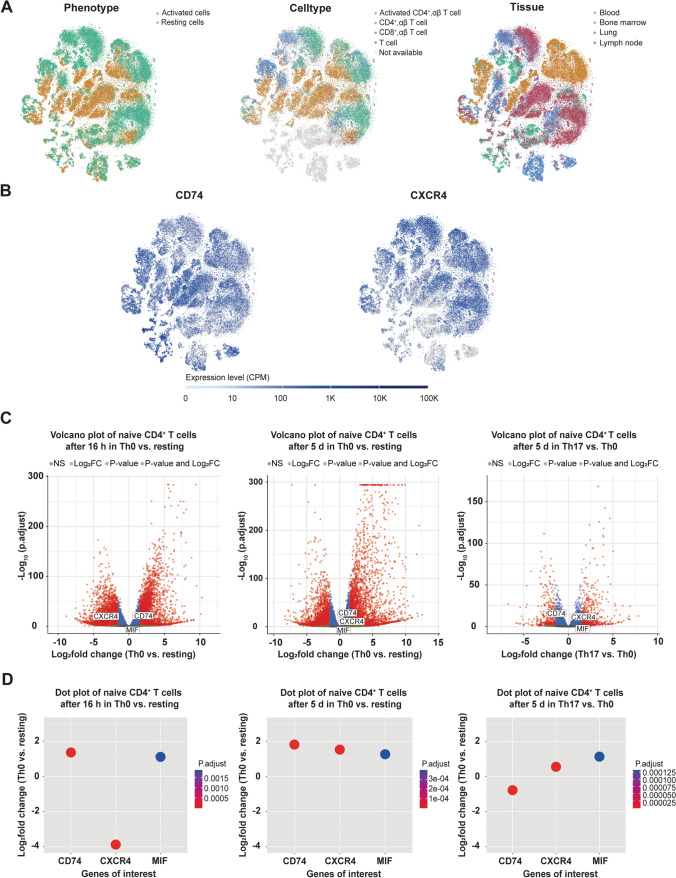
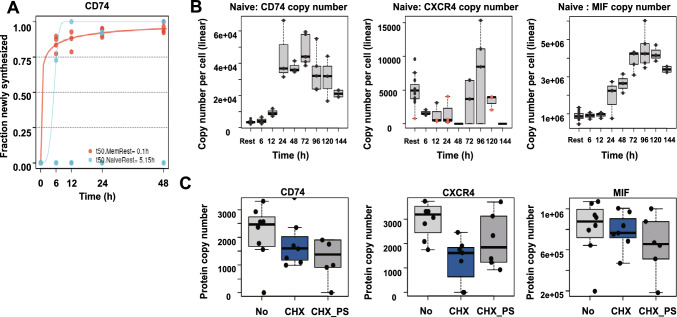
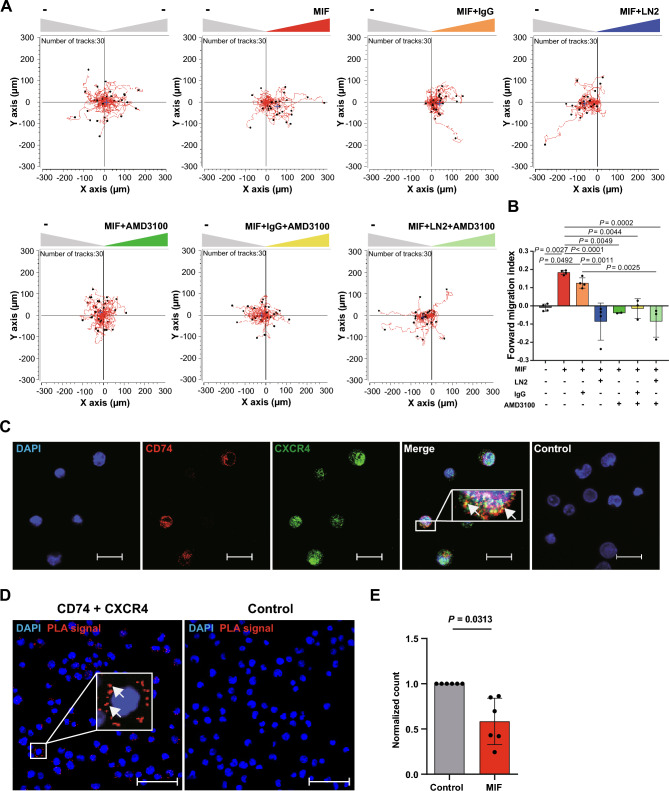
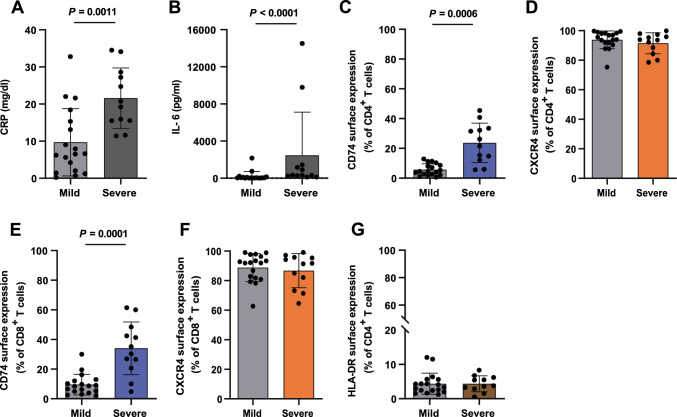
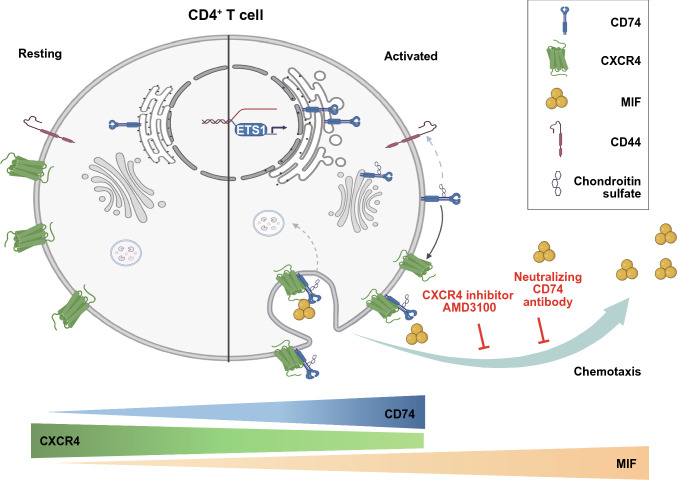
Next to its classical role in MHC II-mediated antigen presentation, CD74 was identified as a high-affinity receptor for macrophage migration inhibitory factor (MIF), a pleiotropic cytokine and major determinant of various acute and chronic inflammatory conditions, cardiovascular diseases and cancer. Recent evidence suggests that CD74 is expressed in T cells, but the functional relevance of this observation is poorly understood. Here, we characterized the regulation of CD74 expression and that of the MIF chemokine receptors during activation of human CD4+ T cells and studied links to MIF-induced T-cell migration, function, and COVID-19 disease stage. MIF receptor profiling of resting primary human CD4+ T cells via flow cytometry revealed high surface expression of CXCR4, while CD74, CXCR2 and ACKR3/CXCR7 were not measurably expressed. However, CD4+ T cells constitutively expressed CD74 intracellularly, which upon T-cell activation was significantly upregulated, post-translationally modified by chondroitin sulfate and could be detected on the cell surface, as determined by flow cytometry, Western blot, immunohistochemistry, and re-analysis of available RNA-sequencing and proteomic data sets. Applying 3D-matrix-based live cell-imaging and receptor pathway-specific inhibitors, we determined a causal involvement of CD74 and CXCR4 in MIF-induced CD4+ T-cell migration. Mechanistically, proximity ligation assay visualized CD74/CXCR4 heterocomplexes on activated CD4+ T cells, which were significantly diminished after MIF treatment, pointing towards a MIF-mediated internalization process. Lastly, in a cohort of 30 COVID-19 patients, CD74 surface expression was found to be significantly upregulated on CD4+ and CD8+ T cells in patients with severe compared to patients with only mild disease course. Together, our study characterizes the MIF receptor network in the course of T-cell activation and reveals CD74 as a novel functional MIF receptor and MHC II-independent activation marker of primary human CD4+ T cells.

Keywords: Atypical chemokine; CD74/invariant chain; CXCR4; MIF; Macrophage migration inhibitory factor; T cells.


Conflict of interest statement

C.S. received speaker honoraria from AstraZeneca on topics outside of the submitted work. J.B. and O.E.B. are inventors on patent applications related to anti-MIF strategies. All other authors declare no competing interests.

Figures

Fig. 1
Fig. 1
Cell surface MIF receptor profiling reveals inverse regulation of CD74 and CXCR4 upon T-cell activation. AD MIF receptor profiling on primary human CD4+ T cells upon activation. Flow cytometry-based cell surface receptor profiling of the four MIF receptors CD74, CXCR4, CXCR2, and ACKR3, as indicated, on purified human CD4+ T cells before (0 h) and after 72 h of in vitro T-cell activation. Cell surface receptor-positive cells are plotted for each of the four receptors as percentage of CD4+ T cells. E, F MHC class II-independent expression of CD74 on activated CD4+ T cells. HLA-DR surface expression on CD4+ T cells before (0 h) and after 72 h of in vitro T-cell activation determined by flow cytometry. Comparison of percentages of HLA-DR+CD74, HLA-DR+CD74+ and HLA-DRCD74+ CD4+ T cells after 72 h of activation. For AF, values are shown as means ± SD with individual datapoints representing independent donors (A, n = 22; B, n = 11; C, n = 9; D, n = 6; E, n = 5; F, n = 10). Differences between the 0 h and 72 h time points were analyzed by paired student’s t-test for B, D, E; by Wilcoxon matched-pairs signed-rank test for A and C and Friedman test with Dunn post-hoc test for F as appropriate. 72 h+ indicates time of in vitro T-cell activation in AE. G, H Inverse correlation of CD74 and CXCR4 surface expression with the naive cell marker CD45RA. Correlation of surface CD74 and CXCR4 expression with the naive cell marker CD45RA in 72 h-activated CD4+ T cells as evaluated by flow cytometry. Data is displayed as scatter diagrams with individual data points shown (G, n = 8; H, n = 9). Pearson correlation coefficient was calculated for percentage of CD74+ and CXCR4+ vs. CD45RA+ cells. I, J Correlation between MIF receptor expression and donor age. Correlation between CD74 and CXCR4 surface expression and donor age after 72 h of T-cell activation. Data are depicted as scatter plots with individual data points shown (I, n = 22; J, n = 15). Pearson correlation coefficient was calculated for relation between the percentage of CD74+ and CXCR4+ T cells and donor age. For all panels statistical significance is indicated by actual P values.
Fig. 2
Fig. 2
Constitutive expression and intracellular localization of CD74 in CD4+ T cells. A, B CD74 and CXCR4 expression in permeabilized CD4+ T cells before and after activation. Intracellular CD74 and CXCR4 expression was evaluated by flow cytometry of permeabilized freshly isolated (0 h) and 72 h-activated CD4+ T cells. Percentages of CD74+ (n = 8) and CXCR4+ (n = 6) cells are shown as means ± SD with individual datapoints representing independent donors. Statistical differences between the 0 h and 72 h time points were analyzed by paired student’s t-test. C Localization of CD74 in the endoplasmic reticulum (ER) and endolysosomal compartments. Immunofluorescent staining of CD74 (red) together with an ER (BiP, upper row, green) or lysosomal marker (LAMP1, bottom row, green) in 72 h in vitro activated and permeabilized CD4+ T cells imaged via CLSM (scale bar = 20 µm). Cell nuclei were counterstained with DAPI (blue). Samples stained with secondary antibodies alone served as controls. Arrows mark exemplary overlapping signals (yellow). Images shown are representative of three separate experiments. DF CD74 protein expression in the course of CD4+ T-cell activation evaluated by SDS-PAGE/WB. CD4+ T cells were purified and lysed before (0 h) or after 1 h, 24 h or 72 h of in vitro T-cell activation following SDS-PAGE and WB analysis for CD74 and β-actin protein expression. Neutrophil cell lysates served as a negative control (Neg.), CD74 protein content of the Jurkat cell line was assessed without prior activation. OD values of the detected p33 and p55 CD74 isoforms before and after 24 h and 72 h of T-cell activation were determined and normalized to β-actin. Upregulation of the p33 and p55 isoforms is displayed as columns (means ± SD) with individual data points (n = 5). For comparison of 24 h and 72 h timepoints to 0 h control, statistical differences were analyzed by one-way ANOVA with Dunnett post-hoc test for E and Friedman test with Dunn post-hoc test for F. 1 h+, 24 h+, 72 h+ indicate the respective time of in vitro T-cell activation in AF. G, H Evaluation of CD74 protein expression before and after chondroitinase treatment. 72 h-activated CD4+ T cells were lysed and treated with (CH+) or without (CH–) chondroitinase. SDS-PAGE and WB was performed as before for detection of CD74 and β-actin protein expression. Quantification of OD values of CD74 p55 in CH+  s. CH- samples normalized to β-actin displayed as bar chart (means ± SD) with individual data points (n = 9). Statistical differences were analyzed by paired student’s t-test. For all bar diagrams, statistical significance is indicated by actual P values.
Fig. 3
Fig. 3
Evaluation of mRNA expression dynamics of CD74, CXCR4 and MIF in CD4+ T cells. A, B CD74 and CXCR4 mRNA expression in resting and activated CD4+ T cells. t-SNE embedding for the scRNAseq dataset obtained from Szabo et al. including scRNA data of CD3+ T cells from lung, lung draining lymph nodes and bone marrow of two deceased organ donors and PBMCs of two healthy volunteers [35]. Clusters depicted in the upper row colored by resting (green) vs. activated (orange) phenotype (left), by cell type (middle, orange: activated CD4+ αβ T cells, green: CD4+ αβ T cells, blue: CD8+ αβ T cells, red: T cells, gray: not available) or by tissue (right, orange: blood, green: bone marrow, blue: lung, red. lymph node). mRNA expression levels are depicted in copies per million (CPM) reads of CD74 and CXCR4. C, D DGE analysis of CD74, CXCR4 and MIF depending on T-cell activation and cytokine polarization in naive CD4+ T cells. Re-analysis of publicly available bulk-RNAseq data of naive CD4+ T cells from three healthy individuals in different activation and cytokine polarization conditions by Cano-Gamez et al. regarding DGE analysis of CD74, CXCR4 and MIF highlighted in volcano plots (upper row, red: genes with log2fold >|1,5| and adjusted P < 0.05 changes, blue: genes with log2fold <|1,5| and adjusted P < 0.05 changes, green: genes with log2fold >|1,5| but non-significant (ns) changes, grey: genes with log2fold <|1,5| and ns changes) and in dot blots (bottom row, dots highlight significant results between experimental groups with adjusted P < 0.05, color scale indicates the respective p-values) including comparison of Th0 (activated without cytokine polarization) vs. resting (non-activated controls) conditions after 16 h (left) and 5 d (middle) as well as Th0 vs. Th17 cytokine polarization after 5 d (right) [28].
Fig. 4
Fig. 4
Evaluation of protein dynamics of CD74, CXCR4 and MIF in CD4+ T cells. A Rapid renewal of CD74 in resting memory CD4+ T cells. CD74 protein renewal rates in naive (blue) vs. memory (orange) CD4+ T cells. Fraction of newly synthesized protein calculated from LC–MS/MS analysis of pulsed SILAC of resting CD4+ T cells. Analysis conducted after 0, 6, 12, 24 and 48 h in culture. n = 3–4. B Time course of CD74, CXCR4 and MIF protein expression upon activation in naive CD4+ T cells. CD74 (left), CXCR4 (middle) and MIF (right) copy number per cell in naive CD4+ T cells. Label-free quantification of proteins via the MaxQuant algorithm without and after 6, 12, 24, 48, 72, 96, 120 and 144 h of in vitro activation. Proteins identified by MS/MS (black dots) or matching (orange dots). Estimation of copy number per cell based on protein mass of cell. n = 7 for resting naive T cells; n = 3 for 6 h, 12, 48 h, 120 h T cells, n = 4 for 24 h, 72 h, 96 h activated T cells. C Analysis of protein degradation in naive CD4+ T cells. Protein copy numbers of CD74 (left), CXCR4 (middle) and MIF (right) in naive CD4+ T cells without treatment (No), with 24 h of cycloheximide treatment alone (CHX, 50 μg/ml) or in combination with 10 μM bortezomib (CHX_PS). Box plots depict median and interquartile range (IQR). Whiskers show lowest data point contained in the 1.5 IQR of lowest quartile and highest data point contained in the 1.5 IQR of highest quartile. n = 5 for No, n = 4 for CHX and n = 6 for CHX_PS. Data in AC retrieved from Wolf et al. [39].
Fig. 5
Fig. 5
Involvement of CD74 and CXCR4 in MIF-mediated CD4+ T-cell chemotaxis. A Both MIF receptors CXCR4 and CD74 are required for MIF-elicited migration of activated CD4+ T cells as assessed by 3D chemotaxis assay. Representative trajectory plots (x, y = 0 at time 0 h) of migrated activated CD4+ T cells (72 h) in a three-dimensional (3D) aqueous collagen-gel matrix towards a MIF chemoattractant gradient (MIF concentration: 200 ng/ml, –: control medium) that was established in presence or absence of a CD74 neutralizing antibody, a corresponding isotype control (IgG) or the CXCR4 receptor inhibitor AMD3100. Cell motility was monitored by time-lapse microscopy for 2 h at 37 °C, images were obtained every minute using the Leica DMi8 microscope. Single cell tracking was performed of 30 cells per experimental group. The blue crosshair indicates the cell population’s center of mass after migration. B Quantification of the 3D chemotaxis experiment in A showing inhibition of MIF-induced CD4+ T-cell migration upon co-incubation with CD74 neutralizing antibody and AMD3100 either alone or in combination. Plotted is the calculated forward migration index (FMI, means ± SD) based on manual tracking of at least 30 individual cells per treatment (n = 2–4). Statistical differences were analyzed by one-way ANOVA with Tukey post-hoc test and indicated by actual P values. C Cell surface colocalization of the MIF receptors CD74 and CXCR4 on activated CD4+ T cells. Immunofluorescent cell surface staining of CD74 (red) and CXCR4 (green) either alone or in combination on 72 h-activated CD4+ T cells imaged via CLSM (scale bar = 20 µm). Cell nuclei were counterstained with DAPI (blue). Samples stained with secondary antibodies alone served as controls. Images shown are representative of two independent experiments. D, E Proximity ligation assay indicating CD74/CXCR4 heterocomplex formation and MIF dependent internalization. D Display of a representative PLA result visualizing the interaction of CD74 and CXCR4 on the cell surface of 72 h-activated CD4+ T cells (red dots indicating positive PLA signal; imaged via CLSM; 40 × objective, DAPI, blue; scale bar: 50 µm). E Quantification of CD74/CXCR4 heterocomplexes on the cell surface of 72 h-activated CD4+ T cells upon stimulation with MIF (200 mg/ml) prior to fixation (means ± SD of PLA dots /cell normalized to control, n = 6). Statistical differences were analyzed by Wilcoxon matched-pairs signed-rank test and indicated by actual P values
Fig. 6
Fig. 6
MHC-II independent upregulation of CD74 in T cells of critically ill COVID-19 patients. A, B Increased inflammatory markers CRP and IL-6 in patients with severe COVID-19 disease. Serum peak concentrations of inflammatory markers CRP (mg/dl) and IL-6 (pg/ml) from laboratory results of patients with mild (WHO 1–3, n = 18) vs. severe (WHO ≥ 5, n = 12) COVID-19 disease. CF CD74 and CXCR4 surface expression on CD4+ and CD8+ T cells from mild vs. severe disease patients. G No significant differences in HLA-DR surface expression in COVID-19 patient cohorts classified by disease severity. Results of a flow cytometry-based cell surface receptor profiling. Bar charts in AG show means ± SD with individual datapoints representing independent patients. Cell surface receptor-positive cells are plotted as percentages of the respective T-cell phenotype. Statistical differences were analyzed by unpaired t test for A and C and Mann–Whitney U test for B, D, E, F, and G and indicated by actual P values.
Fig. 7
Fig. 7
Scheme of the regulation of the MIF receptors CD74 and CXCR4 in resting and activated CD4+ T-cell state. During resting state, CD4+ T cells express CXCR4 abundantly on the cell surface, while CD74 is constitutively expressed and synthesized intracellularly. Most likely due to its retention signal CD74 resides in the ER with functional circulation in the endolysosomal compartment. Triggered by T-cell activation, CD74 gene expression and protein synthesis is rapidly upregulated in contrast to the initially repressed CXCR4 expression. We speculate, that ETS1 might be involved in the rapid regulation of CD74 in this process. Furthermore, CD74 molecules are post-translationally modified by addition of chondroitin sulfate moieties. This modification enables rapid transport of CD74 towards the cell surface, where it can act as a functional surface receptor for MIF, a proinflammatory cytokine that is secreted during T-cell activation and exerts additional auto- and paracrine effects. In activated CD4+ T cells, MIF leads to internalization of CD74/CXCR4 receptor complexes. Both receptors are crucial for MIF-induced chemotaxis, as blockade of either CXCR4 or CD74 abrogates CD4+ T-cell migration towards MIF. Scheme was created with BioRender.com (license of the Institute for Stroke and Dementia Research)

References

    1. Schröder B. The multifaceted roles of the invariant chain CD74—more than just a chaperone. Biochim Biophys Acta. 2016;1863:1269–1281. doi: 10.1016/j.bbamcr.2016.03.026. - DOI - PubMed
    1. Calandra T, Roger T. Macrophage migration inhibitory factor: a regulator of innate immunity. Nat Rev Immunol. 2003;3:791–800. doi: 10.1038/nri1200. - DOI - PMC - PubMed
    1. Kapurniotu A, Gokce O, Bernhagen J. The multitasking potential of alarmins and atypical chemokines. Front Med (Lausanne) 2019;6:3. doi: 10.3389/fmed.2019.00003. - DOI - PMC - PubMed
    1. Bernhagen J, Krohn R, Lue H, Gregory JL, Zernecke A, Koenen RR, Dewor M, Georgiev I, Schober A, Leng L, et al. MIF is a noncognate ligand of CXC chemokine receptors in inflammatory and atherogenic cell recruitment. Nat Med. 2007;13:587–596. doi: 10.1038/nm1567. - DOI - PubMed
    1. Leng L, Metz CN, Fang Y, Xu J, Donnelly S, Baugh J, Delohery T, Chen Y, Mitchell RA, Bucala R. MIF signal transduction initiated by binding to CD74. J Exp Med. 2003;197:1467–1476. doi: 10.1084/jem.20030286. - DOI - PMC - PubMed

MeSH terms

Substances