

Fronts divide diazotroph communities in the Southern Indian Ocean
- PMID: 38992179
- PMCID: PMC11245648
- DOI: 10.1093/femsec/fiae095
Fronts divide diazotroph communities in the Southern Indian Ocean
Abstract
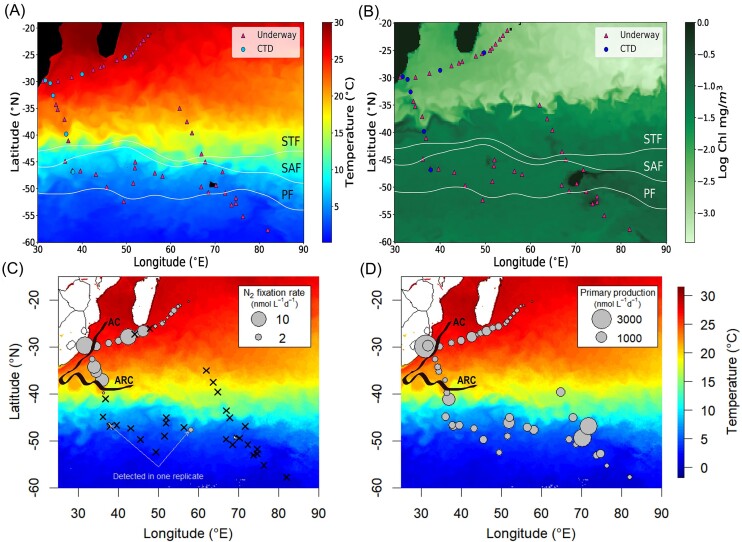
Dinitrogen (N2) fixation represents a key source of reactive nitrogen in marine ecosystems. While the process has been rather well-explored in low latitudes of the Atlantic and Pacific Oceans, other higher latitude regions and particularly the Indian Ocean have been chronically overlooked. Here, we characterize N2 fixation and diazotroph community composition across nutrient and trace metals gradients spanning the multifrontal system separating the oligotrophic waters of the Indian Ocean subtropical gyre from the high nutrient low chlorophyll waters of the Southern Ocean. We found a sharp contrasting distribution of diazotroph groups across the frontal system. Notably, cyanobacterial diazotrophs dominated north of fronts, driving high N2 fixation rates (up to 13.96 nmol N l-1 d-1) with notable peaks near the South African coast. South of the fronts non-cyanobacterial diazotrophs prevailed without significant N2 fixation activity being detected. Our results provide new crucial insights into high latitude diazotrophy in the Indian Ocean, which should contribute to improved climate model parameterization and enhanced constraints on global net primary productivity projections.
Keywords: HNLC; N2 fixation; fronts; noncyanobacterial diazotrophs; subtropical gyre; trace metals.
© The Author(s) 2024. Published by Oxford University Press on behalf of FEMS.
Conflict of interest statement
None declared.
Figures
References
-
- Baer SE, Rauschenberg S, Garcia CA et al. Carbon and nitrogen productivity during spring in the oligotrophic Indian Ocean along the GO-SHIP IO9N transect. Deep Sea Res Part II. 2019;161:81–91.
-
- Balaguer J, Thoms S, Trimborn S. The physiological response of an Antarctic key phytoplankton species to low iron and manganese concentrations. Limnol Oceanogr. 2023;68:2153–66.
-
- Baltar F, Currie K, Stuck E et al. Oceanic fronts: transition zones for bacterioplankton community composition: fronts delimit bacterioplankton communities. Environ Microbiol Rep. 2016;8:132–8. - PubMed
MeSH terms
Grants and funding
LinkOut - more resources
Full Text Sources
