

PRDM6 promotes medulloblastoma by repressing chromatin accessibility and altering gene expression
- PMID: 38992221
- PMCID: PMC11239875
- DOI: 10.1038/s41598-024-66811-6
PRDM6 promotes medulloblastoma by repressing chromatin accessibility and altering gene expression
Abstract
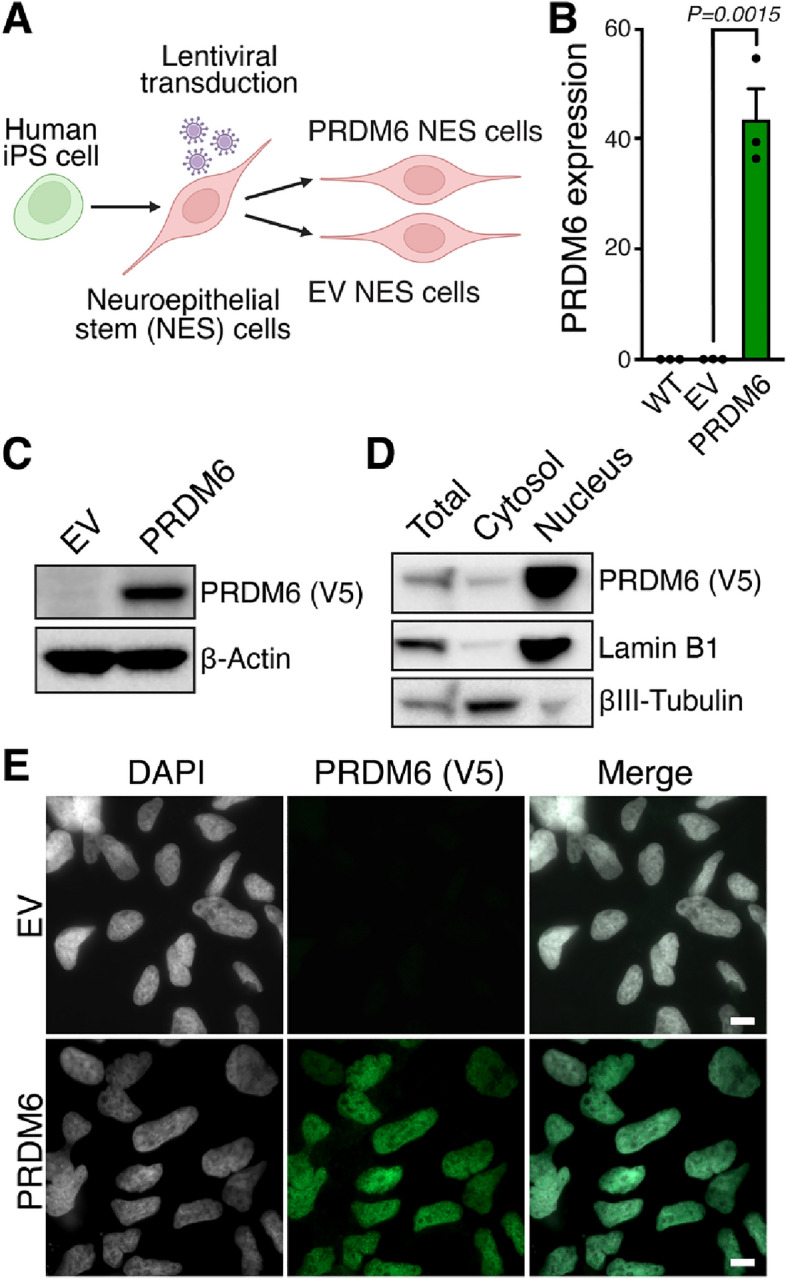
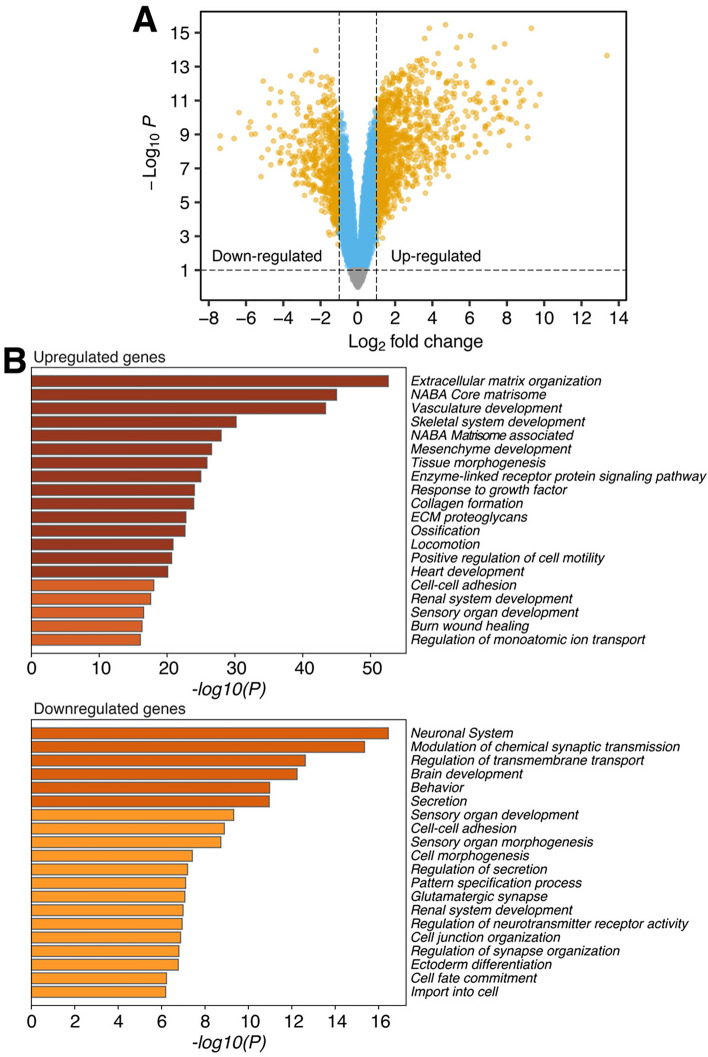
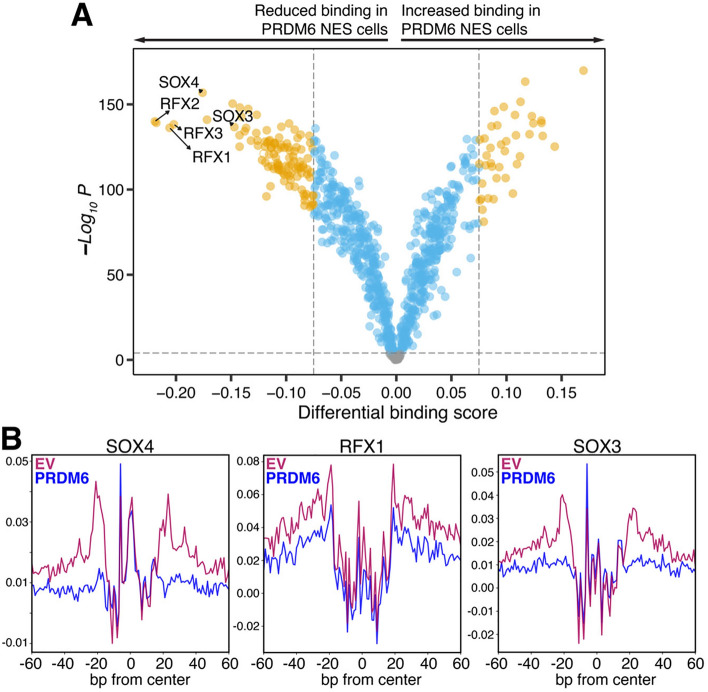
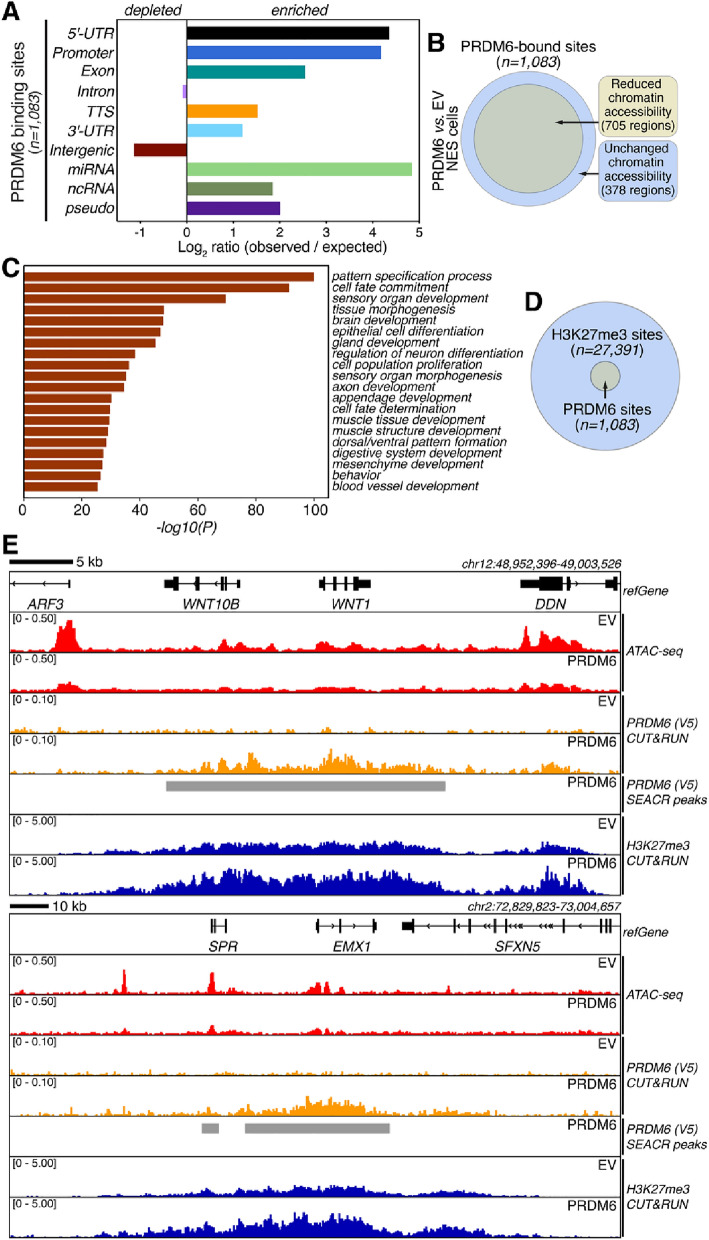
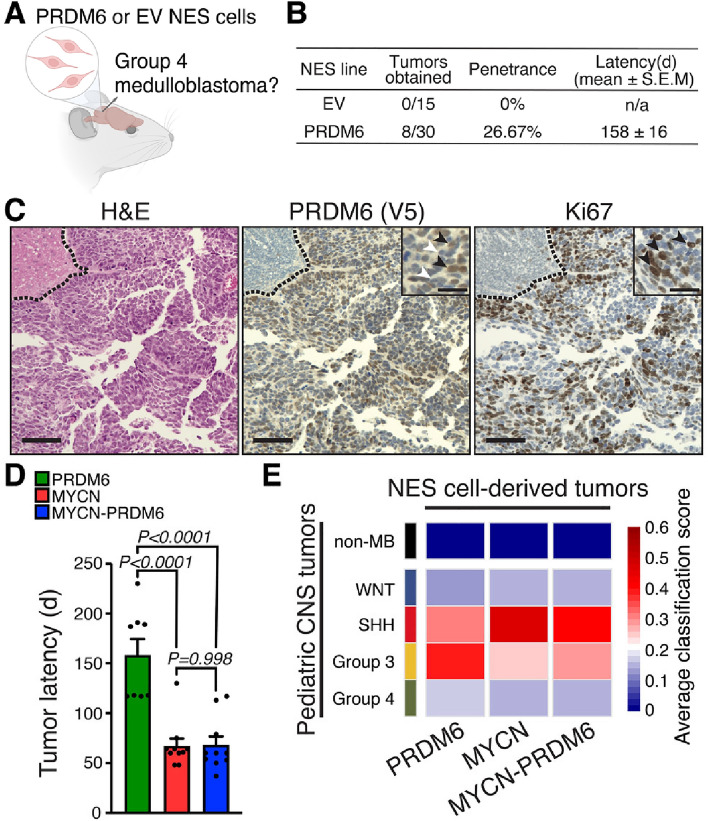
SNCAIP duplication may promote Group 4 medulloblastoma via induction of PRDM6, a poorly characterized member of the PRDF1 and RIZ1 homology domain-containing (PRDM) family of transcription factors. Here, we investigated the function of PRDM6 in human hindbrain neuroepithelial stem cells and tested PRDM6 as a driver of Group 4 medulloblastoma. We report that human PRDM6 localizes predominantly to the nucleus, where it causes widespread repression of chromatin accessibility and complex alterations of gene expression patterns. Genome-wide mapping of PRDM6 binding reveals that PRDM6 binds to chromatin regions marked by histone H3 lysine 27 trimethylation that are located within, or proximal to, genes. Moreover, we show that PRDM6 expression in neuroepithelial stem cells promotes medulloblastoma. Surprisingly, medulloblastomas derived from PRDM6-expressing neuroepithelial stem cells match human Group 3, but not Group 4, medulloblastoma. We conclude that PRDM6 expression has oncogenic potential but is insufficient to drive Group 4 medulloblastoma from neuroepithelial stem cells. We propose that both PRDM6 and additional factors, such as specific cell-of-origin features, are required for Group 4 medulloblastoma. Given the lack of PRDM6 expression in normal tissues and its oncogenic potential shown here, we suggest that PRDM6 inhibition may have therapeutic value in PRDM6-expressing medulloblastomas.
© 2024. The Author(s).
Conflict of interest statement
The authors declare no competing interests.
Figures

Update of
-
PRDM6 promotes medulloblastoma by repressing chromatin accessibility and altering gene expression.bioRxiv [Preprint]. 2023 Aug 31:2023.08.29.555389. doi: 10.1101/2023.08.29.555389. bioRxiv. 2023. Update in: Sci Rep. 2024 Jul 12;14(1):16074. doi: 10.1038/s41598-024-66811-6. PMID: 37693484 Free PMC article. Updated. Preprint.
Similar articles
-
PRDM6 promotes medulloblastoma by repressing chromatin accessibility and altering gene expression.bioRxiv [Preprint]. 2023 Aug 31:2023.08.29.555389. doi: 10.1101/2023.08.29.555389. bioRxiv. 2023. Update in: Sci Rep. 2024 Jul 12;14(1):16074. doi: 10.1038/s41598-024-66811-6. PMID: 37693484 Free PMC article. Updated. Preprint.
-
Chromatin accessibility mapping identifies mediators of basal transcription and retinoid-induced repression of OTX2 in medulloblastoma.PLoS One. 2014 Sep 8;9(9):e107156. doi: 10.1371/journal.pone.0107156. eCollection 2014. PLoS One. 2014. PMID: 25198066 Free PMC article.
-
Regulation of USP37 Expression by REST-Associated G9a-Dependent Histone Methylation.Mol Cancer Res. 2017 Aug;15(8):1073-1084. doi: 10.1158/1541-7786.MCR-16-0424. Epub 2017 May 8. Mol Cancer Res. 2017. PMID: 28483947 Free PMC article.
-
Epigenetic Drivers in Pediatric Medulloblastoma.Cerebellum. 2018 Feb;17(1):28-36. doi: 10.1007/s12311-017-0899-9. Cerebellum. 2018. PMID: 29178021 Free PMC article. Review.
-
Epigenetic regulation in medulloblastoma pathogenesis revealed by genetically engineered mouse models.Cancer Sci. 2021 Aug;112(8):2948-2957. doi: 10.1111/cas.14990. Epub 2021 Jun 17. Cancer Sci. 2021. PMID: 34050694 Free PMC article. Review.
Cited by
-
Analysis of Head and Neck Cancer scRNA-seq Data Identified PRDM6 Promotes Tumor Progression by Modulating Immune Gene Expression.bioRxiv [Preprint]. 2025 Mar 7:2025.03.04.641548. doi: 10.1101/2025.03.04.641548. bioRxiv. 2025. PMID: 40093183 Free PMC article. Preprint.
-
Epigenetic Modifiers: Exploring the Roles of Histone Methyltransferases and Demethylases in Cancer and Neurodegeneration.Biology (Basel). 2024 Dec 3;13(12):1008. doi: 10.3390/biology13121008. Biology (Basel). 2024. PMID: 39765675 Free PMC article. Review.
-
Identification and Validation of Prognostic Genes Related to Histone Lactylation Modification in Glioblastoma: An Integrated Analysis of Transcriptome and Single-cell RNA Sequencing.J Cancer. 2025 Mar 21;16(7):2145-2166. doi: 10.7150/jca.110646. eCollection 2025. J Cancer. 2025. PMID: 40302809 Free PMC article.
-
Epigenetic modifications and their roles in pediatric brain tumor formation: emerging insights from chromatin dysregulation.Front Oncol. 2025 Jun 17;15:1569548. doi: 10.3389/fonc.2025.1569548. eCollection 2025. Front Oncol. 2025. PMID: 40599851 Free PMC article. Review.
-
Advancing Medulloblastoma Therapy in Pediatrics: Integrative Molecular Classification and Emerging Treatments.Brain Sci. 2025 Aug 21;15(8):896. doi: 10.3390/brainsci15080896. Brain Sci. 2025. PMID: 40867227 Free PMC article. Review.
