

Human post-implantation blastocyst-like characteristics of Muse cells isolated from human umbilical cord
- PMID: 38992309
- PMCID: PMC11335221
- DOI: 10.1007/s00018-024-05339-4
Human post-implantation blastocyst-like characteristics of Muse cells isolated from human umbilical cord
Abstract
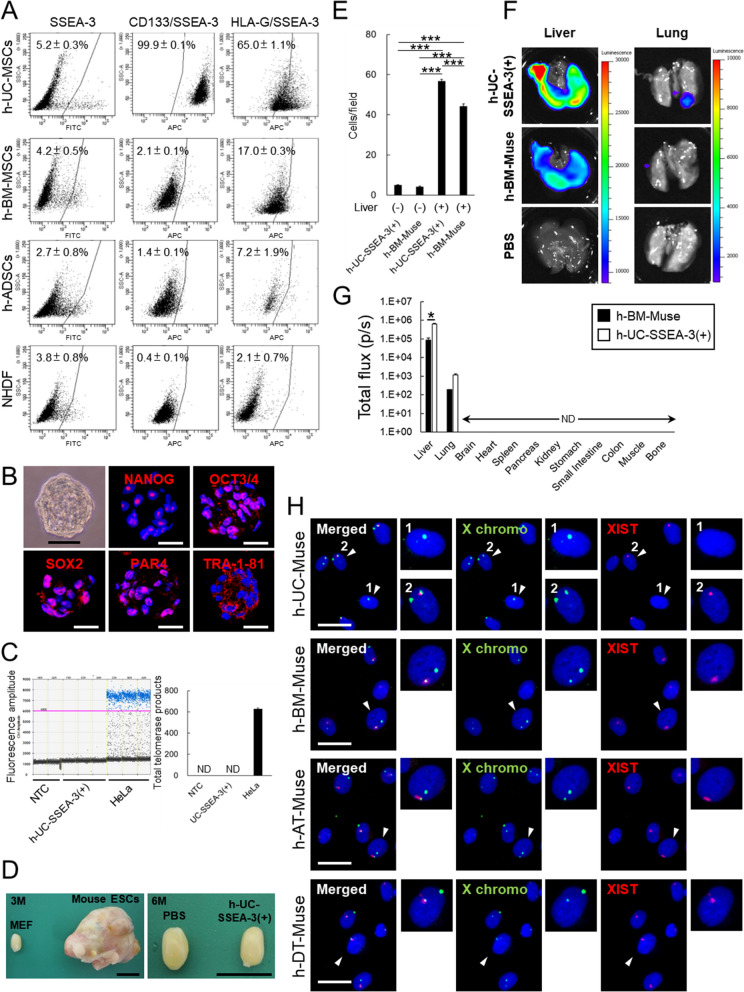
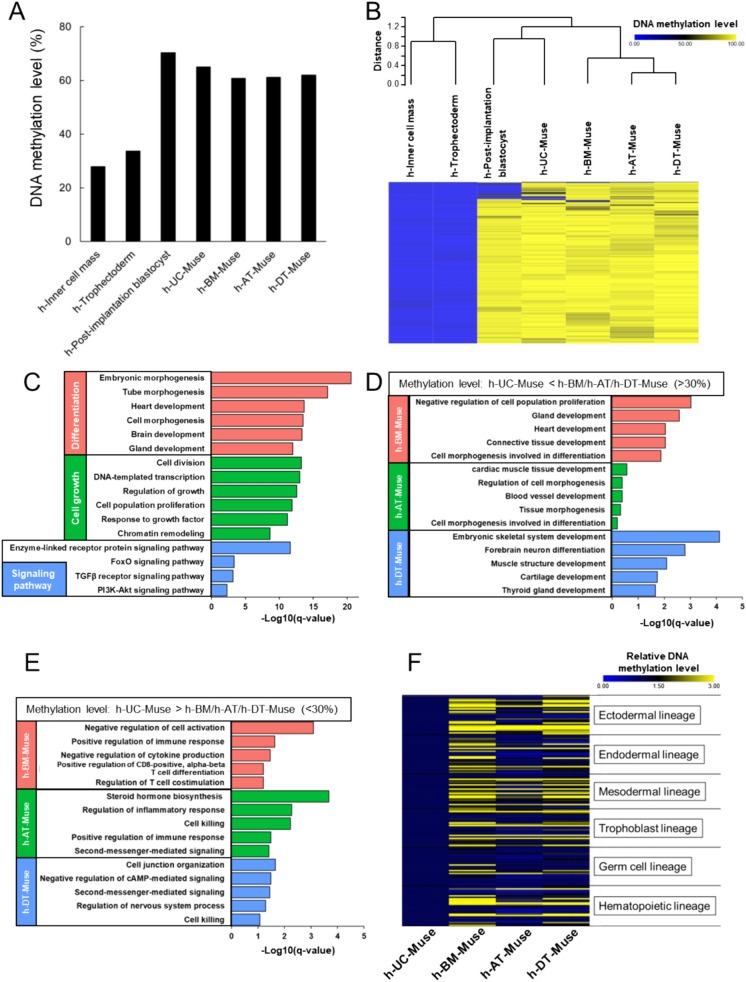
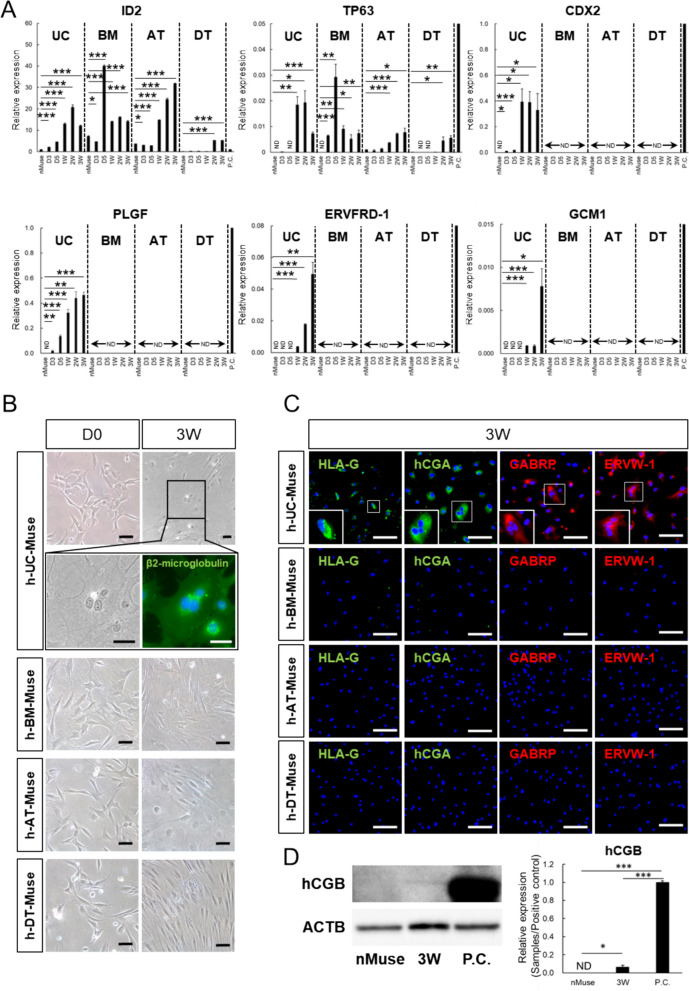
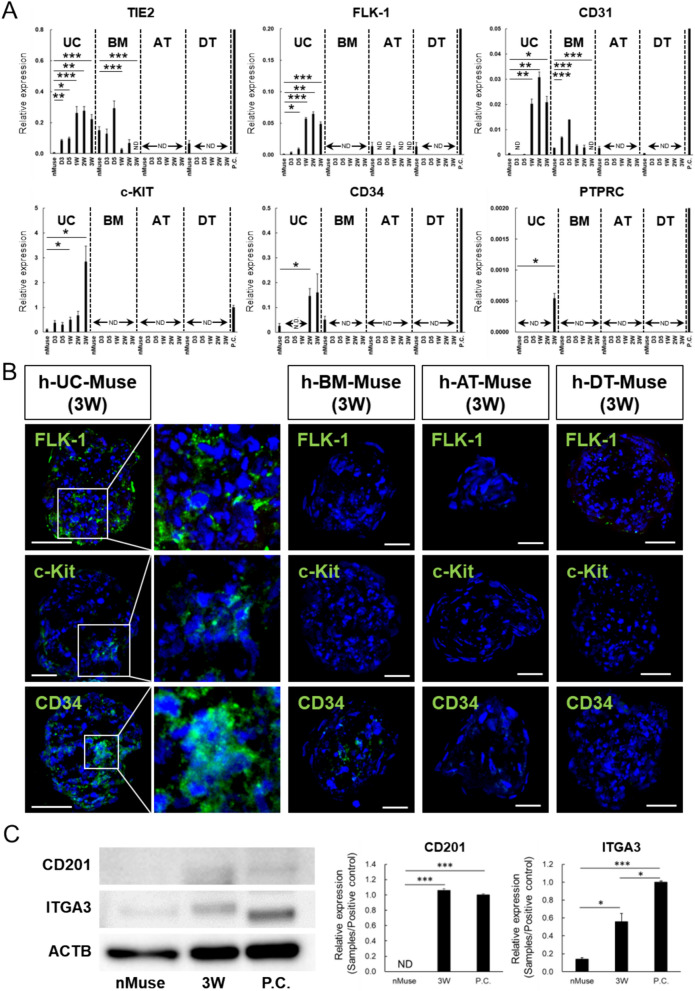
Muse cells, identified as cells positive for the pluripotent surface marker SSEA-3, are pluripotent-like endogenous stem cells located in the bone marrow (BM), peripheral blood, and organ connective tissues. The detailed characteristics of SSEA-3(+) cells in extraembryonic tissue, however, are unknown. Here, we demonstrated that similar to human-adult tissue-Muse cells collected from the BM, adipose tissue, and dermis as SSEA-3(+), human-umbilical cord (UC)-SSEA-3(+) cells express pluripotency markers, differentiate into triploblastic-lineage cells at a single cell level, migrate to damaged tissue, and exhibit low telomerase activity and non-tumorigenicity. Notably, ~ 20% of human-UC-SSEA-3(+) cells were negative for X-inactive specific transcript (XIST), a naïve pluripotent stem cell characteristic, whereas all human adult tissue-Muse cells are XIST-positive. Single-cell RNA sequencing revealed that the gene expression profile of human-UC-SSEA-3(+) cells was more similar to that of human post-implantation blastocysts than human-adult tissue-Muse cells. The DNA methylation level showed the same trend, and notably, the methylation levels in genes particularly related to differentiation were lower in human-UC-SSEA-3(+) cells than in human-adult tissue-Muse cells. Furthermore, human-UC-SSEA-3(+) cells newly express markers specific to extraembryonic-, germline-, and hematopoietic-lineages after differentiation induction in vitro whereas human-adult tissue-Muse cells respond only partially to the induction. Among various stem/progenitor cells in living bodies, those that exhibit properties similar to post-implantation blastocysts in a naïve state have not yet been found in humans. Easily accessible human-UC-SSEA-3(+) cells may be a valuable tool for studying early-stage human development and human reproductive medicine.
Keywords: DNA methylation; Human post-implantation blastocyst; Muse cells; Single-cell RNA sequencing; Umbilical cord; XIST.
© 2024. The Author(s).
Conflict of interest statement
Yoshihiro Kushida and Mari Dezawa have a patent for Muse cells and their isolation method.
Figures


Similar articles
-
A Novel Type of Stem Cells Double-Positive for SSEA-3 and CD45 in Human Peripheral Blood.Cell Transplant. 2020 Jan-Dec;29:963689720923574. doi: 10.1177/0963689720923574. Cell Transplant. 2020. PMID: 32525407 Free PMC article.
-
Naïve pluripotent-like characteristics of non-tumorigenic Muse cells isolated from human amniotic membrane.Sci Rep. 2022 Oct 14;12(1):17222. doi: 10.1038/s41598-022-22282-1. Sci Rep. 2022. PMID: 36241699 Free PMC article.
-
Human adipose tissue possesses a unique population of pluripotent stem cells with nontumorigenic and low telomerase activities: potential implications in regenerative medicine.Stem Cells Dev. 2014 Apr 1;23(7):717-28. doi: 10.1089/scd.2013.0473. Epub 2014 Jan 17. Stem Cells Dev. 2014. PMID: 24256547
-
The Muse Cell Discovery, Thanks to Wine and Science.Adv Exp Med Biol. 2018;1103:1-11. doi: 10.1007/978-4-431-56847-6_1. Adv Exp Med Biol. 2018. PMID: 30484221 Review.
-
Endogenous reparative pluripotent Muse cells with a unique immune privilege system: Hint at a new strategy for controlling acute and chronic inflammation.Front Pharmacol. 2022 Oct 19;13:1027961. doi: 10.3389/fphar.2022.1027961. eCollection 2022. Front Pharmacol. 2022. PMID: 36339573 Free PMC article. Review.
Cited by
-
Accumulation of endogenous Muse cells in the myocardium and its pathophysiological role in patients with fulminant myocarditis.Clin Transl Sci. 2024 Nov;17(11):e70067. doi: 10.1111/cts.70067. Clin Transl Sci. 2024. PMID: 39543854 Free PMC article.
-
Macrophage- and pluripotent-like reparative Muse cells are unique endogenous stem cells distinct from other somatic stem cells.Front Bioeng Biotechnol. 2025 Mar 27;13:1553382. doi: 10.3389/fbioe.2025.1553382. eCollection 2025. Front Bioeng Biotechnol. 2025. PMID: 40213632 Free PMC article. Review.
-
Nose-to-brain delivery of human muse cells enhances structural and functional recovery in the murine ischemic stroke model.Sci Rep. 2025 May 9;15(1):16243. doi: 10.1038/s41598-025-96451-3. Sci Rep. 2025. PMID: 40346279 Free PMC article.
-
Hypoxia boosts pluripotent-like muse cell ratio in mesenchymal stromal cells and upregulates the pluripotency gene expression.Sci Rep. 2025 Aug 25;15(1):31183. doi: 10.1038/s41598-025-03806-x. Sci Rep. 2025. PMID: 40854920 Free PMC article.
-
Comparison of MSCs and Muse cells: the possible use for healthspan optimization.Biogerontology. 2025 Jul 2;26(4):139. doi: 10.1007/s10522-025-10275-2. Biogerontology. 2025. PMID: 40601066 Free PMC article.
References
-
- Wakao S, Kitada M, Kuroda Y, Shigemoto T, Matsuse D, Akashi H, et al. Multilineage-differentiating stress-enduring (Muse) cells are a primary source of induced pluripotent stem cells in human fibroblasts. Proc Natl Acad Sci U S A. 2011;108(24):9875–9880. doi: 10.1073/pnas.1100816108. - DOI - PMC - PubMed
-
- Ogura F, Wakao S, Kuroda Y, Tsuchiyama K, Bagheri M, Heneidi S, Chazenbalk G, Aiba S, Dezawa M. Human adipose tissue possesses a unique population of pluripotent stem cells with nontumorigenic and low telomerase activities: potential implications in regenerative medicine. Stem Cells Dev. 2014;23(7):717–728. doi: 10.1089/scd.2013.0473. - DOI - PubMed
MeSH terms
Substances
Grants and funding
LinkOut - more resources
Full Text Sources
