

Alpha-melanocyte-stimulating hormone contributes to an anti-inflammatory response to lipopolysaccharide
- PMID: 38992428
- PMCID: PMC11362619
- DOI: 10.1016/j.molmet.2024.101986
Alpha-melanocyte-stimulating hormone contributes to an anti-inflammatory response to lipopolysaccharide
Abstract
Objective: During infection, metabolism and immunity react dynamically to promote survival through mechanisms that remain unclear. Pro-opiomelanocortin (POMC) cleavage products are produced and released in the brain and in the pituitary gland. One POMC cleavage product, alpha-melanocyte-stimulating hormone (α-MSH), is known to regulate food intake and energy expenditure and has anti-inflammatory effects. However, it is not known whether α-MSH is required to regulate physiological anti-inflammatory responses. We recently developed a novel mouse model with a targeted mutation in Pomc (Pomctm1/tm1 mice) to block production of all α-MSH forms which are required to regulate metabolism. To test whether endogenous α-MSH is required to regulate immune responses, we compared acute bacterial lipopolysaccharide (LPS)-induced inflammation between Pomctm1/tm1 and wild-type Pomcwt/wt mice.
Methods: We challenged 10- to 14-week-old male Pomctm1/tm1 and Pomcwt/wt mice with single i.p. injections of either saline or low-dose LPS (100 μg/kg) and monitored immune and metabolic responses. We used telemetry to measure core body temperature (Tb), ELISA to measure circulating cytokines, corticosterone and α-MSH, and metabolic chambers to measure body weight, food intake, activity, and respiration. We also developed a mass spectrometry method to measure three forms of α-MSH produced in the mouse hypothalamus and pituitary gland.
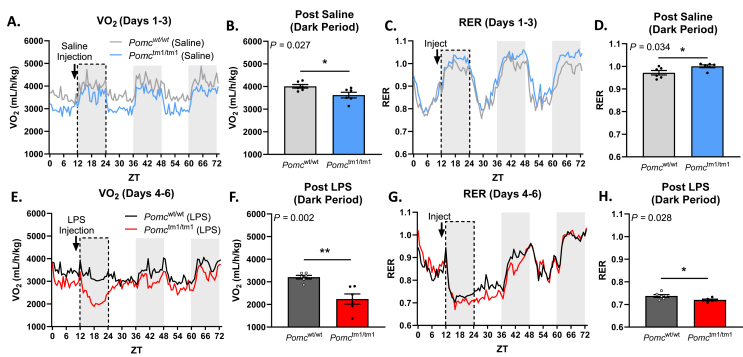
Results: LPS induced an exaggerated immune response in Pomctm1/tm1 compared to Pomcwt/wt mice. Both groups of mice were hypoactive and hypothermic following LPS administration, but Pomctm1/tm1 mice were significantly more hypothermic compared to control mice injected with LPS. Pomctm1/tm1 mice also had reduced oxygen consumption and impaired metabolic responses to LPS compared to controls. Pomctm1/tm1 mice had increased levels of key proinflammatory cytokines at 2 h and 4 h post LPS injection compared to Pomcwt/wt mice. Lastly, Pomcwt/wt mice injected with LPS compared to saline had increased total α-MSH in circulation 2 h post injection.
Conclusions: Our data indicate endogenous α-MSH contributes to the inflammatory immune responses triggered by low-dose LPS administration and suggest that targeting the melanocortin system could be a potential therapeutic for the treatment of sepsis or inflammatory disease.
Keywords: LPS; Mouse model; POMC; Thermogenesis; α-MSH.
Copyright © 2024 The Authors. Published by Elsevier GmbH.. All rights reserved.
Conflict of interest statement
Declaration of competing interest The authors declare that they have no known competing financial interests or personal relationships that could have appeared to influence the work reported in this paper.
Figures


References
-
- Mountjoy K.G. Pro-opiomelanocortin (POMC) neurones, POMC-derived peptides, melanocortin receptors and obesity: how understanding of this system has changed over the last decade. J Neuroendocrinol. 2015;27(6):406–418. - PubMed
-
- Cone R.D. Anatomy and regulation of the central melanocortin system. Nat Neurosci. 2005;8(5):571–578. - PubMed
-
- Abbott C.R., Rossi M., Kim M., AlAhmed S.H., Taylor G.M., Ghatei M.A., et al. Investigation of the melanocyte stimulating hormones on food intake. Lack of evidence to support a role for the melanocortin-3-receptor. Brain Res. 2000;869(1–2):203–210. - PubMed
MeSH terms
Substances
Grants and funding
LinkOut - more resources
Full Text Sources
Miscellaneous
