. 2024 Aug;300(8):107544.
doi: 10.1016/j.jbc.2024.107544. Epub 2024 Jul 9.

Regulatable assembly of synthetic microtubule architectures using engineered microtubule-associated protein-IDR condensates

Affiliations

Regulatable assembly of synthetic microtubule architectures using engineered microtubule-associated protein-IDR condensates

Chih-Chia Chang et al. J Biol Chem. 2024 Aug.

Abstract

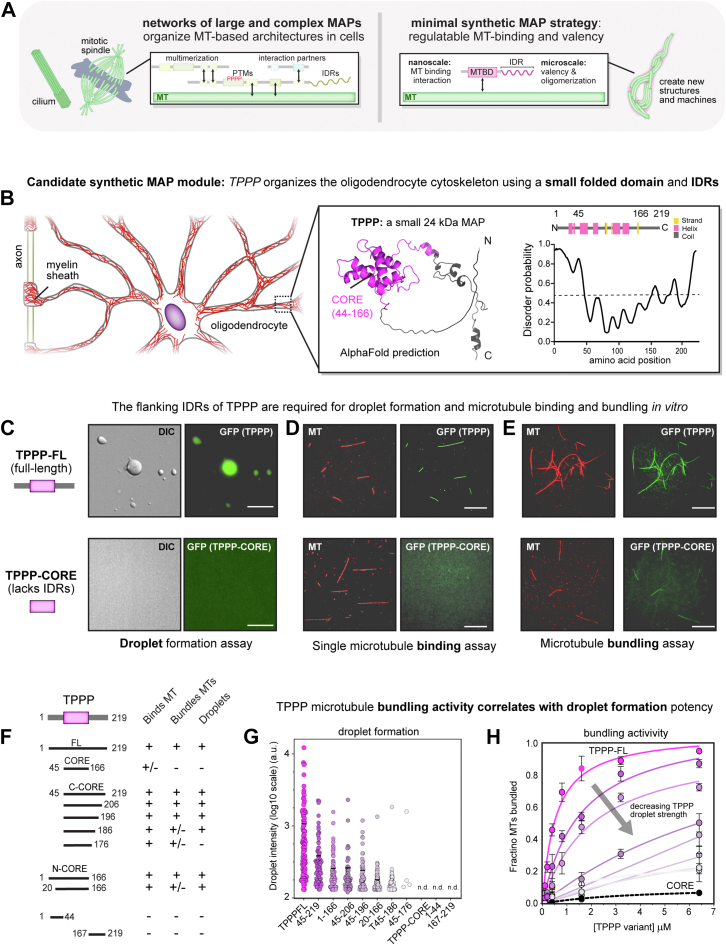
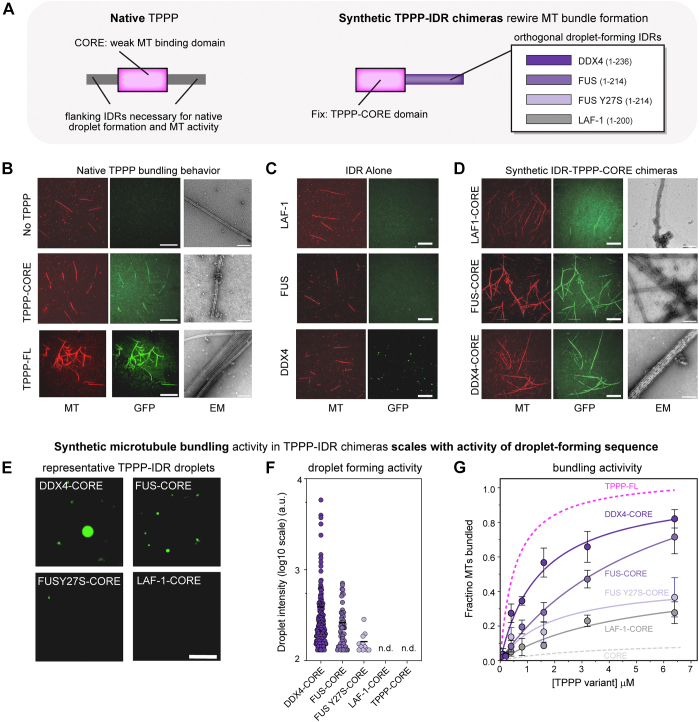
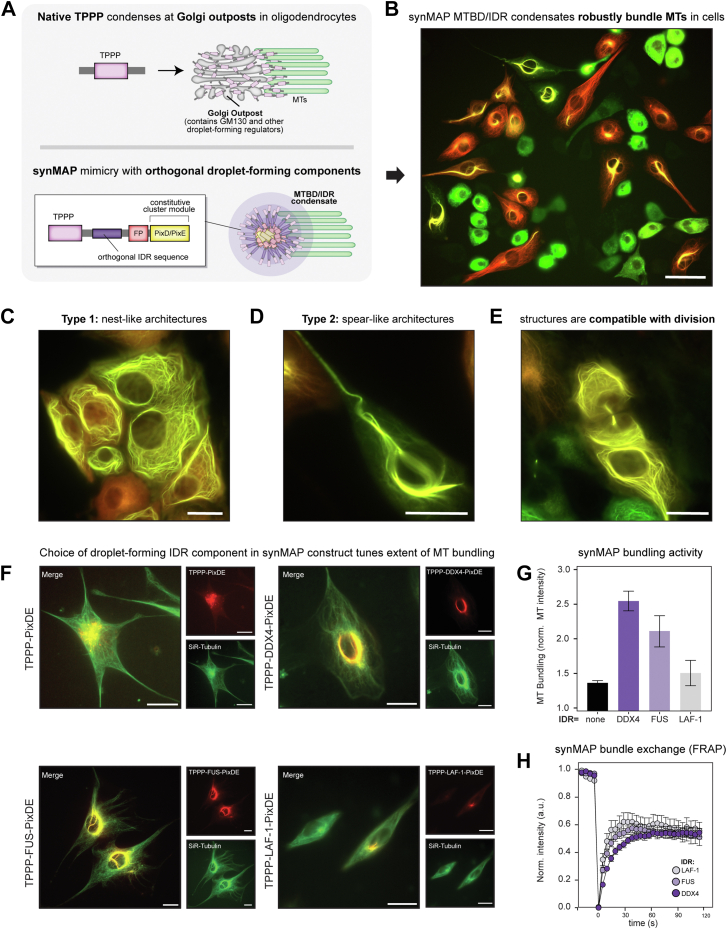
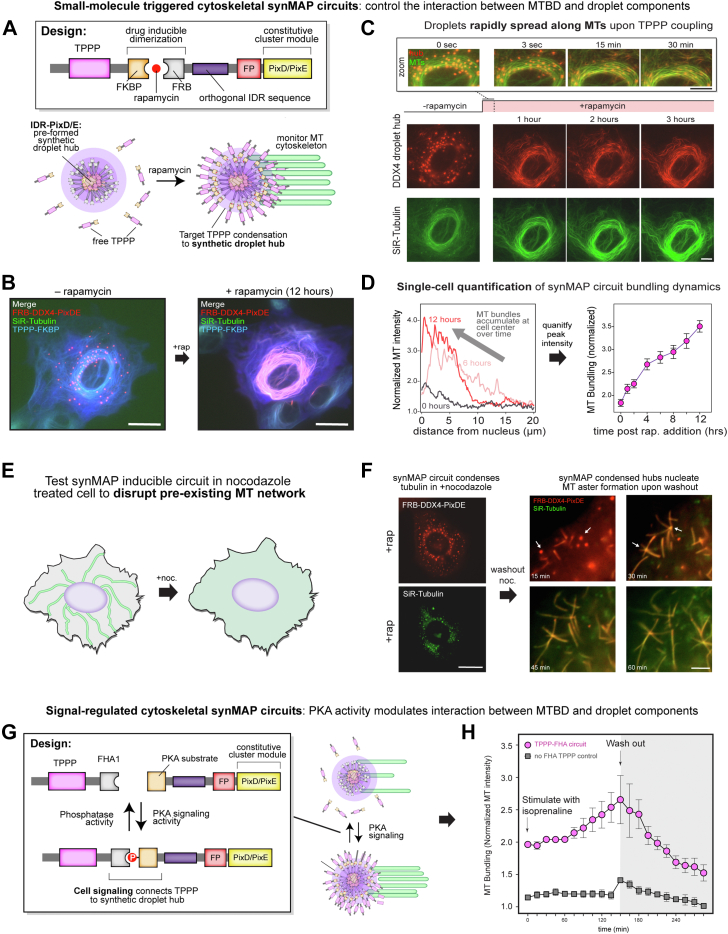
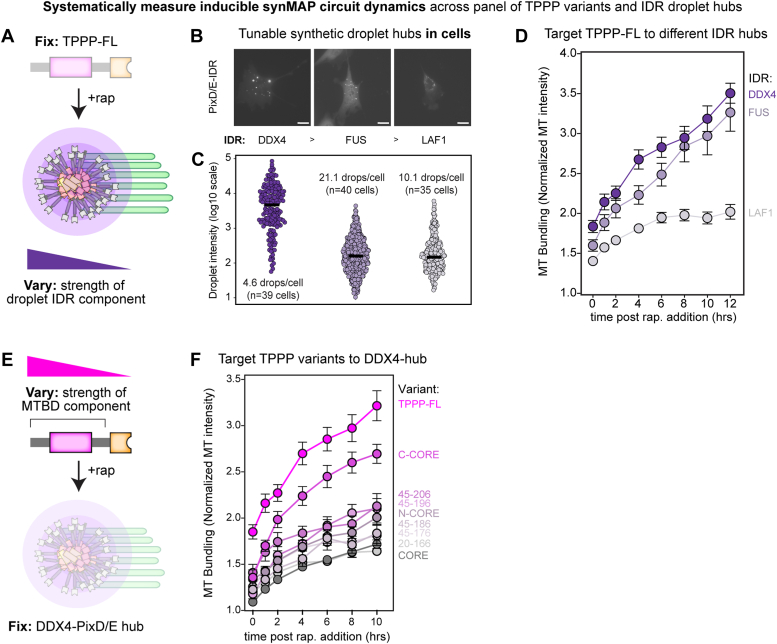
Microtubule filaments are assembled into higher-order structures using microtubule-associated proteins. However, synthetic MAPs that direct the formation of new structures are challenging to design, as nanoscale biochemical activities must be organized across micron length-scales. Here, we develop modular MAP-IDR condensates (synMAPs) that enable inducible assembly of higher-order microtubule structures for synthetic exploration in vitro and in mammalian cells. synMAPs harness a small microtubule-binding domain from oligodendrocytes (TPPP) whose activity we show can be rewired by interaction with unrelated condensate-forming IDR sequences. This combination is sufficient to allow synMAPs to self-organize multivalent structures that bind and bridge microtubules into higher-order architectures. By regulating the connection between the microtubule-binding domain and condensate-forming components of a synMAP, the formation of these structures can be triggered by small molecules or cell-signaling inputs. We systematically test a panel of synMAP circuit designs to define how the assembly of these synthetic microtubule structures can be controlled at the nanoscale (via microtubule-binding affinity) and microscale (via condensate formation). synMAPs thus provide a modular starting point for the design of higher-order microtubule systems and an experimental testbed for exploring condensate-directed mechanisms of higher-order microtubule assembly from the bottom-up.

Keywords: cell circuits; condensates; cytoskeleton; microtubules; synthetic biology.


Conflict of interest statement

Conflict of interest The authors declare that they have no conflicts of interest with the contents of this article.

Figures

Figure 1
Figure 1
Identification of TPPP as a condensate-regulatable microtubule bundling module for building synthetic microtubule assemblies.A, overview for designing synthetic microtubule-associated proteins (MAPs) to build new microtubule architectures. (left) Native MAPs, such as spindle assembly factors (e.g., NuMA and TPX2), have multidomain architectures with many activities that provide valency, multimerization, and complex dynamic regulation; (right) a minimal design for a regulatable synMAP protein based on a single microtubule-binding domain to facilitate microtubule attachment and a condensate-forming sequence (IDR) to drive valency and multimerization. B, identification of TPPP as a candidate module for synthetic engineering using the strategy in (A). TPPP is a 24 kDa protein that promotes microtubule nucleation, bundling, and stabilization in oligodendrocytes. A 3D visualization of the AlphaFold structure prediction for TPPP is shown, with the folded CORE domain in pink and unstructured regions in gray. The corresponding secondary structure prediction of TPPP protein domains is indicated, with α-helical and β-strands structures are shown as pink and yellow blocks, along with the PrDOS-predicted intrinsic disorder of TPPP. Higher scores indicate a greater degree of disorder. C, epifluorescence images of TPPP droplet formation. TPPP, but not the isolated CORE domain, phase-separate into drops in the presence of 12% of dextran crowding agent. DIC (left) and green fluorescence (right) images of GFP-TPPP FL and GFP-TPPP-CORE, both at the concentration of 20 μM with 20 mM Hepes, 50 mM NaCl, 3 mM DTT, and 12% dextran. Scale bars represent 10 μm. D, TIRF images of single-microtubule binding for TPPP and isolated CORE domain. GMPCPP-stabilized microtubules (Alexa-594 and biotin-labeled), immobilized on a glass surface, were incubated with GFP-TPPP FL and GFP-TPPP-CORE, respectively, both at the concentration of 600 nM. Scale bars represent 10 μm. E, TIRF microscopy images of microtubule bundling for TPPP and isolated CORE domain. GFP-TPPP FL and GFP-TPPP-CORE (green) were mixed with in vitro polymerized Alexa-594 (red), biotin-labeled, and GMPCPP-stabilized microtubules for 5 min, then captured microtubule bundles by NeutrAvidin-coated biotin coverslips, both at the concentration of 6.4 μM. Scale bars represent 10 μm. F, behavior of different TPPP truncations and fragments with respect to MT-binding, bundling, and droplet formation activities. Symbols denote experiments performed qualitatively. G, quantification of GFP-TPPP variants from (F) with respect to droplet fluorescence signal intensity. The mean was determined from data pooled from five representative images. GFP-TPPP variants droplet number in total five images, respectively; TPPP FL, n = 107; TPPP -Ccore(45–219), n = 92; TPPP-Ncore(1–166), n = 73; TPPP(45–206), n = 53; TPPP(45–196), n = 60; TPPP(20–166), n = 89; TPPP(45–186), n = 90; TPPP(45–176), n = 4. TPPP-CORE(45–166), TPPP N-term, and TPPP C-term showed n.d., not detectable droplets. All GFP-TPPP variants were in the concentration of 20 μM with 20 mM Hepes, 50 mM NaCl, 3 mM DTT, and 12% dextran. N here refers to droplet number. H, MT bundling activity for the variants in (F) was quantified as an EC50 from full titration curves measuring the fraction of microtubules in bundles as a function of variant concentration. TPPP FL, EC50 = 0.54 μM; TPPP-Ccore, EC50 = 1.58 μM; TPPP-Ncore, EC50 = 2.06 μM; TPPP(45–206), EC50 = 10.58 μM; TPPP(45–196), TPPP(45–186), TPPP(20–166), and TPPP-CORE curves and EC50 constants were determined by fitting to a hyperbola. Mean (points) and SEM (error bars) of three replicate bundling experiments for each TPPP concentration is shown.
Figure 2
Figure 2
TPPP bundling activity can be rewired by fusion to orthogonal condensate-forming sequences to construct synMAP proteins.A, strategy for rewiring TPPP activity using orthogonal IDR sequences to construct synMAPs. TPPP structured CORE domain (left) can act as a weak MT-binding domain but bundle formation requires the presence of one of the flanking intrinsically disordered regions (IDRs). Schematic of synMAP design (right): the IDRs of DDX4, FUS, FUSY27S (mutant), and LAF-1 were fused with TPPP-CORE domain as shown in table. These TPPP-IDR chimeras were tagged with GFP at their N terminus. B, TIRF and EM images showing the in vitro bundling behavior of native TPPP-FL and the isolated TPPP-CORE domain. Free microtubules are shown as a negative control. Scale bars represent 20 μm (TIRF images) and 200 nm (EM images). C, TIRF images showing that condensate-forming sequences (IDRs of DDX4, FUS, and LAF-1) do not interact with or bundle microtubules in vitro. Scale bars represent 20 μm. D, TIRF and EM images showing the in vitro bundling behavior of synMAP TPPP-IDR chimeras. Scale bars represent 20 μm (TIRF images) and 200 nm (EM images). E, representative fluorescent images of droplets formed by synMAP TPPP-IDR chimeras in vitro. Assays were performed at a protein concentration of 20 μM with 20 mM Hepes, 50 mM KCl, 3 mM DTT, and 12% dextran. Scale bars represent 10 μm. F, quantification of synMAP TPPP-IDR chimeras droplet fluorescence signal intensity. The mean was determined from data pooled from five different images. Droplet number was respectively: DDX4-CORE, n = 179; FUS-CORE, n = 57; FUSY27S-CORE, n = 11; LAF-1-CORE, n = 0; TPPP-CORE, n = 0. All synMAP TPPP-IDR chimeras were tested at the same concentration. N here refers to droplet number. G, MT bundling activity for the synMAP TPPP-IDR chimeras in (F) was quantified as an EC50 from full titration curves measuring the fraction of microtubules in bundles as a function of variant concentration. TPPP FL, EC50 = 0.54 μM, data was added as a point of comparison. DDX4-CORE, EC50 = 1.47 μM; FUS-CORE, EC50 = 5.92 μM; FUSY27S-CORE, and LAF-1-CORE curves and EC50 constants were determined by fitting to a hyperbola. Mean (points) and SEM (error bars) of three replicate bundling experiments for each TPPP concentration is shown.
Figure 3
Figure 3
Synthetic clustering of native TPPP fragments triggers microtubule binding, but not bundling, in cells.A, schematic diagram of constructs for blue-light triggered clustering of a TPPP fragment in cells by fusion to Cry2WT-mCh. B, representative images pre- and post- 5 min blue light activation for optical clustering of TPPP-CORE and the C-terminally IDR containing variant C-CORE in NIH3T3 cells (SiR-tubulin, green; Hoechst, blue). Scale bars represent 20 μm. For zoomed in insets of OptoTPPP C-CORE, scale bars represent 5 μm. C, schematic overview and quantification of light-induced cluster formation for different TPPP variants in cells. Clustering activity was scored by dividing cluster intensity (IC) by the total fluorescence (IW) of the whole cell. Values are expressed as means ± SEM. Cry2WT only, n = 12; FUS, n = 13; TPPP FL, n = 15; TPPPCcore(45–219), n = 15; TPPPNcore(1–166), n = 15; TPPP(1–206), n = 15; TPPP(45–206), n = 15; TPPP(1–196), n = 12; TPPP(45–196), n = 17; TPPP(1–186), n = 12; TPPP(45–186), n = 14; TPPP(1–176), n = 17; TPPP(45–176), n = 13; TPPPCORE(45–166), n = 12; TPPPN-term(1–44), n = 12; TPPPC-term(167–219), n = 12. Two-tailed Student t test; statistical differences: ∗∗∗∗, p < 0.0001; ∗∗∗ p < 0.001; n.s., not significant. N here refers to cell number. D, cluster disassembly kinetics in cells across different TPPP variants. Clusters were formed using a five-minute pulse of blue light. Following stimulation, the fraction of clusters remaining over time was tracked by normalization to this initial post-stimulation value. Values are expressed as means ± SEM. FUS, n = 6; TPPP FL, n = 6; TPPPCcore(45–219), n = 7; TPPP(1–206), n = 7; TPPP(45–206), n = 7; TPPP(1–196), n = 6; TPPP(45–196), n = 6. The curves were determined by fitting to a one-phase decay equation. N here refers to cell number.
Figure 4
Figure 4
synMAP TPPP-IDR condensates generate robust and tunable synthetic microtubule architectures in living cells.A, schematic diagram for the design of synMAP TPPP-IDR-FP-PixDE constructs. These are engineered to mimic the discrete and localized targeting of native TPPP to Golgi outposts in oligodendrocytes. B, representative image of a population of 3T3 cells expressing the TPPP-FUS-FusionRed-PixD and TPPP-FUS-Citrine-PixE synMAP design. SynMAPs condensates organize a diverse range of synthetic microtubule-bundled structures across various expression levels. Scale bar represents 60 μm. C, example image of a TPPP-FUS-PixDE synMAP driven nest-like MT architecture. Images are shown as a merge of the TPPP-FUS-FusionRed-PixD and TPPP-FUS-Citrine-PixE channels. Scale bars represent 20 μm. D, example image of a TPPP-FUS-PixDE synMAP-driven spear-like architecture. Images are shown as a merge of the TPPP-FUS-FusionRed-PixD and TPPP-FUS-Citrine-PixE channels. Scale bars represent 20 μm. E, example image showing a recently divided cell where a bundled MT-architecture has reformed at the site of separation, indicating synMAP structures are compatible with mitosis and cell division. Images are shown as a merge of the TPPP-FUS-FusionRed-PixD and TPPP-FUS-Citrine-PixE channels. Scale bars represent 20 μm. F, example epifluorescence images of microtubule architectures driven by synMAP TPPP-IDR condensates that differ in the identity of the condensate-forming IDR sequence. TPPP-PixDE (negative control), TPPP-DDX4-PixDE, TPPP-FUS-PixDE, and TPPP-LAF-1-PixDE images are shown as merged images of the synMAP (red) and SiR-tubulin (green) channels. Scale bars represent 20 μm. G, quantification of synMAP bundling activity generated by the constructs in (F), defined by the normalized intensity of SiR-tubulin signal near the cell center. Data for TPPP-PixDE (control) or different synMAP TPPP-IDR condensates are shown (mean ± SEM, TPPP-PixDE, n = 3; TPPP-DDX4-PixDE, n = 3; TPPP-FUS-PixD, n = 3; TPPP-LAF-1-PixDE, n = 3). N here refers to cell number. H, quantification of exchange dynamics within different synMAP-driven MT bundles, derived from FRAP recovery curves acquired by confocal microscopy. Points within the curve reflect the mean ± SEM: TPPP-DDX4-PixDE, n = 13; TPPP-FUS-PixDE, n = 14; TPPP-LAF-1-PixDE, n = 14. The dynamic recovery curves are derived from nonlinear curve fitting based on the one-phase association equation model. Related to (Fig. S5) N here refers to the number of cells on which the FRAP was performed.
Figure 5
Figure 5
Engineered circuits can trigger synthetic microtubule architectures by regulating the connection between synMAP’s TPPP and IDR components.A, schematic of cytoskeletal circuit designs that inducibly connect TPPP to IDR-droplet hubs, mimicking the discrete and localized targeting of native TPPP to Golgi outposts in oligodendrocytes. The system is based on the rapamycin-inducible dimerization pair FKBP/FRB. FRB-IDRs are fused to PixD/E-containing fluorescent proteins (FusionRed and Citrine) to produce constitutive droplets, and FKBP is fused to TPPP tagged with tagBFP. Upon rapamycin treatment, a synMAP’s MT binding and IDR components become connected to stimulate the assembly of higher-order MT structures. B, representative images of NIH3T3 cells cotransduced with an inducible synMAP circuit (FRB-DDX4-PixDE and TPPP-FKBP) before and after (12 h) rapamycin treatment. The addition of rapamycin (20 μM) rapidly translocated the TPPP component (tagBFP, white color in image) into DDX4 condensates (FusionRed, red) to initiate microtubule bundling (SiR-tubulin, green). Scale bar represents 20 μm. C, images from a time series of the rapamycin-induced synMAP circuit from (B). Microtubule lattices were directly visualized with SiR-tubulin (green). Zoom view (upper) shows the time series for early stages (0–30 min) post rapamycin induction, in which connection of TPPP fragments to condensates causes deformation and wetting of synMAPs onto microtubules. Over several hours, these structures coalesce into larger bundled architectures that resemble those formed by synMAPs that directly fuse the IDR and MT interacting components (bottom). Scale bar represents 10 μm. (see also Video S4). D, quantification of the rapamycin-inducible synMAP circuit in (B)-(C) over time. (left) Line profiles showing MT distribution (normalized SiR-tubulin fluorescence) as a function of the distance from the cell center reveal how microtubules are organized into bundled architectures near the cell-center over time. The line profile for each time point is used to generate a trajectory (right) showing the single-cell MT bundling dynamics (normalized intensity of SiR-tubulin signal at the cell center) generated by the synMAP circuit over time. Data are shown as (mean ± SEM, n = 24 cells). E, schematic for studying synMAP circuit dynamics following nocodazole-induced microtubule depletion. F, inducible synMAP circuits (TPPP-DDX4 design) can nucleate microtubule aster formation following nocodazole treatment as shown in (E). (left) Representative image showing SiR-tubulin colocalization with synMAP (FusionRed, red) droplets in cells treated with nocodazole (30 μM) for 6 h. No microtubules are present at this time. Scale bar represents 20 μm. (right) Live-cell images of synMAP circuit behavior following nocodazole washout. Images show microtubule aster formation (arrows) originating from synMAP TPPP-DDX4 condensates over time. Scale bar represents 5 μm. G, schematic for a synMAP circuit in which microtubule architecture is regulated by PKA signaling activity. A PKA substrate was fused to the condensate-forming DDX4-PixDE component and co-expressed with a TPPP-FHA1 (binds phosphorylated PKA substrate) or TPPP (negative control) component in NIH3T3 cells. When the PKA substrate is phosphorylated in response to cell-signaling inputs, TPPP will be connected to the IDR component to stimulate synMAP circuit activity. H, demonstration of the PKA-regulated synMAP circuit design from (G). Cells were stimulated with isoprenaline and imaged for 135 min. Isoprenaline was then washed out and the cells were further imaged for another 135 min. The circuit’s bundling dynamics were quantified as in (D). Data are shown as (mean ± SEM, PKAsub-DDX4-PixDE/TPPP-FHA1, n = 3; PKAsub-DDX4-PixDE/TPPP, n = 3). N here refers to cell number.
Figure 6
Figure 6
Microtubule interaction strength and IDR potency provide a two-level control scheme for tuning inducible synMAP bundling circuits in cells.A, schematic depicting strategy for systematically varying the condensate-forming component (IDR sequence) of an inducible synMAP TPPP-IDR circuit. B, representative images from NIH3T3 cells (FusionRed, white color in images) showing the size and distribution of the IDR-droplet component of the different synMAP circuits. Scale bar represents 20 μm. C, quantification of the IDR-droplet components from (B), based on FusionRed fluorescence signal intensity in NIH3T3 cells. Median intensity is indicated from measurements from 39, 40, and 35 representative cells, with total droplet numbers respectively: FRB-DDX4-PixDE, n = 182; FRB-FUS-PixDE, n = 843; FRB-LAF-1-PixDE, n = 354. From these data, an average number of droplets per cell was also determined as follows: FRB-DDX4-PixD = 4.1 drops/cell, FRB-FUS-PixDE = 21.1 drops/cell, and FRB-LAF-1-PixDE = 10.1 drops/cell. N here refers to droplet number. D, quantification of synMAP circuit induction for the panel of IDR-varying designs from (A), using the method described in Fig. 5D. Data are shown as (mean ± SEM, FRB-DDX4-PixDE/TPPP-FL-FKBP, n = 24; FRB-FUS-PixDE/TPPP-FL-FKBP, n = 27; FRB-LAF-1-PixDE/TPPP-FL-FKBP, n = 31). Related to (Fig. S8). N here refers to cell number. E, schematic depicting strategy for systematically varying the microtubule-interaction component (TPPP variant) of an inducible synMAP TPPP-IDR circuit. F, quantification of synMAP circuit induction for the panel of TPPP-varying designs from (E), using the method described in Figure 5D. Data are shown as (mean ± SEM, TPPP-FL-FKBP/FRB-DDX4-PixDE, n = 24; TPPPCcore-FKBP/FRB-DDX4-PixDE, n = 16; TPPPNcore-FKBP/FRB-DDX4-PixDE, n = 15; TPPP(45–206)-FKBP/FRB-DDX4-PixDE, n = 12; TPPP(45–196)-FKBP/FRB-DDX4-PixDE, n = 12; TPPP(45–186)-FKBP/FRB-DDX4-PixDE, n = 18; TPPP(45–176)-FKBP/FRB-DDX4-PixDE, n = 26; TPPP(20–166)-FKBP/FRB-DDX4-PixDE, n = 15; TPPP-CORE-FKBP/FRB-DDX4-PixDE, n = 36). Related to (Fig. S9). N here refers to cell number.

Update of

Similar articles

Cited by

References

    1. Vale R.D. The molecular motor Toolbox for Intracellular Transport. Cell. 2003;112:467–480. - PubMed
    1. Nogales E. Structural insights into microtubule function. Annu. Rev. Biophys. Biomol. Struct. 2001;30:397–420. - PubMed
    1. Olmsted J.B. Microtubule-associated proteins. Annu. Rev. Cell Biol. 1986;2:421–457. - PubMed
    1. Haimo L.T., Rosenbaum J.L. Cilia, flagella, and microtubules. J. Cell Biol. 1981;91:125s–130s. - PMC - PubMed
    1. Goodson H.V., Jonasson E.M. Microtubules and microtubule-associated proteins. Cold Spring Harb. Perspect. Biol. 2018;10:a022608. - PMC - PubMed

MeSH terms

Substances

LinkOut - more resources