

Drug-induced senescence by aurora kinase inhibitors attenuates innate immune response of macrophages on gastric cancer organoids
- PMID: 38992487
- PMCID: PMC11364160
- DOI: 10.1016/j.canlet.2024.217106
Drug-induced senescence by aurora kinase inhibitors attenuates innate immune response of macrophages on gastric cancer organoids
Erratum in
-
Corrigendum to "Drug-induced senescence by aurora kinase inhibitors attenuates innate immune response of macrophages on gastric cancer organoids" [Cancer Lett. 598 (2024) 217106].Cancer Lett. 2024 Aug 28;598:217127. doi: 10.1016/j.canlet.2024.217127. Epub 2024 Jul 31. Cancer Lett. 2024. PMID: 39084933 Free PMC article. No abstract available.
Abstract
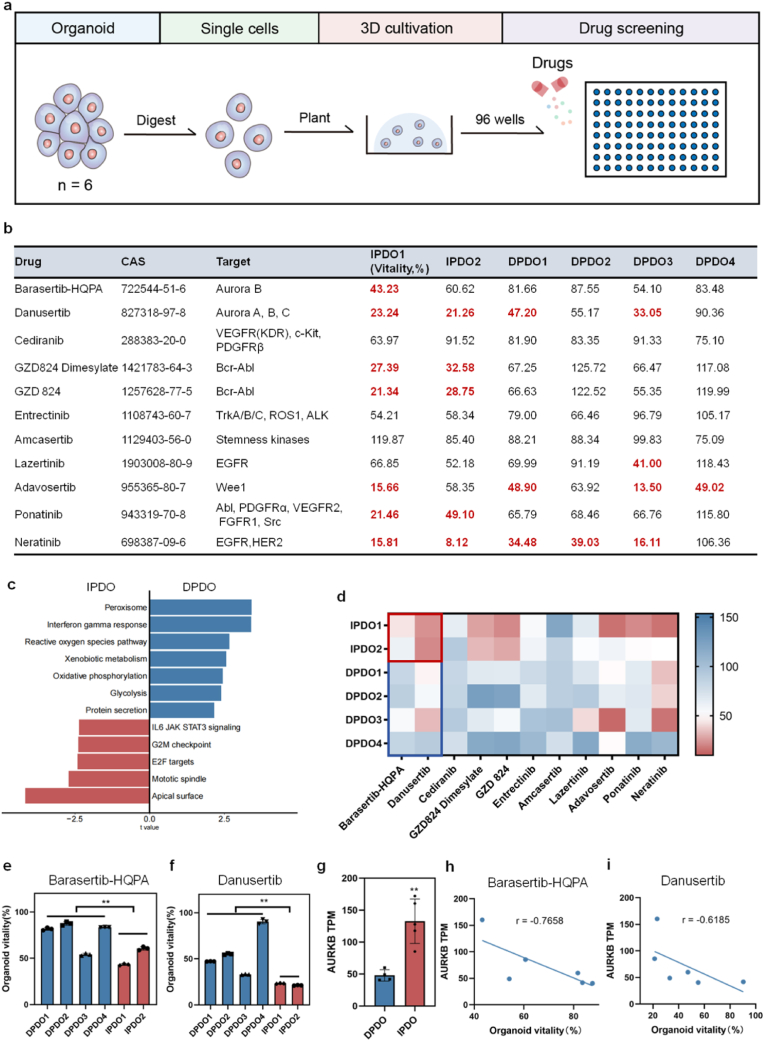
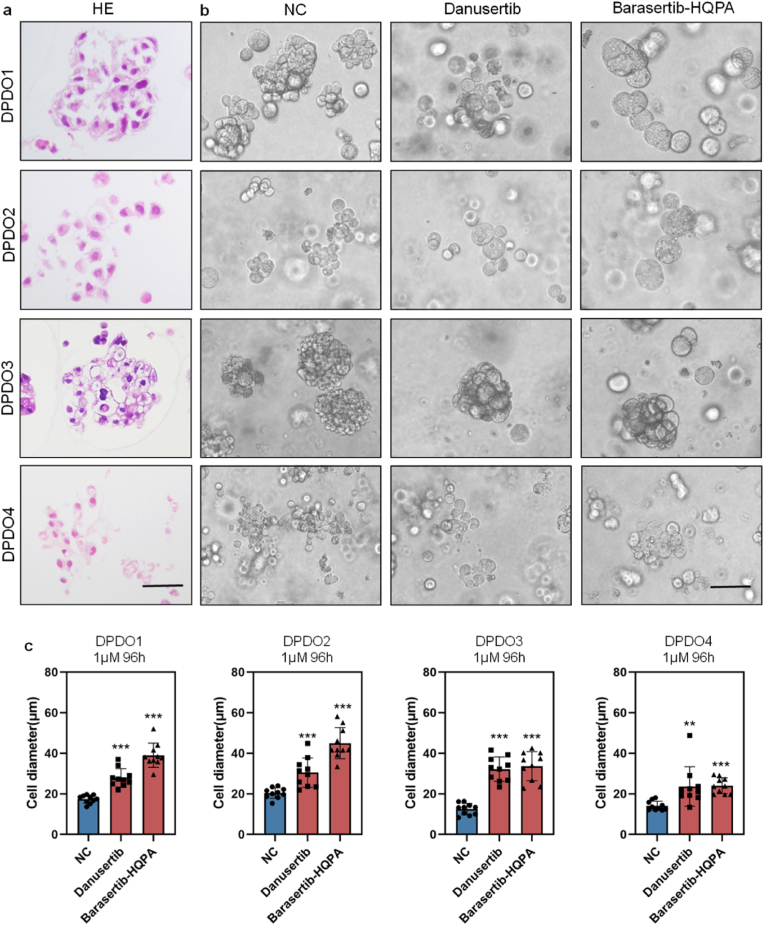
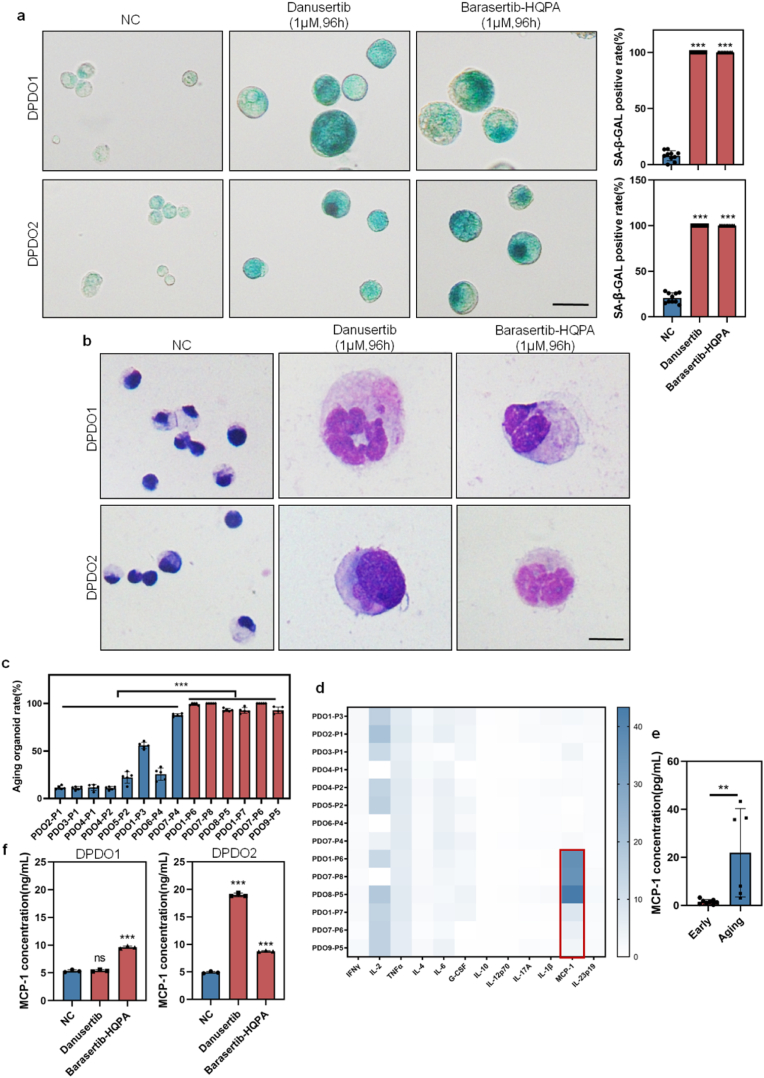
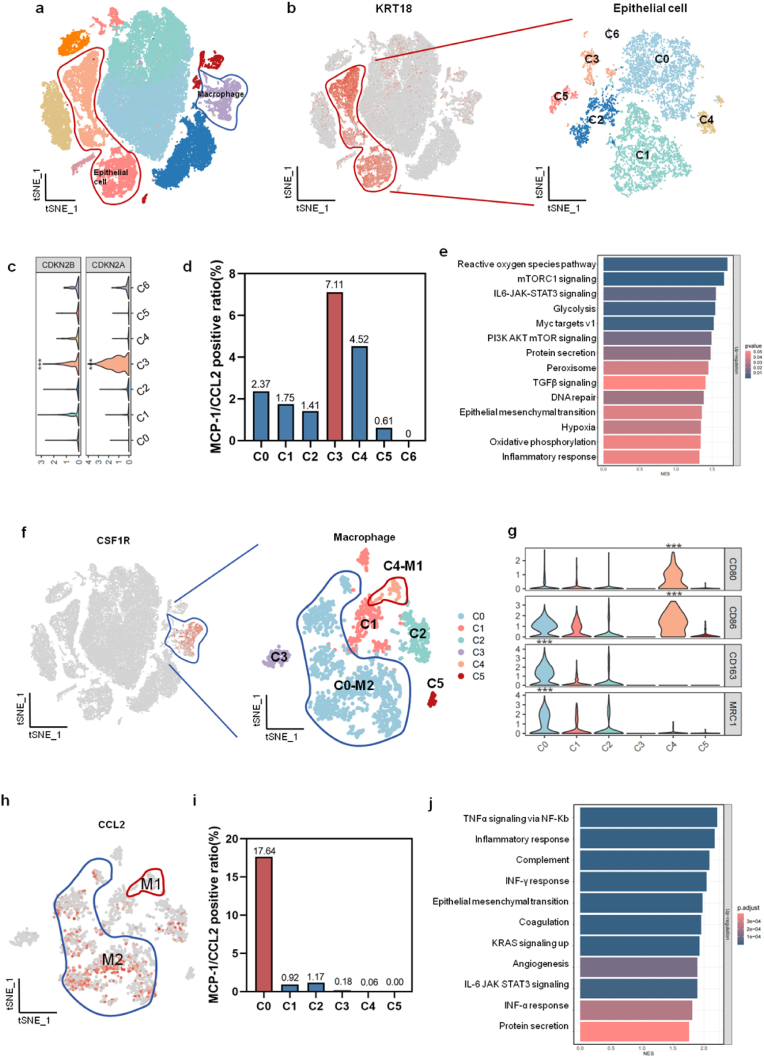
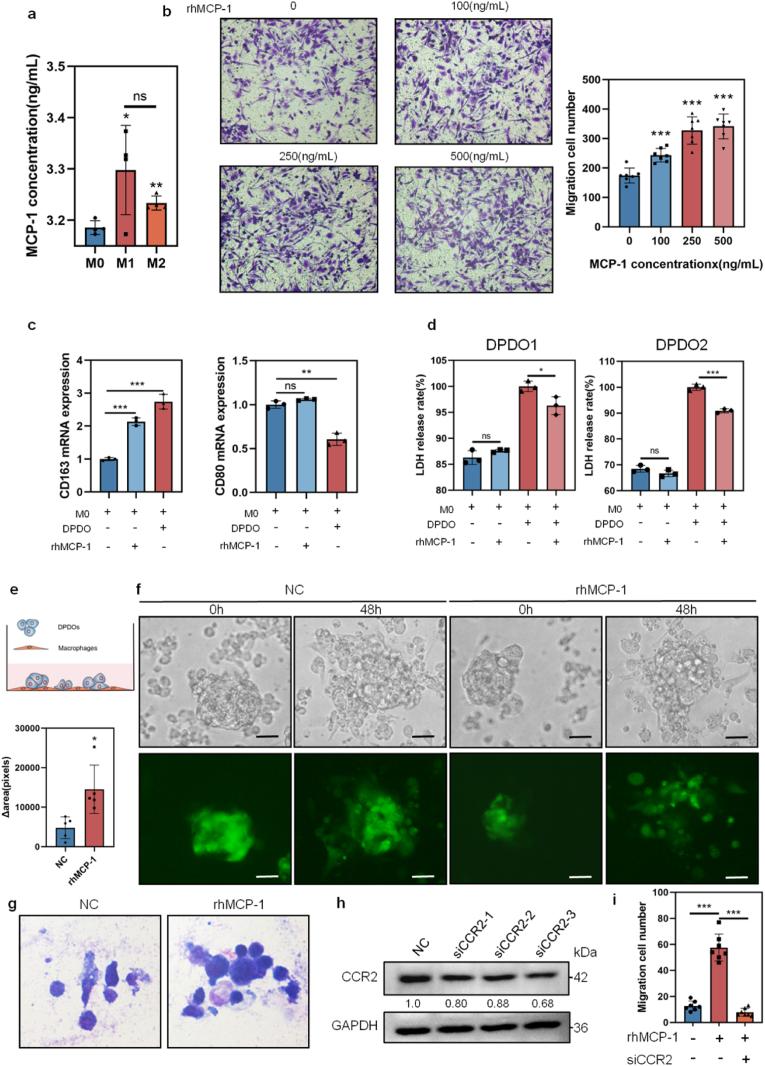
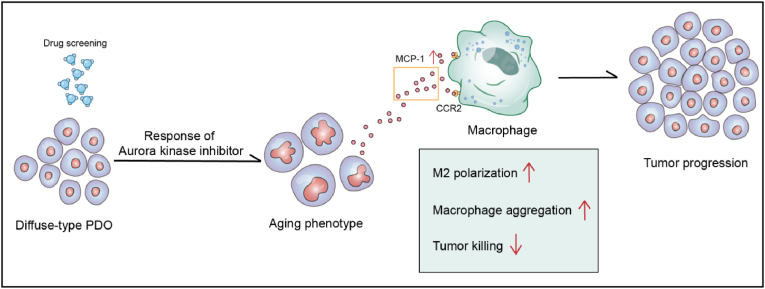
Diffuse-type gastric cancer (DGC) is a subtype of gastric cancer with aggressiveness and poor prognosis. It is of great significance to find sensitive drugs for DGC. In the current study, a total of 20 patient-derived organoids (PDOs) were analyzed for screening the therapeutic efficacy of small molecule kinases inhibitors on gastric cancers, especially the therapeutic difference between intestinal-type gastric cancer (IGCs) and DGCs. The IGCs are sensitive to multiple kinases inhibitors, while DGCs are resistant to most of these kinases inhibitors. It was found that DGCs showed drug-induced senescent phenotype after treatment by aurora kinases inhibitors (AURKi) Barasertib-HQPA and Danusertib. The cell diameter of cancer cells are increased with stronger staining of senescence-associated β-galactosidase (SA-β-GAL), and characteristic appearance of multinucleated giant cells. The senescent cancer cells secrete large amounts of chemokine MCP-1/CCL2, which recruit and induce macrophage to M2-type polarization in PDOs of DGC (DPDOs)-macrophage co-culture system. The up-regulation of local MCP-1/CCL2 can interact with MCP-1/CCL2 receptor (CCR2) expressed on macrophages and suppress their innate immunity to cancer cells. Overall, the special response of DGC to AURKi suggests that clinicians should select a sequential therapy with senescent cell clearance after AURKi treatment for DGC.
Keywords: AURK; Drug screening; Gastric cancer; Immunosuppressive; Patient-derived organoids.
Copyright © 2024. Published by Elsevier B.V.
Conflict of interest statement
Declaration of competing interest The authors declare that they have no known competing financial interests or personal relationships that could have appeared to influence the work reported in this paper.
Figures
Similar articles
-
Danusertib, a potent pan-Aurora kinase and ABL kinase inhibitor, induces cell cycle arrest and programmed cell death and inhibits epithelial to mesenchymal transition involving the PI3K/Akt/mTOR-mediated signaling pathway in human gastric cancer AGS and NCI-N78 cells.Drug Des Devel Ther. 2015 Mar 2;9:1293-318. doi: 10.2147/DDDT.S74964. eCollection 2015. Drug Des Devel Ther. 2015. PMID: 25767376 Free PMC article.
-
Senescent Fibroblasts Potentiate Peritoneal Metastasis of Diffuse-type Gastric Cancer Cells via IL-8-mediated Crosstalk.Anticancer Res. 2024 Jun;44(6):2497-2509. doi: 10.21873/anticanres.17056. Anticancer Res. 2024. PMID: 38821603
-
Preclinical evaluation of the Aurora kinase inhibitors AMG 900, AZD1152-HQPA, and MK-5108 on SW-872 and 93T449 human liposarcoma cells.In Vitro Cell Dev Biol Anim. 2018 Jan;54(1):71-84. doi: 10.1007/s11626-017-0208-4. Epub 2017 Dec 1. In Vitro Cell Dev Biol Anim. 2018. PMID: 29197031
-
Aurora Kinase Inhibitors in Head and Neck Cancer.Curr Top Med Chem. 2018;18(3):199-213. doi: 10.2174/1568026618666180112163741. Curr Top Med Chem. 2018. PMID: 29332580 Review.
-
Aurora kinase inhibitors: a patent review (2014-2020).Expert Opin Ther Pat. 2021 Jul;31(7):625-644. doi: 10.1080/13543776.2021.1890027. Epub 2021 Apr 13. Expert Opin Ther Pat. 2021. PMID: 33573401 Review.
Cited by
-
The application of organoids in investigating immune evasion in the microenvironment of gastric cancer and screening novel drug candidates.Mol Cancer. 2025 Apr 26;24(1):125. doi: 10.1186/s12943-025-02328-4. Mol Cancer. 2025. PMID: 40287758 Free PMC article. Review.
-
Beyond polarization: macrophage senescence in immunoregulation and cancer therapy.Int J Biol Sci. 2025 Jun 23;21(10):4312-4333. doi: 10.7150/ijbs.115921. eCollection 2025. Int J Biol Sci. 2025. PMID: 40765820 Free PMC article. Review.
-
In vitro senescence and senolytic functional assays.Biomater Sci. 2025 Jun 25;13(13):3509-3531. doi: 10.1039/d4bm01684j. Biomater Sci. 2025. PMID: 40375674 Review.
-
Living biobank: Standardization of organoid construction and challenges.Chin Med J (Engl). 2024 Dec 20;137(24):3050-3060. doi: 10.1097/CM9.0000000000003414. Epub 2024 Dec 12. Chin Med J (Engl). 2024. PMID: 39663560 Free PMC article. Review.
-
Identifying Sex Differences in Lung Adenocarcinoma Using Multi-Omics Integrative Protein Signaling Networks.bioRxiv [Preprint]. 2025 Feb 7:2025.02.03.636354. doi: 10.1101/2025.02.03.636354. bioRxiv. 2025. PMID: 39975108 Free PMC article. Preprint.
References
-
- Sung H., Ferlay J., Siegel R.L., Laversanne M., Soerjomataram I., Jemal A., Bray F. Global cancer statistics 2020: GLOBOCAN estimates of incidence and mortality worldwide for 36 cancers in 185 countries. CA A Cancer J. Clin. 2021;71:209–249. - PubMed
-
- Usui Y., Taniyama Y., Endo M., Koyanagi Y.N., Kasugai Y., Oze I., Ito H., Imoto I., Tanaka T., Tajika M., Niwa Y., Iwasaki Y., Aoi T., Hakozaki N., Takata S., Suzuki K., Terao C., Hatakeyama M., Hirata M., Sugano K., Yoshida T., Kamatani Y., Nakagawa H., Matsuda K., Murakami Y., Spurdle A.B., Matsuo K., Momozawa Y. Helicobacter pylori, homologous-recombination genes, and gastric cancer. N. Engl. J. Med. 2023;388:1181–1190. - PubMed
-
- Feng W., Ma C., Rao H., Zhang W., Liu C., Xu Y., Aji R., Wang Z., Xu J., Gao W.Q., Li L. Setd2 deficiency promotes gastric tumorigenesis through inhibiting the SIRT1/FOXO pathway. Cancer letters. 2023;579 - PubMed
-
- Thrift A.P., Wenker T.N., El-Serag H.B. Global burden of gastric cancer: epidemiological trends, risk factors, screening and prevention. Nat. Rev. Clin. Oncol. 2023;20:338–349. - PubMed
-
- Smyth E.C., Nilsson M., Grabsch H.I., van Grieken N.C., Lordick F. Gastric cancer. Lancet. 2020;396:635–648. - PubMed
MeSH terms
Substances
Grants and funding
LinkOut - more resources
Full Text Sources
Medical
Miscellaneous
