

SimSpliceEvol2: alternative splicing-aware simulation of biological sequence evolution and transcript phylogenies
- PMID: 38992593
- PMCID: PMC11238459
- DOI: 10.1186/s12859-024-05853-z
SimSpliceEvol2: alternative splicing-aware simulation of biological sequence evolution and transcript phylogenies
Abstract
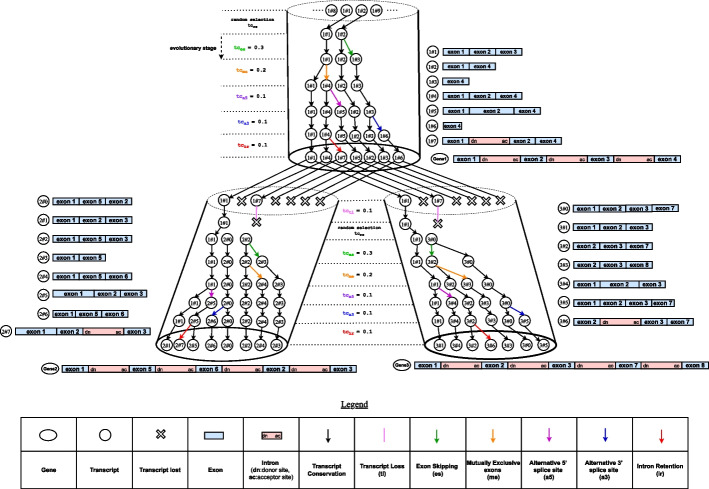
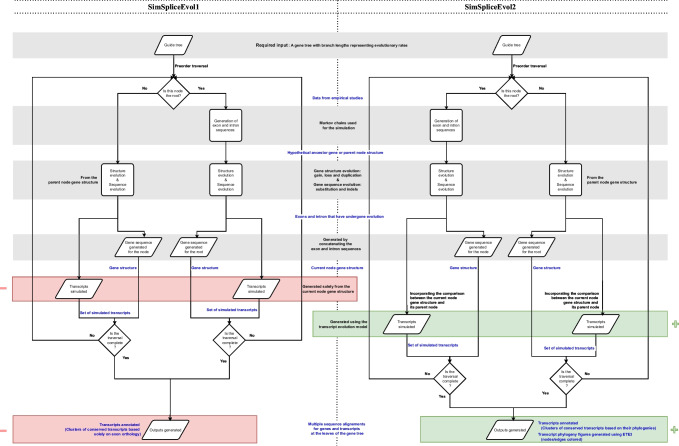
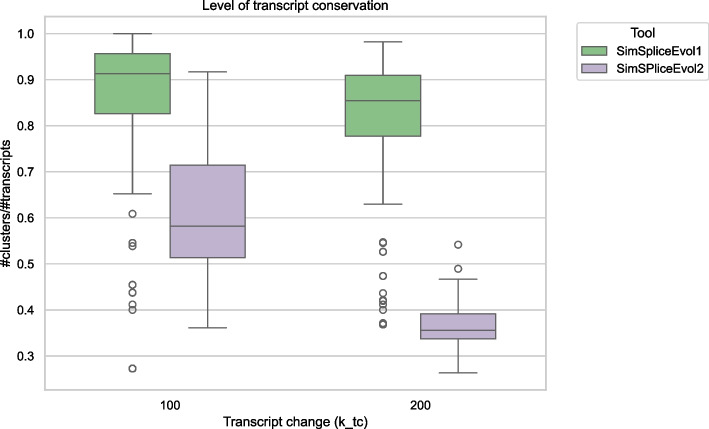
Background: SimSpliceEvol is a tool for simulating the evolution of eukaryotic gene sequences that integrates exon-intron structure evolution as well as the evolution of the sets of transcripts produced from genes. It takes a guide gene tree as input and generates a gene sequence with its transcripts for each node of the tree, from the root to the leaves. However, the sets of transcripts simulated at different nodes of the guide gene tree lack evolutionary connections. Consequently, SimSpliceEvol is not suitable for evaluating methods for transcript phylogeny inference or gene phylogeny inference that rely on transcript conservation.
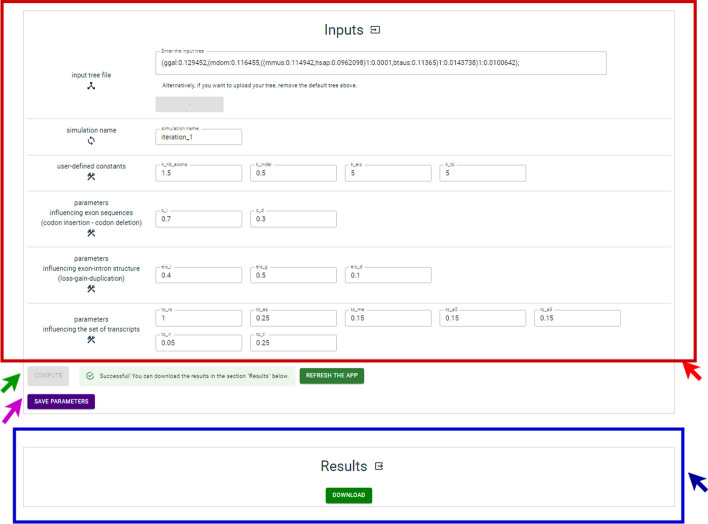
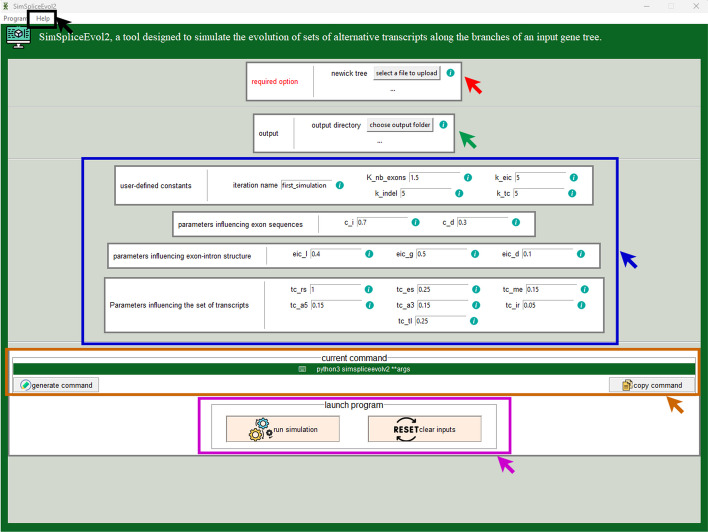
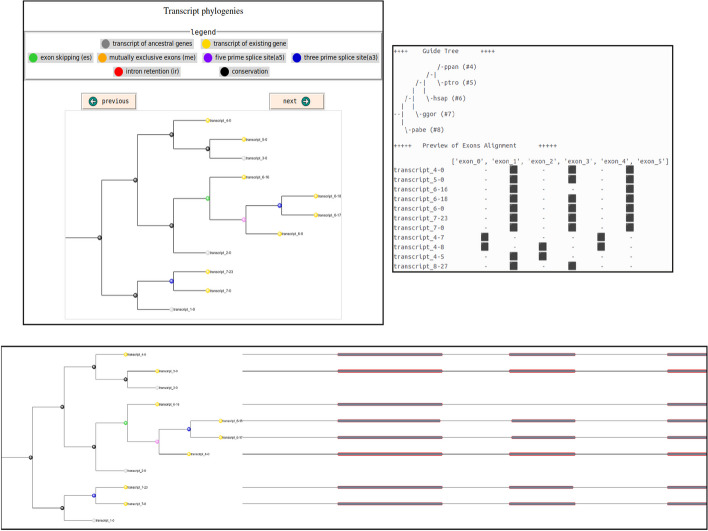
Results: Here, we introduce SimSpliceEvol2, which, compared to the first version, incorporates an explicit model of transcript evolution for simulating alternative transcripts along the branches of a guide gene tree, as well as the transcript phylogenies inferred. We offer a comprehensive software with a graphical user interface and an updated version of the web server, ensuring easy and user-friendly access to the tool.
Conclusion: SimSpliceEvol2 generates synthetic datasets that are useful for evaluating methods and tools for spliced RNA sequence analysis, such as spliced alignment methods, methods for identifying conserved transcripts, and transcript phylogeny reconstruction methods. The web server is accessible at https://simspliceevol.cobius.usherbrooke.ca , where you can also download the standalone software. Comprehensive documentation for the software is available at the same address. For developers interested in the source code, which requires the installation of all prerequisites to run, it is provided at https://github.com/UdeS-CoBIUS/SimSpliceEvol .
Keywords: Alternative splicing; Evolution; Exon-intron structure; Simulation; Transcript phylogeny.
© 2024. The Author(s).
Conflict of interest statement
Not applicable.
Figures
Similar articles
-
SimSpliceEvol: alternative splicing-aware simulation of biological sequence evolution.BMC Bioinformatics. 2019 Dec 17;20(Suppl 20):640. doi: 10.1186/s12859-019-3207-5. BMC Bioinformatics. 2019. PMID: 31842741 Free PMC article.
-
TranscriptDB: a transcript-centric database to study eukaryotic transcript conservation and evolution.Nucleic Acids Res. 2025 Jan 6;53(D1):D1235-D1242. doi: 10.1093/nar/gkae995. Nucleic Acids Res. 2025. PMID: 39530236 Free PMC article.
-
SplicedFamAlign: CDS-to-gene spliced alignment and identification of transcript orthology groups.BMC Bioinformatics. 2019 Mar 29;20(Suppl 3):133. doi: 10.1186/s12859-019-2647-2. BMC Bioinformatics. 2019. PMID: 30925859 Free PMC article.
-
DoubleRecViz: a web-based tool for visualizing transcript-gene-species tree reconciliation.Bioinformatics. 2021 Jul 27;37(13):1920-1922. doi: 10.1093/bioinformatics/btaa882. Bioinformatics. 2021. PMID: 33051656
-
Differentiated evolutionary rates in alternative exons and the implications for splicing regulation.BMC Evol Biol. 2006 Jun 22;6:50. doi: 10.1186/1471-2148-6-50. BMC Evol Biol. 2006. PMID: 16792801 Free PMC article.
Cited by
-
Toward a comprehensive profiling of alternative splicing proteoform structures, interactions and functions.Curr Opin Struct Biol. 2025 Feb;90:102979. doi: 10.1016/j.sbi.2024.102979. Epub 2025 Jan 7. Curr Opin Struct Biol. 2025. PMID: 39778413 Free PMC article. Review.
-
Alternative Splicing in Tumorigenesis and Cancer Therapy.Biomolecules. 2025 May 29;15(6):789. doi: 10.3390/biom15060789. Biomolecules. 2025. PMID: 40563429 Free PMC article. Review.
References
MeSH terms
Grants and funding
LinkOut - more resources
Full Text Sources
