. 2024 Jul 11;18(1):39.
doi: 10.1186/s13036-024-00434-3.

Isolation methods and characterization of primary rat neurovascular cells

Affiliations

Isolation methods and characterization of primary rat neurovascular cells

Sydney Floryanzia et al. J Biol Eng. .

Abstract

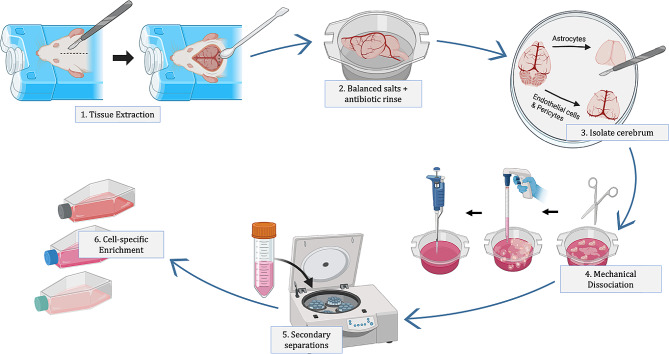
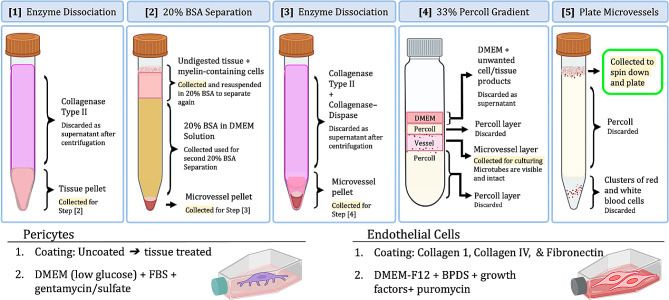
Background: There is significant interest in isolating cells of the blood-brain barrier (BBB) for use in in vitro screening of therapeutics and analyzing cell specific roles in neurovascular pathology. Primary brain cells play an advantageous role in BBB models; however, isolation procedures often do not produce cells at high enough yields for experiments. In addition, although numerous reports provide primary cell isolation methods, the field is lacking in documentation and detail of expected morphological changes that occur throughout culturing and there are minimal troubleshooting resources. Here, we present simplified, robust, and reproducible methodology for isolating astrocytes, pericytes, and endothelial cells, and demonstrate several morphological benchmarks for each cell type throughout the process and culture timeframe. We also analyze common considerations for developing neurovascular cell isolation procedures and recommend solutions for troubleshooting.

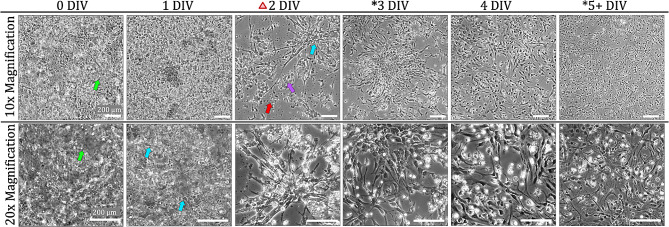
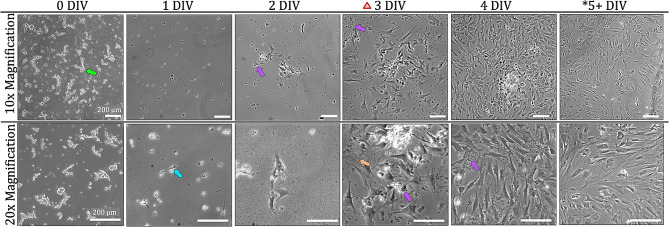
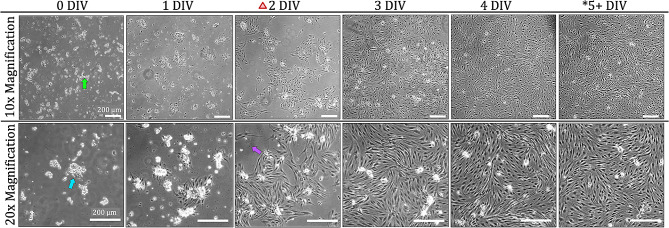
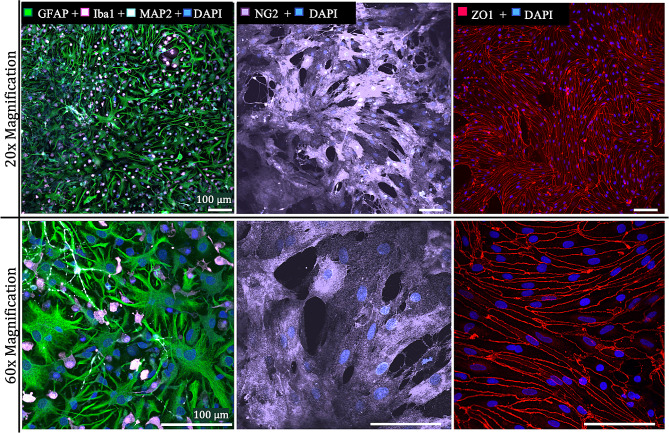
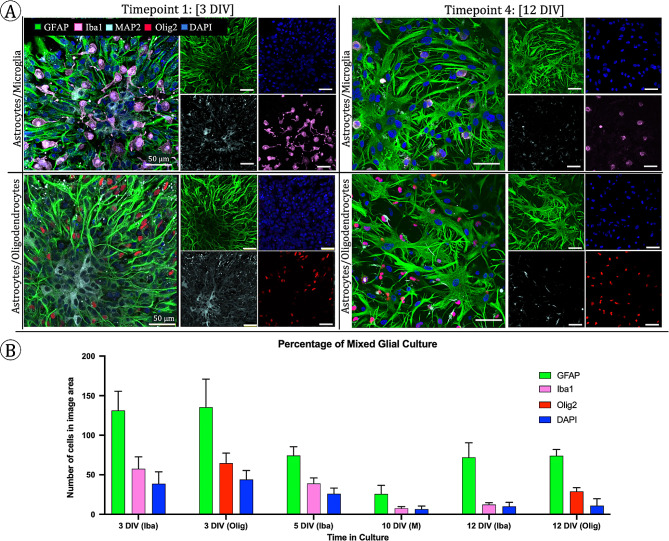
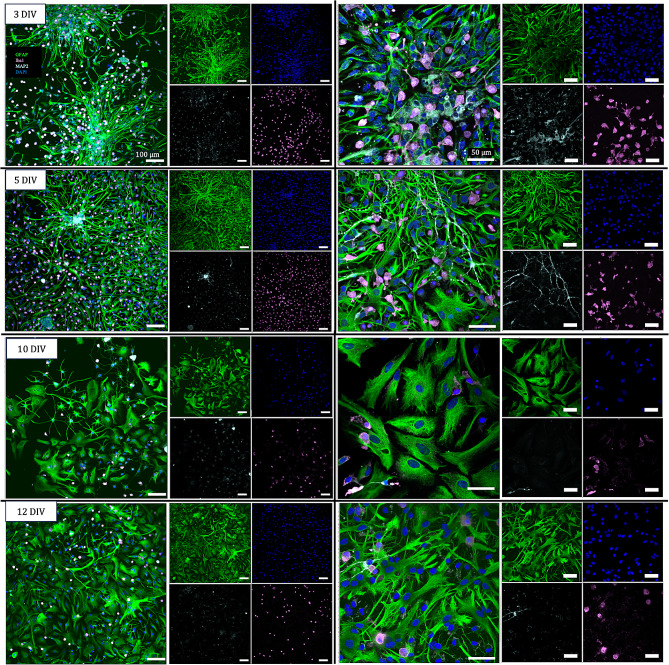
Results: The presented methodology isolated astrocytes, pericytes, and endothelial cells and enabled cell attachment, maturation, and cell viability. We characterized milestones in cell maturation over 12 days in culture, a common timeline for applications of these cell types in BBB models. Phase contrast microscopy was used to show initial cell plating, attachment, and daily growth of isolated cells. Confocal microscopy images were analyzed to determine the identity of cell types and changes to cell morphology. Nuclear staining was also used to show the viability and proliferation of glial cells at four time points. Astrocyte branches became numerous and complex with increased culture time. Microglia, oligodendrocytes, and neurons were present in mixed glial cultures for 12 days, though the percentage of microglia and neurons expectedly decreased after passaging, with microglia demonstrating a less branched morphology.

Conclusions: Neurovascular cells can be isolated through our optimized protocols that minimize cell loss and encourage the adhesion and proliferation of isolated cells. By identifying timepoints of viable glia and neurons within an astrocyte-dominant mixed culture, these cells can be used to evaluate drug targeting, uptake studies, and response to pathological stimulus in the neurovascular unit.

Keywords: Astrocytes; Endothelial cells; Pericytes; Primary blood-brain barrier cell isolation.


Conflict of interest statement

The authors declare no competing interests.

Figures

Fig. 1
Fig. 1
General overview for primary neurovascular cell isolation. The isolation procedure for astrocytes, pericytes, and endothelial cells, generally follows a similar sequence of five steps: (1) Tissue Extraction; starting with extracting the tissue following euthanasia, (2) Antibiotic Rinse; an introduction to antibiotic media, (3) Cerebral Isolation; by removing the meninges, olfactory bulb, and cerebellum, (4) Using mechanical dissociation techniques, (5) Additional Separations; to start separating specific cell types and (6) Cell enrichment; encouraging specific cell adhesion and proliferation through media components and surface coatings. Steps 1–4 produce a single cell suspension from brain tissue while Steps 5 and 6 produce specific cell types. This figure was created with Biorender.com
Fig. 2
Fig. 2
Summary of critical microvascular isolation steps. Through the microvascular isolation procedure, five critical steps greatly influence the effectiveness and yield of each cell type. Cells can be over-dissociated or digested during Step [1] which would be evidenced in Step [2]. Step [2] can be run again to ensure all vascular cells are captured. Similar risks of Step [1] exist at Step [3]. The final product of Step [3] is a mixed vascular pellet that is further separated at Step [4]. Four distinct layers with visible vascular fragments should be seen at Step [4]. The vascular layers in Step [4] are further separated at Step [5] where the top layer contains the endothelial cells and pericytes. To enrich for pericytes, plates should be uncoated. Collagen and fibronectin coatings are needed for endothelial cell attachment and proliferation. This figure was created with Biorender.com
Fig. 3
Fig. 3
Astrocyte growth in culture: Single cell suspensions are visible (green arrow) even without using enzymatic digestion in the isolation process. At 1 DIV, small cell somas can be seen attached to the bottom of the plate with 1–2 branches beginning to form. By 2 DIV, the first media change is completed as indicated by the red triangle icon. Cell debris from dying non-astrocyte cells are depicted by red arrows. Other non-attached cells can be seen (purple arrow). The blue arrow shows many cell bodies growing in the same area forming snowflake-like clusters. These clusters can be seen extending through culture days. At 5 DIV, cells are passaged, and morphology remains heterogeneous, but does not change with more time in culture. Asterisks indicate timepoints where confocal imaging was completed. Scale bars in all images: 200 μm
Fig. 4
Fig. 4
Pericyte growth in culture. Immediately after isolation cell clusters are visible (green arrow), where individual cells are distinctly visible, but microtubules remain intact. At 1 DIV, a few small cell somas can be seen attached to the bottom of the plate. By 2 DIV, the first media change is completed as indicated by the red triangle icon. Pericyte-specific morphology is seen as early as 2 DIV characterized by polygonal cells with finger projections. Cell debris (purple arrow) from dying non-pericyte and other non-attached cells are visible in areas of the plate where cells are not attached whereas the spaces between attached cells are clear. Extensions of pericyte processes (orange arrow) are visible as pericytes attempt to form connections among other pericytes. At 7 DIV, cells are passaged, and morphology does not significantly change with more time in culture, cells become larger, flatter, and proliferate. Asterisks indicate timepoints where confocal imaging was completed. Scale bars in all images: 200 μm
Fig. 5
Fig. 5
Endothelial growth in culture. Immediately after isolation, cell clusters are visible (green arrow), where individual cells are distinctly visible, but microtubules remain intact. 2 h after isolation 0 DIV, cell somas (blue arrow) can be seen attached to the bottom of the plate around the cell clusters. By 2 DIV, the first media change is completed, indicated by the red triangle icon. Endothelial-specific morphology is seen as early as 0 DIV characterized by cells growing in circular patterns extremely close to one another. At 1 DIV, cell debris from dying non-endothelial and other non-attached cells are visible (purple arrow). Each endothelial cluster grows and extends to combine with other clusters. Depending on plating concentration, cells reach confluency and can be frozen as early as 5 DIV. Morphology does not change between 0 DIV and 1 DIV, cells simply become longer with the same phenotype with increased culture time. Scale bars in all images: 200 μm
Fig. 6
Fig. 6
Immunocytostaining for cell identity. Left: GFAP + astrocytes (green), Iba1 + microglia (pink), and MAP2 + neurons (cyan) are presented in culture at 12 DIV. Middle: NG2 + pericytes (purple) show rhomboid phenotype with cells growing on top of one another in multiple Z planes at 12 DIV. Right: ZO-1 + endothelial tight junctions (red) form between endothelial cells at 5 DIV. All visible nuclei are DAPI+ (blue). Scale bars in all images: 100 μm
Fig. 7
Fig. 7
Presence of microglia, neurons, and oligodendrocytes. (A) Top: GFAP + astrocytes (green), Iba1 + microglia (pink), and MAP2 + neurons (cyan) are presented in culture at 3 DIV and 12 DIV. Microglia are visible in both time points but decrease in percentage and change morphology to become less branched at 12 DIV. Bottom: GFAP + astrocytes (green), Olig2 + oligodendrocytes (red), and MAP2 + neurons (cyan) are present in culture at 3 DIV and 12 DIV. The relative number of Olig2 + cells does not appear to change between timepoints. In both images at 3 DIV, some MAP2 + neurons are visible with the number and size of neurons decreasing by 12 DIV. All visible nuclei are DAPI+ (blue). Scale bars in all images: 50 μm. (B) Glial populations are mostly astrocytes at each time point with the fraction of microglia to total cells decreasing at 10 DIV and 12 DIV and the fraction of oligodendrocytes to astrocytes remaining relatively constant. The DAPI refers to all nuclei that is neither one of the two other cell types analyzed in each group
Fig. 8
Fig. 8
Glial distribution and morphology over time. GFAP + astrocytes (green), Iba1 + microglia (pink), and MAP2 + neurons (cyan) are present in culture at 3 DIV, 5 DIV, 10 DIV, and 12 DIV. At 3 DIV, large clusters of individual astrocytes are seen. Astrocytes are relatively simplistic in shape mostly with a branch extending on each end on the nucleus. Microglia at 3 DIV have different degrees of branching. At 5 DIV, cells begin to have > 2 branches while large clusters of individual astrocytes remain. Simplistic astrocytes are seen along with more mature astrocytes with thicker, more fibrous cell bodies with multiple branches. Microglia at both 3 DIV and 5 DIV present with various degrees of branching. At 10 DIV, classical astrocyte morphology is seen, and cells are evenly distributed over the growth area instead of in clusters. Astrocytes appear thick with projections of various sizes while microglia are less numerous and rounder. At 12 DIV, cells begin to grow to confluency, yet the number of cells is lower as each cell is larger and takes up more space than the cells in 3 DIV and 5 DIV. Astrocytes have a mix of thick and fibrous and thin stars-like shapes but none of the earlier more simplistic shapes. Microglia only appear in round shapes. All visible nuclei are DAPI+ (blue). Scale bars in all images in left column: 1000 μm. Scale bars in all images in right column: 50 μm

Similar articles

References

    1. Takata F, Dohgu S, Yamauchi A, Matsumoto J, Machida T, Fujishita K, et al. In Vitro Blood-Brain Barrier models using Brain Capillary endothelial cells isolated from neonatal and adult rats retain Age-Related Barrier properties. PLoS ONE. 2013;8(1):e55166. doi: 10.1371/journal.pone.0055166. - DOI - PMC - PubMed
    1. Hajal C, Offeddu GS, Shin Y, Zhang S, Morozova O, Hickman D, et al. Engineered human blood–brain barrier microfluidic model for vascular permeability analyses. Nat Protoc. 2022;17(1):95–128. doi: 10.1038/s41596-021-00635-w. - DOI - PubMed
    1. Schildge S, Bohrer C, Beck K, Schachtrup C. Isolation and culture of mouse cortical astrocytes. J Vis Exp. 2013;71:50079. - PMC - PubMed
    1. Nakagawa S, Deli MA, Kawaguchi H, Shimizudani T, Shimono T, Kittel Á, et al. A new blood–brain barrier model using primary rat brain endothelial cells, pericytes and astrocytes. Neurochem Int. 2009;54(3):253–63. doi: 10.1016/j.neuint.2008.12.002. - DOI - PubMed
    1. Thomsen MS, Humle N, Hede E, Moos T, Burkhart A, Thomsen LB. The blood-brain barrier studied in vitro across species. PLoS ONE. 2021;16(3):e0236770. doi: 10.1371/journal.pone.0236770. - DOI - PMC - PubMed

LinkOut - more resources