. 2025 Mar;13(3):637-649.
doi: 10.1111/andr.13691. Epub 2024 Jul 11.

Glucose prevents the acquisition of the capacitated state in pig spermatozoa

Affiliations

Glucose prevents the acquisition of the capacitated state in pig spermatozoa

Rebeca Serrano et al. Andrology. 2025 Mar.

Abstract

Background: Mammalian spermatozoa need to undergo a process named capacitation to be able to fertilize an oocyte. During their journey in the female tract, spermatozoa obtain energy while exposed to a changing environment containing a variety of metabolic substrates. The energy requirements for sperm capacitation are species-specific. In addition, the available energy source can hinder the process of sperm capacitation and eventually the acrosome reaction.

Objectives: To evaluate whether the metabolic substrates available in the in vitro sperm capacitation medium allow or interfere with the pig sperm capacitation process.

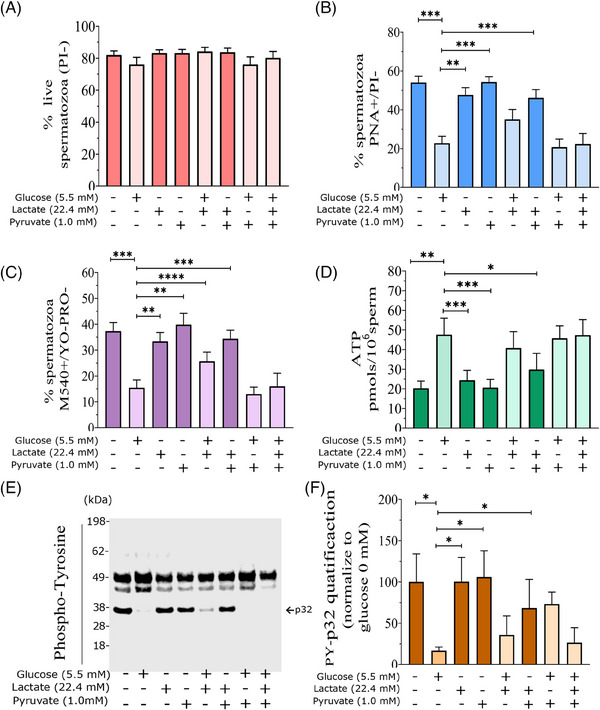
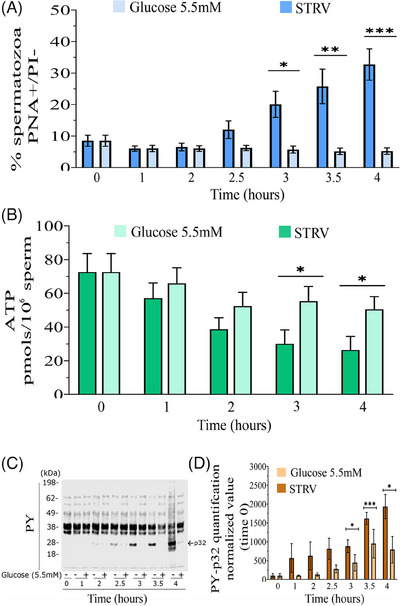
Material and methods: The effect of different metabolic substrates on sperm capacitation process was evaluated by analyzing phosphorylation in the p32 protein; the acrosome reaction and the ATP intracellular content.

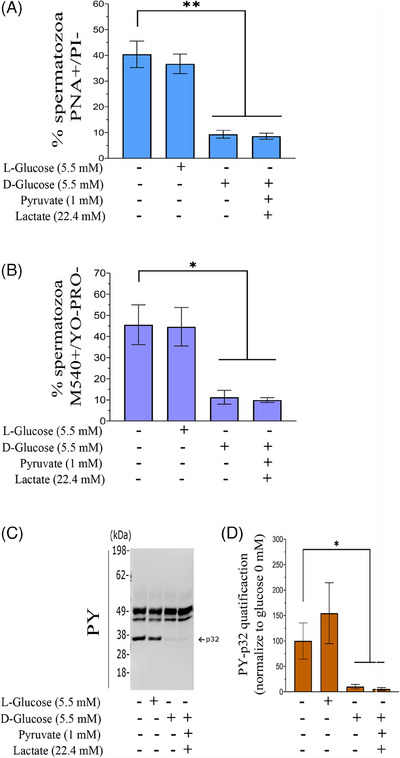
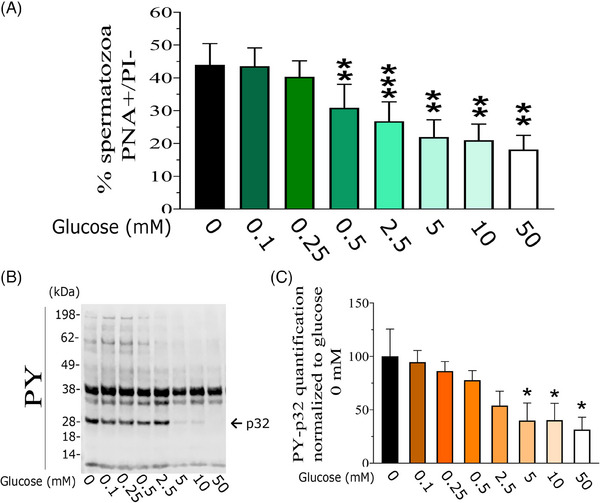
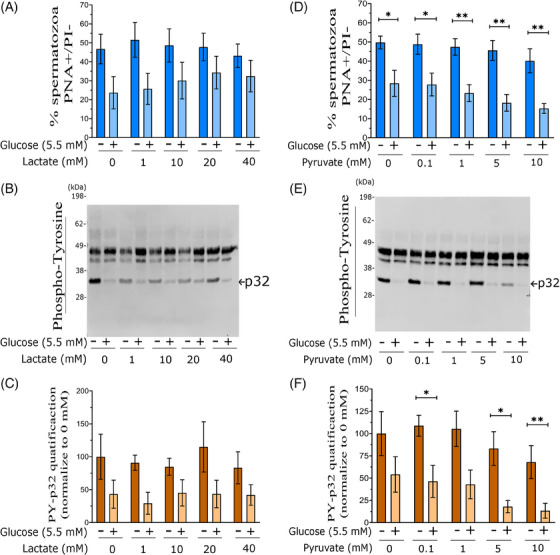
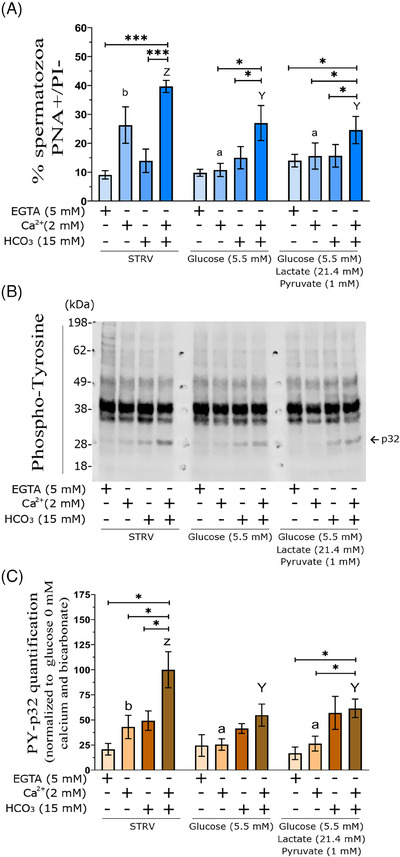
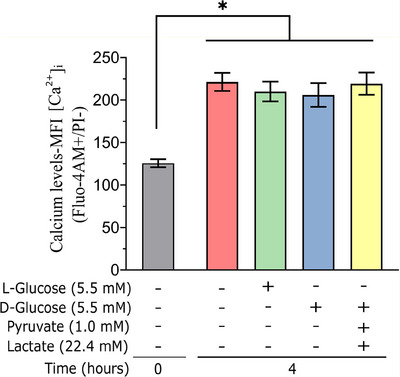
Results: The presence of glucose in the in vitro capacitating medium diminishes, in a concentration-dependent manner, parameters associated with the capacitated status: induced acrosome exocytosis, plasma membrane destabilization, and protein tyrosine phosphorylation. Conversely, sperm incubation with pyruvate or lactate, either individually or in combination, allows the attainment of the capacitated status. Unexpectedly, pig spermatozoa incubated without any extracellular energy substrates or with a non-metabolizable substrate (l-glucose) for 4 h displayed similar sperm viability to the control and exhibited a capacitated phenotype. The capacitation-like phenotype observed in starved pig spermatozoa (absence of glucose, lactate, and pyruvate) was dependent on extracellular bicarbonate and calcium levels, and these spermatozoa exhibited lower intracellular ATP content compared to those not capacitated. Nevertheless, the intracellular content of calcium was not modified in comparison to the control.

Discussion and conclusions: Our findings suggest that the metabolic substrates used to fuel pig sperm metabolism are important in achieving the capacitated status. The results of this work could be used to refine the capacitating medium employed in pig in vitro fertilization.

Keywords: acrosome reaction; capacitation; glucose; metabolic substrate; spermatozoa; starvation; tyrosine phosphorylation.


Conflict of interest statement

The authors declare no conflicts of interest.

Figures

FIGURE 1
FIGURE 1
Effects of different energy substrates in parameters related to pig sperm capacitation features. Pig spermatozoa were incubated in capacitating conditions (15 mM HCO3 and 2 mM Ca2+) containing different energy substrates individually (5.5 mM glucose, 21.6 mM sodium lactate, and 1 mM sodium pyruvate) or in combination of them for 4 h at 38.5°C. Spermatozoa incubated in an in vitro capacitating media containing glucose are depicted by light histogram, whereas those not containing glucose are shown in dark histogram. (A) Percentage of live spermatozoa (PI). Bars represent the average ± SEM of 10 experiments. (B) Percentage of live acrosome reacted spermatozoa (PNA+/PI+‐). Bars represent the average ± SEM of eight experiments. *p < 0.05, **p < 0.01, ***p < 0.005, indicates differences with 5.5 mM glucose condition. (C) Percentage of live spermatozoa with high lipid plasma membrane disorganization (M540+/Yo‐Pro‐1). Bars represent the average ± SEM of eight experiments. *p < 0.05, **p < 0.01, ***p < 0.005, and ****p < 0.001 indicate differences with 5.5 mM glucose condition. (D) Intracellular ATP content. Bars represent the average ± SEM of six experiments. *p < 0.05, **p < 0.01, and ***p < 0.005 indicate differences with 5.5 mM glucose condition. (E) A representative western blot using anti‐phosphotyrosine antibody is shown. The arrow shows the p32 protein. (F) Densitometric analysis of PY‐p32. For comparison between blots, pixels for the PY‐p32 signal were quantified and normalized using the 0 mM glucose (lane 1) as reference (100%). Bars represent the average ± SEM of four experiments. *p < 0.05 indicates differences with 5 mM glucose condition.
FIGURE 2
FIGURE 2
Effect of energy substrate restrictions on pig sperm capacitation‐related events. Pig spermatozoa were incubated in an in vitro capacitating media (15 mM HCO3 and 2 mM Ca2+) containing different metabolizable energy substrates individually (5.5 mM d‐glucose) or in combination of them (5.5 mM d‐glucose, 22.4 mM sodium lactate and 1 mM sodium pyruvate), STRV condition (without substrates) or with a non‐metabolizable energy substrate (5.5 mM l‐glucose) for 4 h at 38.5°C. (A) Percentage of live acrosome reacted spermatozoa (PNA+/PI). Blue bars represent the average ± SEM of five experiments. *p < 0.05 indicates differences with the STRV condition. (B) Percentage of live spermatozoa with high lipid plasma membrane disorganization (M540+/Yo‐Pro‐1). Violet bars represent the average ± SEM of five experiments. *p < 0.05 indicates differences with the STRV condition. (C) A representative western blot using anti‐phosphotyrosine (PY) antibody is shown. The arrow shows the p32 protein. (D) Densitometric analysis of p32. For comparison between blots, pixels for the PY‐p32 signal were quantified and normalized using the STRV condition (lane 1) as reference (100%). Brown bars represent the average ± SEM of five experiments. *p < 0.05 indicates differences with the STRV condition.
FIGURE 3
FIGURE 3
Effect of glucose concentration on pig sperm capacitation‐related events. Pig spermatozoa were incubated in an in vitro capacitating media (15 mM HCO3 and 2 mM Ca2+) containing different concentrations of glucose as the sole energy substrate for 4 h at 38.5°C. (A) Percentage of live acrosome reacted spermatozoa (PNA+/PI). Bars represent the average ± SEM of eight experiments. **p < 0.01 and ***p < 0.005 indicate differences with 0 mM glucose condition (black histogram). (B) A representative western blot using anti‐phosphotyrosine (PY) antibody is shown. The arrow shows the PY‐p32 protein. (C) Densitometric analysis of PY‐p32. Bars represent the average ± SEM of six experiments. For comparison between blots, pixels for the p32 signal were quantified and normalized using the 0 mM glucose (lane 1) as reference (100%). *p < 0.05, indicates differences with 0 mM glucose condition (black histogram).
FIGURE 4
FIGURE 4
Effects of lactate and pyruvate concentrations on capacitation‐related events. Pig spermatozoa were incubated in an in vitro capacitating media (15 mM HCO3 and 2 mM Ca2+) containing different concentrations of lactate alone (dark histograms) or pyruvate alone (dark histograms) or in combination with 5.5 mM glucose (light histograms) as the energy sources for 4 h at 38.5°C. (A) Percentage of live acrosome reacted spermatozoa (PNA+/PI). Bars represent the average ± SEM of five experiments. Within the same lactate concentration, a Student's t‐test was performed, no significant differences between the presence (5.5 mM) or absence (0 mM) of glucose were found. (B) A representative western blot using anti‐phosphotyrosine (PY) antibody is shown. The arrow shows the PY‐p32 protein. (C) Densitometric analysis of PY‐p32. Bars represent the average ± SEM of five experiments. For comparison between blots, pixels for the PY‐p32 signal were quantified and normalized using the 0 mM glucose and 0 mM lactate (lane 1) as reference (100%). Within the same lactate concentration, a Student's t‐test was performed, no significant differences between the presence (5.5 mM) or absence (0 mM) of glucose were found. (D) Percentage of live spermatozoa acrosome reacted (PNA+/PI). Bars represent the average ± SEM of five experiments. Within the same lactate concentration, a Student's t‐test was performed, *p < 0.05 and **p < 0.01 indicate differences between the presence (5.5 mM) or absence (0 mM) of glucose. (E) A representative western blot using anti‐phosphotyrosine (PY) antibody is shown. The arrow shows the PY‐p32 protein. (E) Densitometric analysis of PY‐p32. Bars represent the average ± SEM of five experiments. For comparison between blots, pixels for the p32 signal were quantified and normalized using the 0 mM glucose and 0 mM lactate (lane 1) as reference (100%). Within the same lactate concentration, a Student's t‐test was performed, *p < 0.05 indicates differences between the presence (5.5 mM) or absence (0 mM) of glucose.
FIGURE 5
FIGURE 5
Effect of time on sperm capacitation‐related events triggered by starvation during in vitro capacitation. Pig spermatozoa were incubated in a capacitating media (15 mM HCO3 and 2 mM Ca2+) with different concentrations of glucose (0 and 5.5 mM) as the sole energy substrate for 4 h at 38.5°C. (A) Percentage of live acrosome reacted spermatozoa (PNA+/PI‐+). Bars represent the average ± SEM of five experiments. Within the same time point a Student's t‐test was performed, *p < 0.05, **p < 0.01, ***p < 0.001 indicates differences between glucose incubation condition (0 mM vs. 5.5 mM glucose). (B) Intracellular ATP content. Bars represents the average ± SEM of six experiments. Within the same time point a Student's t‐test was performed, *p < 0.05 indicates differences between glucose incubation condition (0 mM vs. 5.5 mM glucose). (C) A representative western blot using anti‐phosphotyrosine (PY) antibody is shown. The arrow shows the PY‐p32 protein. (D) Densitometric analysis of PY‐p32. For comparison between blots, pixels for the PY‐p32 signal were quantified and normalized using the 0 mM glucose time 0 h (lane 1) as reference (100%). Bars represent the average ± SEM of four experiments. Within the same time point a Student's t‐test was performed, *p < 0.05 and ***p < 0.001 indicate differences between glucose incubation condition (0 mM vs. 5.5 mM glucose).
FIGURE 6
FIGURE 6
Effect of calcium and bicarbonate on the sperm capacitation‐related events in pig spermatozoa incubated with different metabolic substrates’ conditions. Pig spermatozoa were incubated in the presence or the absence of 5 mM EGTA, 15 mM HCO3 , and 2 mM Ca2+ with different energy substrates conditions (0 mM glucose, starved condition (STRV), 5.5 mM glucose or COMPLETE (5.5 mM glucose, 22.4 mM sodium lactate, and 1 mM sodium pyruvate) for 4 h at 38.5°C. (A) Percentage of live acrosome reacted spermatozoa (PNA+/PI). Bars represent the average ± SEM of six experiments. Within the same energy substrate conditions (STRV, 5.5 mM glucose or COMPLETE) *p < 0.05 and ***p < 0.005 indicate differences with the presence of 15 mM HCO3 and 2 mM Ca2+. Different superscripts (a,b) show differences between energy substrates conditions within the presence of 2 mM Ca2+ in the media. Different superscripts (Y,Z) show differences between energy substrates conditions within the presence of 2 mM Ca2+ and 15 mM HCO3 in the media. (B) A representative western blot using anti‐phosphotyrosine (PY) antibody is shown. The arrow shows the PY‐p32 protein. (C) Densitometric analysis of PY‐p32. For comparison between blots, pixels for the p32 signal were quantified and normalized using the 15 mM HCO3 and 2 mM Ca2+ condition from the no energy substrate treatment (lane 4) as reference (100%). Bars represent the average ± SEM of five experiments. Within the same energy substrate conditions (STRV, 5.5 mM glucose or COMPLETE) *p < 0.05, ***p < 0.005, indicates differences with the presence of 15 mM HCO3 and 2 mM Ca2+. Different superscripts (a,b) show differences between energy substrates conditions within the presence of 2 mM Ca2+ in the media. Different superscripts (Y,Z) show differences between energy substrates conditions within the presence of 2 mM Ca2+ and 15 mM HCO3 in the media.
FIGURE 7
FIGURE 7
Intracellular calcium levels of pig spermatozoa capacitated in vitro with different metabolic substrates. Pig spermatozoa were incubated in an in vitro capacitating media (15 mM HCO3 and 2 mM Ca2+) containing different metabolizable energy substrates individually (5.5 mM d‐glucose) or in combination of them (5.5 mM d‐glucose, 21.6 mM sodium lactate and 1 mM sodium pyruvate), STRV condition (no energy substrate) or with a non‐metabolizable energy substrate (5.5 mM l‐glucose) for 4 h at 38.5°C. The graph shows Fluo‐4 AM geometric mean fluorescence intensity (MFI) in live spermatozoa (PI). Bars represent the average ± SEM of five experiments. *p < 0.05 indicates differences with time 0 h condition. No significant differences were found when analyzing 4 h of incubation with the STRV condition.

Similar articles

References

    1. Visconti PE. Sperm bioenergetics in a nutshell. Biol Reprod. 2012;87(3):72. https://doi.org10.1095/biolreprod.112.104109 - PMC - PubMed
    1. Hugentobler SA, Humpherson PG, Leese HJ, Sreenan JM, Morris DG. Energy substrates in bovine oviduct and uterine fluid and blood plasma during the oestrous cycle. Mol Reprod Dev. 2008;75(3):496‐503. https://doi.org10.1002/mrd.20760 - PubMed
    1. Harris SE, Gopichandran N, Picton HM, Leese HJ, Orsi NM. Nutrient concentrations in murine follicular fluid and the female reproductive tract. Theriogenology. 2005;64(4):992‐1006. https://doi.org10.1016/j.theriogenology.2005.01.004 - PubMed
    1. Nichol R, Hunter RH, Gardner DK, Leese HJ, Cooke GM. Concentrations of energy substrates in oviductal fluid and blood plasma of pigs during the peri‐ovulatory period. J Reprod Fertil. 1992;96(2):699‐707. https://doi.org10.1530/jrf.0.0960699 - PubMed
    1. González‐Fernández L, Sánchez‐Calabuig MJ, Calle‐Guisado V, et al. Stage‐specific metabolomic changes in equine oviductal fluid: new insights into the equine fertilization environment. Theriogenology. 2020;143:35‐43. https://doi.org10.1016/j.theriogenology.2019.11.035 - PubMed