. 2024 Oct 10;5(4):100325.
doi: 10.1016/j.xhgg.2024.100325. Epub 2024 Jul 10.

INDELpred: Improving the prediction and interpretation of indel pathogenicity within the clinical genome

Affiliations

INDELpred: Improving the prediction and interpretation of indel pathogenicity within the clinical genome

Yilin Wei et al. HGG Adv. .

Abstract

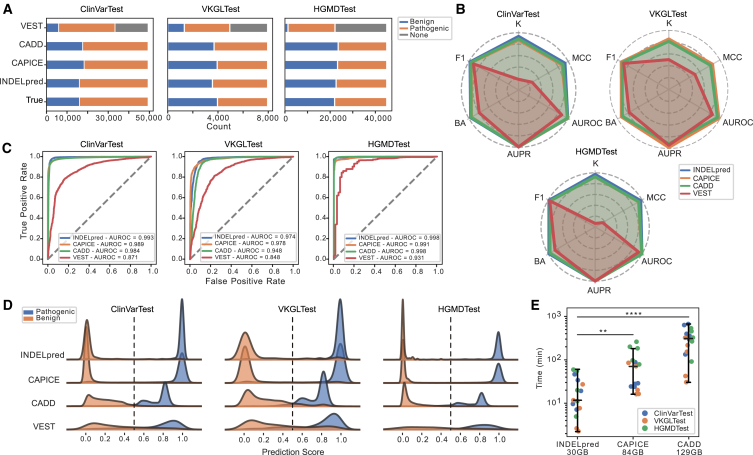
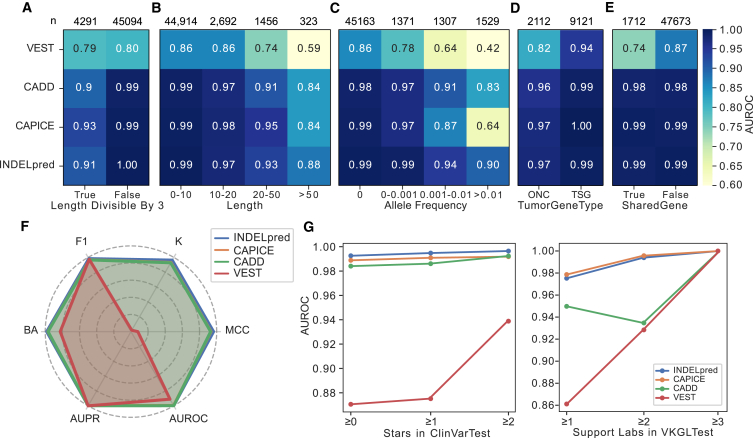
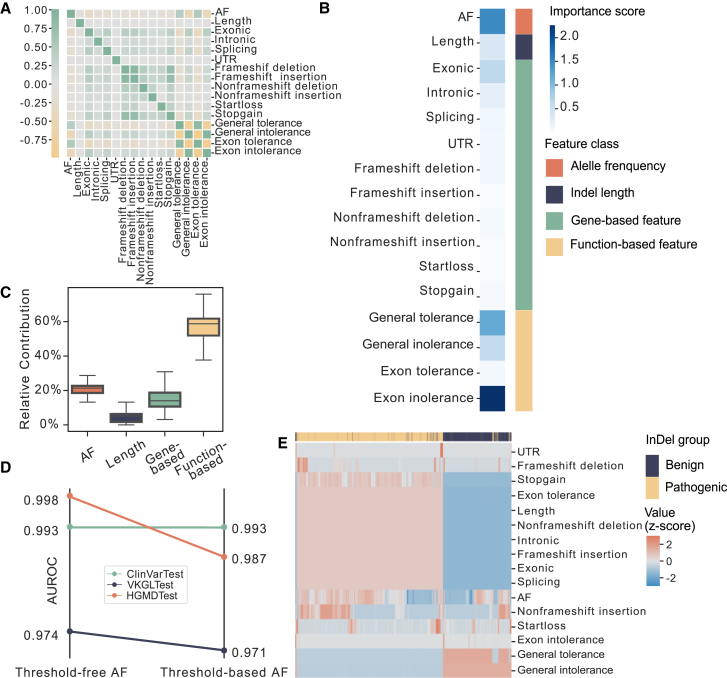
Small insertions and deletions (indels) are critical yet challenging genetic variations with significant clinical implications. However, the identification of pathogenic indels from neutral variants in clinical contexts remains an understudied problem. Here, we developed INDELpred, a machine-learning-based predictive model for discerning pathogenic from benign indels. INDELpred was established based on key features, including allele frequency, indel length, function-based features, and gene-based features. A set of comprehensive evaluation analyses demonstrated that INDELpred exhibited superior performance over competing methods in terms of computational efficiency and prediction accuracy. Importantly, INDELpred highlighted the crucial role of function-based features in identifying pathogenic indels, with a clear interpretability of the features in understanding the disease-causing variants. We envisage INDELpred as a desirable tool for the detection of pathogenic indels within large-scale genomic datasets, thereby enhancing the precision of genetic diagnoses in clinical settings.

Keywords: InDel; clinical genomics; machine learning; pathogenicity prediction; whole genome sequencing.


Conflict of interest statement

Declaration of interests The authors declare no competing interests.

Figures

Figure 1
Figure 1
Overview of INDELpred development and evaluation (A) After annotation by ANNOVAR, the function-based features for indel variants were represented by the studentized residuals that were derived from the fitted ordinary least squares regression models, while the gene-based features were calculated by the ratios of pathogenic to all indels for each function in the specific gene regions. (B) With the four distinct feature categories, the GBDT-based INDELpred model was trained upon the ClinVarTrain dataset using the stratified 5-fold cross-validation. The final INDELpred model was subsequently applied to four testing datasets for the evaluation of prediction accuracy, runtime, and data storage requirements using a set of metrics. (C) INDELpred model for indel pathogenicity prediction was further validated across various genomic contexts, including stability analysis with different genomic factors, reliability analysis based on the varying support laboratories (confidence levels) of indels, shared gene analysis between HGMD and gnomAD, and the adoption of a clinical WGS dataset with 30 pediatric individuals for practical applicability assessment.
Figure 2
Figure 2
Indel pathogenicity prediction performance comparison between INDELpred and the competing methods on the datasets of ClinVarTest, VKGLTest, and HGMDTest (A) The number of predicted loci by different models for the three testing datasets. The gray color indicates the loci not predicted by the model. (B) Radar chart of six evolution metrics. Values closer to the periphery represent a score approaching 1, indicating the high prediction performance. (C) ROC curves with AUROC values yielded by different methods. (D) Distribution of prediction scores by different models. The horizontal axis ranges from 0 to 1. CADD scores were normalized as scoreCADD×0.5/20, where we chose the value of 20 as the CADD cutoff value. (E) Time consumption of the three models across the three datasets. Each method was independently executed five times on each dataset to ensure the consistency of the results. The data storage requirement for each method is shown on the x axis. Statistical test: two-sided Mann-Whitney U test with the Benjamini–Hochberg correction. ∗∗p < 0.01 and ∗∗∗∗p < 0.0001. The center line indicating the median and whiskers representing 1.5 × IQR.
Figure 3
Figure 3
Evaluation of INDELpred for the impact of different genomic factors (A–E) AUROC results assessed for each partition subset of the ClinVarTest dataset based on genomic factors of whether or not the indel length was divisible by three (A), indel length (B), AF (C), groups of TSGs and ONCs (D), and groups of shared genes (E). The number of indels in each subset is indicated on the top accordingly. (F) Radar chart of the six metrics valued using the HGMDSharedGene dataset. (G) AUROC results with respect to different levels of CLINSTAT credibility in ClinVarTest (left) as well as different support laboratories in VKGLTest (right).
Figure 4
Figure 4
Comparison of indel pathogenicity prediction performance between INDELpred and the competing methods on the clinical WGS dataset (A) Computational time taken by the three methods for the clinical WGS dataset collected from 30 pediatric individuals. Statistical test: two-sided Mann-Whitney U test with the Benjamini-Hochberg correction. ∗∗∗∗p < 0.0001. Each box in the boxplots corresponds to the interval between the 25th and 75th percentile (interquartile range, IQR) with the center line indicating the median and whiskers representing 1.5 × IQR. (B) Precision-recall curves with AUPR values for each predictive model. (C) Curve plot showing sensitivity of pathogenic indel in the top-k variants ranked by different prediction methods for varying k values. (D) Bar plot showing sensitivity of individual in top 30, top 100, and top 150 variants ranked by different prediction methods. (E) Prediction scores yielded by different predictive models for the 26 disease-causative indels. CADD scores were normalized as scoreCADD×0.5/20, where we chose the value of 20 as the CADD cutoff value. Each box in the boxplots corresponds to the interval between the 25th and 75th percentile (interquartile range, IQR) with the center line indicating the median and whiskers representing 1.5 × IQR.
Figure 5
Figure 5
Analysis of pathogenicity-related factors through the lens of features utilized by INDELpred (A) Spearman correlation coefficient matrix of the 16 features used by INDELpred. (B) The contribution of each individual feature, represented by feature importance, toward the prediction of indel pathogenicity by INDELpred model. (C) Relative contribution of each of four feature categories toward the prediction of indel pathogenicity by INDELpred model. Each box in the boxplots corresponds to the interval between the 25th and 75th percentile (interquartile range, IQR) with the center line indicating the median and whiskers representing 1.5 × IQR. (D) Comparison of AUROC results across three datasets for AF with threshold-free and threshold-based values. (E) Hierarchical clustering analysis of 16 individual features. All values of individual features were Z scored.

Similar articles

References

    1. Satam H., Joshi K., Mangrolia U., Waghoo S., Zaidi G., Rawool S., Thakare R.P., Banday S., Mishra A.K., Das G., Malonia S.K. Next-Generation Sequencing Technology: Current Trends and Advancements. Biology. 2023;12:997. doi: 10.3390/biology12070997. - DOI - PMC - PubMed
    1. Sayers E.W., Agarwala R., Bolton E.E., Brister J.R., Canese K., Clark K., Connor R., Fiorini N., Funk K., Hefferon T., et al. Database resources of the National Center for Biotechnology Information. Nucleic Acids Res. 2019;47:D23–D28. doi: 10.1093/nar/gky1069. - DOI - PMC - PubMed
    1. Zou D., Wang L., Liao J., Xiao H., Duan J., Zhang T., Li J., Yin Z., Zhou J., Yan H., et al. Genome sequencing of 320 Chinese children with epilepsy: a clinical and molecular study. Brain. 2021;144:3623–3634. doi: 10.1093/brain/awab233. - DOI - PMC - PubMed
    1. Yang Y., Zhao S., Sun G., Chen F., Zhang T., Song J., Yang W., Wang L., Zhan N., Yang X., et al. Genomic architecture of fetal central nervous system anomalies using whole-genome sequencing. NPJ Genom. Med. 2022;7:31. doi: 10.1038/s41525-022-00301-4. - DOI - PMC - PubMed
    1. The 100,000 Genomes Project Pilot Investigators. Smedley D., Smith K.R., Martin A., Thomas E.A., McDonagh E.M., Cipriani V., Ellingford J.M., Arno G., Tucci A., et al. 100,000 Genomes Pilot on Rare-Disease Diagnosis in Health Care — Preliminary Report. N. Engl. J. Med. 2021;385:1868–1880. doi: 10.1056/NEJMoa2035790. - DOI - PMC - PubMed

LinkOut - more resources