. 2025 Nov 1;20(11):3287-3301.
doi: 10.4103/NRR.NRR-D-23-01256. Epub 2024 Jul 10.

Pharmacological targeting cGAS/STING/NF-κB axis by tryptanthrin induces microglia polarization toward M2 phenotype and promotes functional recovery in a mouse model of spinal cord injury

Affiliations

Pharmacological targeting cGAS/STING/NF-κB axis by tryptanthrin induces microglia polarization toward M2 phenotype and promotes functional recovery in a mouse model of spinal cord injury

Ziwei Fan et al. Neural Regen Res. .

Abstract

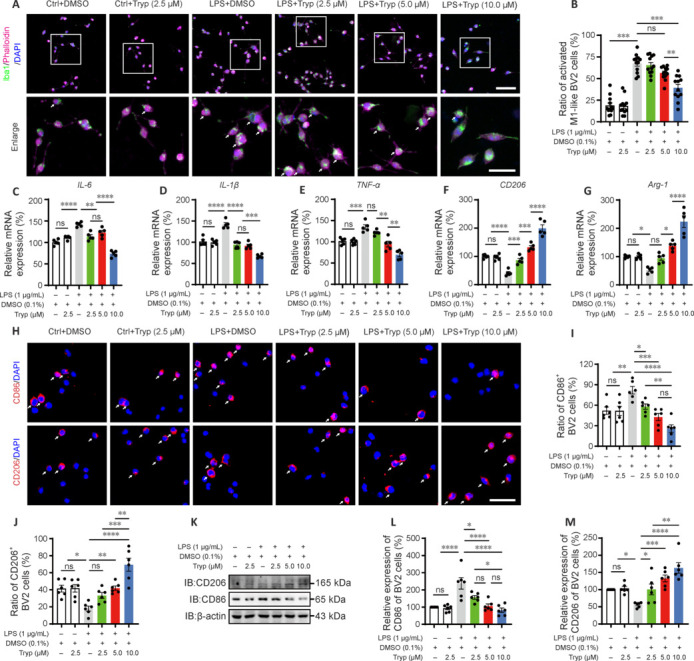
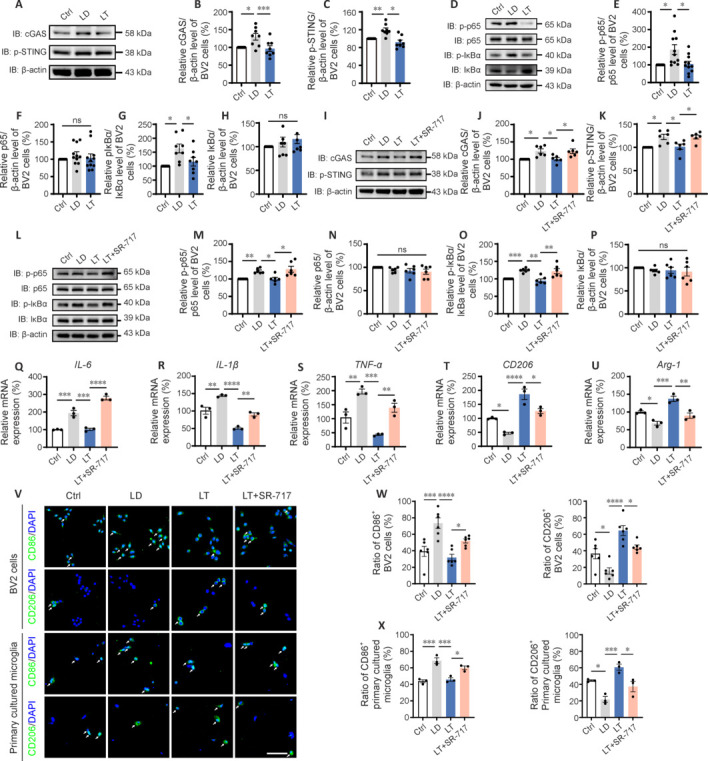
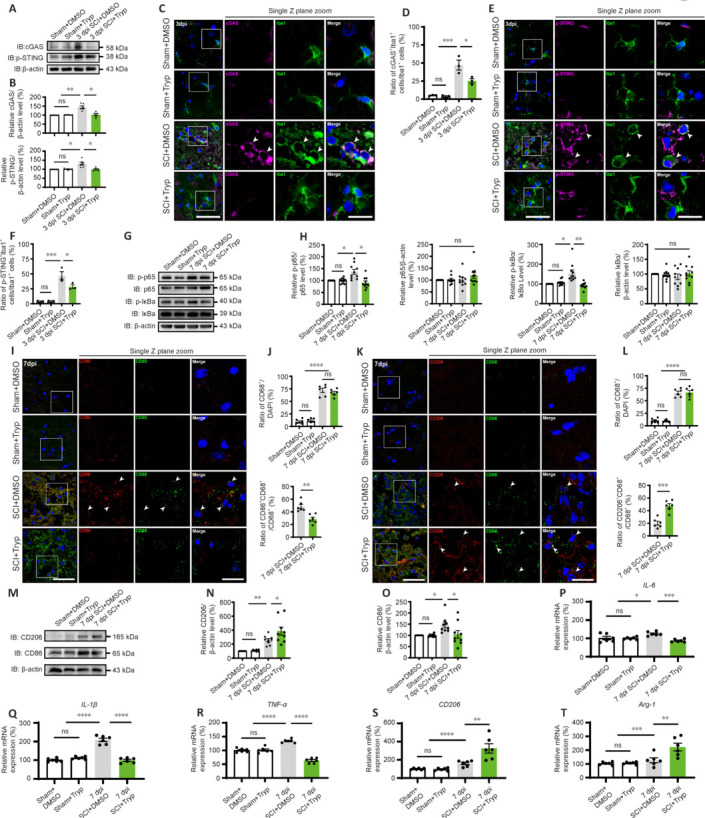
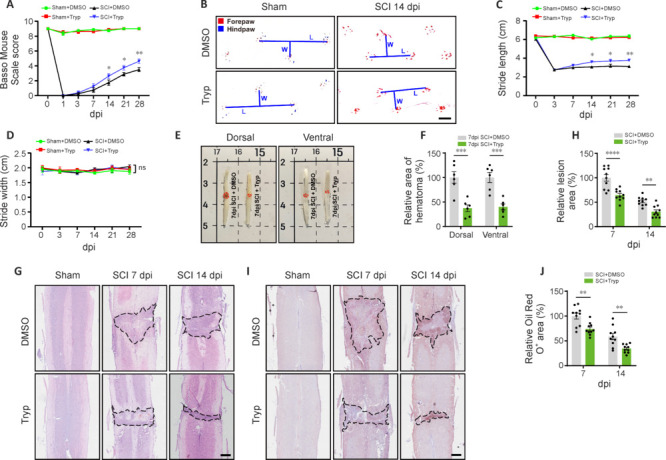
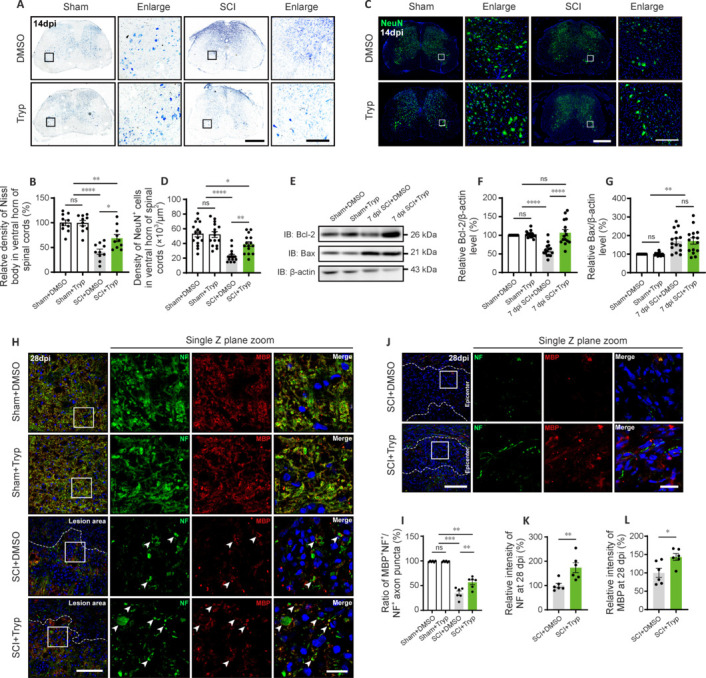
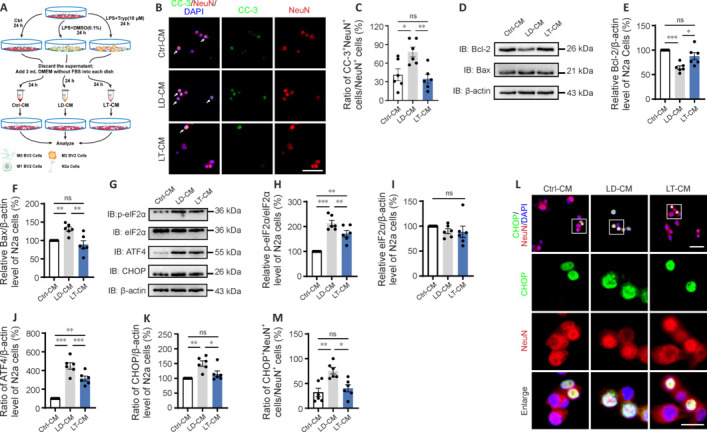
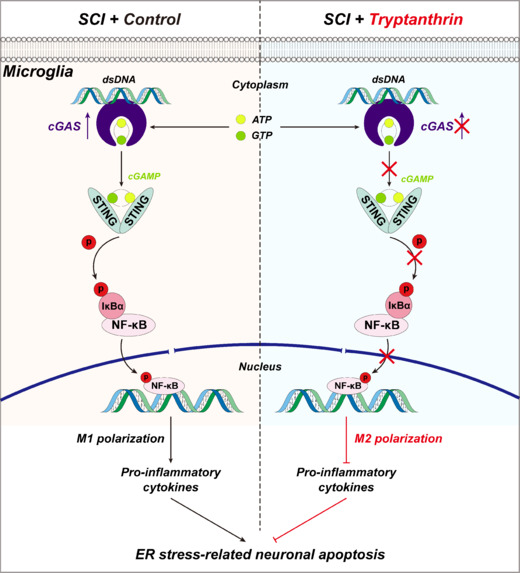
JOURNAL/nrgr/04.03/01300535-202511000-00031/figure1/v/2024-12-20T164640Z/r/image-tiff The M1/M2 phenotypic shift of microglia after spinal cord injury plays an important role in the regulation of neuroinflammation during the secondary injury phase of spinal cord injury. Regulation of shifting microglia polarization from M1 (neurotoxic and proinflammatory type) to M2 (neuroprotective and anti-inflammatory type) after spinal cord injury appears to be crucial. Tryptanthrin possesses an anti-inflammatory biological function. However, its roles and the underlying molecular mechanisms in spinal cord injury remain unknown. In this study, we found that tryptanthrin inhibited microglia-derived inflammation by promoting polarization to the M2 phenotype in vitro . Tryptanthrin promoted M2 polarization through inactivating the cGAS/STING/NF-κB pathway. Additionally, we found that targeting the cGAS/STING/NF-κB pathway with tryptanthrin shifted microglia from the M1 to M2 phenotype after spinal cord injury, inhibited neuronal loss, and promoted tissue repair and functional recovery in a mouse model of spinal cord injury. Finally, using a conditional co-culture system, we found that microglia treated with tryptanthrin suppressed endoplasmic reticulum stress-related neuronal apoptosis. Taken together, these results suggest that by targeting the cGAS/STING/NF-κB axis, tryptanthrin attenuates microglia-derived neuroinflammation and promotes functional recovery after spinal cord injury through shifting microglia polarization to the M2 phenotype.


Conflict of interest statement

Conflicts of interest: The authors declare that they have no conflict of interest.

Figures

Figure 1
Figure 1
Tryp inhibits microglia-derived inflammation through shifting polarization to the M2 phenotype. (A) Double immunostaining of phallotoxin (purple) and Iba1 (green) of BV2 cells incubated with different levels of Tryp (0, 2.5, 5.0, and 10.0 μM) with or without LPS for 24 hours. BV2 cells with hypertrophic bodies and multiple retracted cytoplasmic processes were identified as amoeboid cells (marked by white arrows). The areas marked by boxes are shown in the ‘Enlarge’ panels. Scale bars: 50 μm. (B) Quantitative analysis of the percentages of activated M1-like BV2 cells as shown in A (n = 12 individual samples of cells per group). (C–G) Quantitative reverse transcription-polymerase chain reaction analysis of IL-6 (C), IL-1β (D), TNF-α (E), CD206 (F) and Arg-1 (G) gene expression levels in BV2 cells incubated with different levels of Tryp (0, 2.5, 5.0, 10.0 μM) with or without LPS for 24 hours (normalized to β-actin, n = 5 individual samples of cells per group). (H) Immunostaining of CD86 (CD86+ cells were marked by white arrows) and CD206 (CD206+ cells were marked by white arrows) in BV2 cells incubated with different levels of Tryp (0, 2.5, 5.0, 10.0 μM) with or without LPS for 24 hours. Scale bar, 50 μm. (I, J) Quantitative analysis of the percentages of CD86+ (I) and CD206+ (J) BV2 cells as shown in H (n = 6 individual samples of cells per group). (K) Western blot analysis of CD206 and CD86 in BV2 cells incubated with various concentrations of Tryp (0, 2.5, 5.0, 10.0 μM) with or without LPS for 24 hours. (L, M) Quantitative analysis of CD86 (L) and CD206 (M) protein levels shown in (K) (normalized to β-actin, n = 6 individual samples of cells per group). Data are expressed as the mean ± SEM and were analyzed using one-way analysis of variance with Tukey’s multiple comparisons test. *P < 0.05, **P < 0.01, ***P < 0.001, ****P < 0.0001. The data were from at least three separate and independent studies. Arg-1: Arginase-1; CD206: cluster of differentiation 206; Iba1: ionized calcium-binding adapter molecule 1; IB: immunoblotting; IL-6: interleukin-6; LPS: lipopolysaccharide; ns: not significant; TNF-α: tumor necrosis factor-α; Tryp: tryptanthrin.
Figure 2
Figure 2
Tryp promotes the M2 polarization of microglia through the cGAS/STING/NF-κB pathway. (A) Western blot analysis of cGAS and p-STING in BV2 cells incubated with Ctrl, LPS + DMSO (LD group) and LPS + Tryp (10.0 μM; LT group) for 1 hour. (B, C) Quantitative analysis of cGAS (B) and p-STING (C) protein levels as shown in A (normalized to β-actin, n = 8 individual samples of cells per group). (D) Western blot analysis of p-p65, p65, p-IκBα and IκBα in BV2 cells incubated with Ctrl, LD and LT for 1 hour. (E–H) Quantitative analysis of p-p65 (E, normalized to p65), p65 (F, normalized to β-actin), p-IκBα (G, normalized to IκBα), and IκBα (H, normalized to β-actin) protein levels shown in (D) (p-p65 and p65, n = 11 individual samples of cells per group; p-IκBα and IκBα, n = 8 individual samples of cells per group). (I) Western blot analysis of cGAS and p-STING in BV2 cells treated with Ctrl, LD, LT and LPS + Tryp + SR-717 (20.0 μM; LT + SR-717) for 1 hour. (J, K) Quantitative analysis of cGAS (J) and p-STING (K) protein levels shown in I (normalized to β-actin, n = 6 individual samples of cells per group). (L) Western blot analysis of p-p65, p65, p-IκBα and IκBα in BV2 cells treated with Ctrl, LD, LT and LT + SR-717 for 1 hour. (M–P) Quantitative analysis of p-p65 (M, normalized to p65), p65 (N, normalized to β-actin), p-IκBα (O, normalized to IκBα) and IκBα (P, normalized to β-actin) protein levels shown in L (n = 6 individual samples of cells per group). (Q–U) Quantitative reverse transcription-polymerase chain reaction analysis of IL-6 (Q), IL-1β (R), TNF-α (S), CD206 (T) and Arg-1 (U) mRNA expression levels within BV2 cells treated with Ctrl, LD, LT and LT + SR-717 for 24 hours (normalized to β-actin, n = 3 individual samples of cells per group). (V) Immunostaining of CD86 (CD86+ BV2 cells and CD86+ primary cultured microglia were both marked by white arrows) and CD206 (CD206+ BV2 cells and CD206+ primary cultured microglia were both marked by white arrows) in BV2 cells and primary cultured microglia treated with Ctrl, LD, LT and LT + SR-717 for 24 hours. Scale bar: 100 μm. (W, X) Quantitative analysis of the percentages of CD86+ and CD206+ BV2 cells (W; n = 6 individual samples of cells per group), and primary cultured microglia (X; n = 3 individual samples of cells per group). Data are expressed as the mean ± SEM and were analyzed using one-way analysis of variance with Tukey’s multiple comparisons test. *P < 0.05, **P < 0.01, ***P < 0.001, ****P < 0.0001. The data were from at least three separate and independent studies. Arg-1: Arginase-1; CD206: cluster of differentiation 206; cGAS: cyclic GMP-AMP synthase; Ctrl: control; DMSO: dimethyl sulfoxide; IκBα: nuclear factor-κB inhibitory protein α; IL-6: interleukin-6; ns: not significant; LPS: lipopolysaccharide; p: phosphorylated; STING: stimulator of interferon genes; TNF-α: tumor necrosis factor-α; Tryp: tryptanthrin.
Figure 3
Figure 3
Tryp shifts microglia from M1 to M2 phenotype after spinal cord injury by targeting the cGAS/STING/NF-κB pathway. (A) Western blot analysis of cGAS and p-STING in spinal cord treated with Tryp at 3 dpi. (B) Quantitative analysis of cGAS and p-STING protein levels shown in A (normalized to β-actin, n = 6 mice per group). (C, E) Confocal laser scanning microscopy double immunostaining images (60× magnification) of cGAS (purple) and Iba1 (green) (C), and p-STING (purple) and Iba1 (green) (E) in the spinal cord lesion area of Sham + DMSO (T8–T10), Sham + Tryp (T8–T10), SCI + DMSO and SCI + Tryp mice at 3 dpi. Higher magnification panels are single optical Z sections of the areas marked by boxes. cGAS+Iba1+ cells and p-STING+Iba1+ cells were marked by white arrowheads. Scale bars, 50 μm (left) and 20 μm (enlarge). (D, F) Quantitative analysis of the percentages of cGAS+Iba1+ cells in Iba1+ cells (D, n = 3 mice per group), and p-STING+Iba1+ cells in Iba1+ cells (F, n = 3 mice per group). (G) Western blot analysis of p-p65, p65, p-IκBα and IκBα in spinal cord treated with Tryp at 7 dpi. (H) Quantitative analysis of p-p65 (normalized to p65), p65 (normalized to β-actin), p-IκBα (normalized to IκBα) and IκBα (normalized to β-actin) protein levels shown in G (n = 10 mice per group). (I, K) Confocal laser scanning microscopy double immunostaining images (60× magnification) of CD86 (red) and CD68 (green) (I), and CD206 (red) and CD68 (green) (K) in the spinal cord lesion area of Sham + DMSO (T8–T10), Sham + Tryp (T8–T10), SCI + DMSO and SCI + Tryp mice at 7 dpi. Higher magnification panels are single optical Z sections of the areas marked by boxes. CD86+CD68+ cells and CD206+CD68+ cells were marked by white arrowheads. Scale bars: 50 μm (left) and 20μm (enlarge). (J, L) Quantitative analysis of the percentages of CD68+/DAPI (left) and CD86+CD68+/CD68+ (right) (J, n = 6 mice per group), and CD68+/DAPI (left) and CD206+CD68+/CD68+ (right) (L, n = 6 mice per group). Data were analyzed by one-way analysis of variance with Tukey’s multiple comparisons test (left) and unpaired two-tailed Student’s t-test (right). (M) Western blot analysis of CD206 and CD86 expression in spinal cord treated with Tryp at 7 dpi. (N, O) Quantitative analysis of CD206 (N) and CD86 (O) protein levels shown in M (normalized to β-actin, n = 9 mice per group). (P–T) Quantitative reverse transcription-polymerase chain reaction analysis of IL-6 (P), IL-1β (Q), TNF-α (R), CD206 (S) and Arg-1 (T) gene expression levels in spinal cords of Sham + DMSO, Sham + Tryp, SCI + DMSO and SCI + Tryp mice at 7 dpi (normalized to β-actin, n = 6 mice per group). Data are expressed as the mean ± SEM and were analyzed using one-way analysis of variance with Tukey’s multiple comparisons test. *P < 0.05, **P < 0.01, ***P < 0.001, ****P < 0.0001. The data were from at least three separate and independent studies. Arg-1: Arginase-1; CD206: cluster of differentiation 206; cGAS: cyclic GMP-AMP synthase; DMSO: dimethyl sulfoxide; dpi: days post-injury; Iba1: ionized calcium-binding adapter molecule 1; IL-6: interleukin-6; ns: not significant; NF-κB: nuclear factor-κB; ns: not significant; p: phosphorylated; p-STING: phosphorylated stimulator of interferon genes; TNF-α: tumor necrosis factor-α; Tryp: tryptanthrin.
Figure 4
Figure 4
Tryp promotes functional recovery and tissue repair after SCI. (A) Quantitative analysis of motor function measured via BMS scoring analysis at different stages in mice treated with Tryp after SCI (n = 8 mice per group). Data were analyzed by two-way analysis of variance with Tukey’s multiple comparisons test. (B) Representative images of footprint analysis of Sham + DMSO, Sham + Tryp, SCI + DMSO and SCI + Tryp mice at 14 dpi. Scale bar: 10 mm. (C, D) Quantitative footprint analysis of stride length (C) and stride width (D) at different time points after SCI (n = 8 mice per group). (E) Typical images showing the hematoma area (indicated by red dashed lines) of dorsal and ventral spinal cord in control-treated and Tryp-treated mice at 7 dpi. (F) Quantitative analysis of the relative hematoma areas shown in E (normalized to SCI + DMSO group, n = 6 mice per group). (G) Typical hematoxylin-eosin staining images showing the lesion area (labeled by black dashed lines) in spinal cords at 7 and 14 dpi. Scale bar: 500 μm. (H) Quantitative analysis of the relative lesioned areas shown in G (normalized to 7 dpi SCI + DMSO group, n = 10 sections of 5 mice per group). (I) Typical Oil Red O staining images showing the Oil Red O+ area (indicated by black dashed lines) in spinal cords at 7 and 14 dpi. Scale bar: 500 μm. (J) Quantitative analysis of the relative Oil Red O+ areas shown in I (normalized to 7 dpi SCI + DMSO group, n = 10 sections of 5 mice per group). Data are expressed as the mean ± SEM and were analyzed using one-way analysis of variance with Tukey’s multiple comparisons test. *P < 0.05, **P < 0.01, ***P < 0.001, ****P < 0.0001. The data were from at least three separate and independent studies. BMS: Basso Mouse Scale; DMSO: dimethyl sulfoxide; dpi: days post-injury; SCI: spinal cord injury; Tryp: tryptanthrin.
Figure 5
Figure 5
Tryp inhibits neuronal loss after spinal cord injury. (A) Typical Nissl staining images showing the retention of VMNs in spinal cord of Sham + DMSO, Sham + Tryp, SCI + DMSO, and SCI + Tryp mice at 14 dpi. The areas marked by boxes were shown in the ‘Enlarge’ panels. Scale bars: 500 μm and 200 μm (enlarge). (B) Quantitative analysis of the relative density of VMNs shown in A (normalized to SCI + DMSO group, n = 10 sections of 5 mice per group). (C) Immunostaining of NeuN (green) in spinal cord of Sham + DMSO, Sham + Tryp, SCI + DMSO and SCI + Tryp mice at 14 dpi. The areas marked by boxes were shown in the ‘Enlarge’ panels. Scale bars: 500 μm and 200 μm (enlarge). (D) Quantitative analysis of NeuN+ cell density shown in C (n = 15 sections of 5 mice per group). (E) Western blot analysis of the expression of B-cell lymphoma-2 (Bcl-2) and Bcl-2-associated protein X (Bax) in spinal cord of Sham + DMSO, Sham + Tryp, SCI + DMSO and SCI + Tryp mice at 14 dpi. (F, G) Quantitative analysis of Bcl-2 (F) and Bax (G) protein levels shown in (E) (normalized to β-actin, n = 15 mice per group). (H, J) Confocal laser scanning microscopy double immunostaining images (left 40× and right 60× magnification) of MBP (red) and NF (green) (H), and MBP (red) and NF (green) (J) in spinal cord lesion area of Sham + DMSO (T8–T10), Sham + Tryp (T8–T10), SCI + DMSO and SCI + Tryp mice at 28 dpi. Higher magnification panels show single optical Z sections of areas marked by boxes. MBP+NF+ puncta were marked by white arrowheads. The dotted lines referred to the boundaries of the spinal cord lesion area. Scale bars, 100 μm and 20 μm (enlarge). (I) Quantitative analysis of the percentages of MBP+NF+/NF+ shown in H (n = 6 mice per group). (K, L) Quantitative analysis of the relative intensity of NF (K) (normalized to SCI + DMSO group, n = 6 mice per group) and MBP (L) (normalized to SCI + DMSO group, n = 6 mice per group) shown in J. Data were analyzed by one-way analysis of variance with Tukey’s multiple comparisons test in B, D, F, G, and I. Data of the relative intensity of NF (K) and MBP (L) were analyzed by unpaired two-tailed Student’s t-test. *P < 0.05, **P < 0.01, ***P < 0.001, ****P < 0.0001. Data were presented as mean ± SEM. The data were from at least three separate and independent studies. DMSO: Dimethyl sulfoxide; MBP: myelin basic protein; NeuN: neuron-specific nuclear protein; NF: neurofilament; ns: not significant; dpi: days post-injury; SCI: spinal cord injury; Tryp: tryptanthrin; VMNs: ventral motor neurons.
Figure 6
Figure 6
Microglia treated with tryptanthrin suppresses neuronal apoptosis through ER stress–related signaling. (A) Schematic of BV2 and N2a cell treatments and the conditional co-culture system. (B) Double immunostaining of CC-3 (green) and NeuN (red) in N2a cells incubated with conditional medium (CM) of BV2 cells treated by Ctrl (Ctrl-CM), LPS + DMSO (LD-CM) and LPS + Tryp (LT-CM). CC-3+NeuN+ cells were marked by white arrows. Scale bar: 100 μm. (C) Percentages of CC-3+NeuN+ cells shown in B (n = 6 individual samples of cells per group). (D) Western blot analysis of Bcl-2 and Bax expression in N2a cells incubated with Ctrl-CM, LD-CM and LT-CM. (E, F) Quantitative analysis of Bcl-2 (E) and Bax (F) protein levels shown in D (normalized to β-actin, n = 6 individual samples of cells per group). (G) Western blot analysis of p-eIF2α, eIF2α, ATF4 and CHOP in N2a cells incubated with Ctrl-CM, LD-CM and LT-CM. (H–K) Quantitative analysis of p-eIF2α (H, normalized to eIF2α), eIF2α (I, normalized to β-actin), ATF4 (J, normalized to β-actin) and CHOP (K, normalized to β-actin) protein levels shown in G (n = 6 individual samples of cells per group). (L) Double immunostaining of CHOP (green) and NeuN (red) in N2a cells incubated with Ctrl-CM, LD-CM and LT-CM. The areas marked by boxes were shown in the ‘Enlarge’ panels. Scale bars: 50 μm and 20 μm (enlarge). (M) Percentages of CHOP+NeuN+ cells according to L (n = 6 individual samples of cells per group). Data are expressed as the mean ± SEM and were analyzed using one-way analysis of variance with Tukey’s multiple comparisons test. *P < 0.05, **P < 0.01, ***P < 0.001, ****P < 0.0001. The data were from at least three separate and independent studies. ATF4: Activating transcription factor 4; CC-3: cleaved caspase-3; CHOP: CCAAT-enhancer-binding protein homologous protein; DMSO: dimethyl sulfoxide; eIF2α: eukaryotic initiation factor 2α; ER: endoplasmic reticulum; LPS: lipopolysaccharide; NeuN: neuron-specific nuclear protein; ns: not significant; p: phosphorylated; Tryp: tryptanthrin.
Figure 7
Figure 7
Working model of tryptanthrin in microglial polarization after SCI. Tryp promotes microglial polarization to the M2 phenotype by targeting the cGAS/STING/NF-κB axis, which inhibits neuroinflammation and neuronal loss, and eventually facilitates functional recovery after SCI. cGAS: Cyclic GMP-AMP synthase; ER: endoplasmic reticulum; IκB-α: nuclear factor-κB inhibitory protein α; NF-κB: nuclear factor-κB; SCI: spinal cord injury; STING: phosphorylated stimulator of interferon genes.

Similar articles

Cited by

References

    1. Abe T, Barber GN. Cytosolic-DNA-mediated, STING-dependent proinflammatory gene induction necessitates canonical NF-κB activation through TBK1. J Virol. 2014;88:5328–5341. - PMC - PubMed
    1. Ahuja CS, Wilson JR, Nori S, Kotter MRN, Druschel C, Curt A, Fehlings MG. Traumatic spinal cord injury. Nat Rev Dis Primers. 2017;3:17018. - PubMed
    1. Al-Sammarraie N, Mahmood M, Ray SK. Neuroprotective role of Noggin in spinal cord injury. Neural Regen Res. 2023;18:492–496. - PMC - PubMed
    1. Anjum A, Yazid MD, Fauzi Daud M, Idris J, Ng AMH, Selvi Naicker A, Ismail OHR, Athi Kumar RK, Lokanathan Y. Spinal cord injury: pathophysiology, multimolecular interactions, and underlying recovery mechanisms. Int J Mol Sci. 2020;21:7533. - PMC - PubMed
    1. Ban M, Su H, Zeng X, Chen C, Zhou S, Chen X, Nong Z. An active fraction from Spatholobus suberectus dunn inhibits the inflammatory response by regulating microglia activation, switching microglia polarization from M1 to M2 and suppressing the TLR4/MyD88/NF-κB pathway in LPS-stimulated BV2 cells. Heliyon. 2023;9:e14979. - PMC - PubMed