. 2024 May 27;27(6):110132.
doi: 10.1016/j.isci.2024.110132. eCollection 2024 Jun 21.

Teriflunomide/leflunomide synergize with chemotherapeutics by decreasing mitochondrial fragmentation via DRP1 in SCLC

Affiliations

Teriflunomide/leflunomide synergize with chemotherapeutics by decreasing mitochondrial fragmentation via DRP1 in SCLC

Tamara Mirzapoiazova et al. iScience. .

Abstract

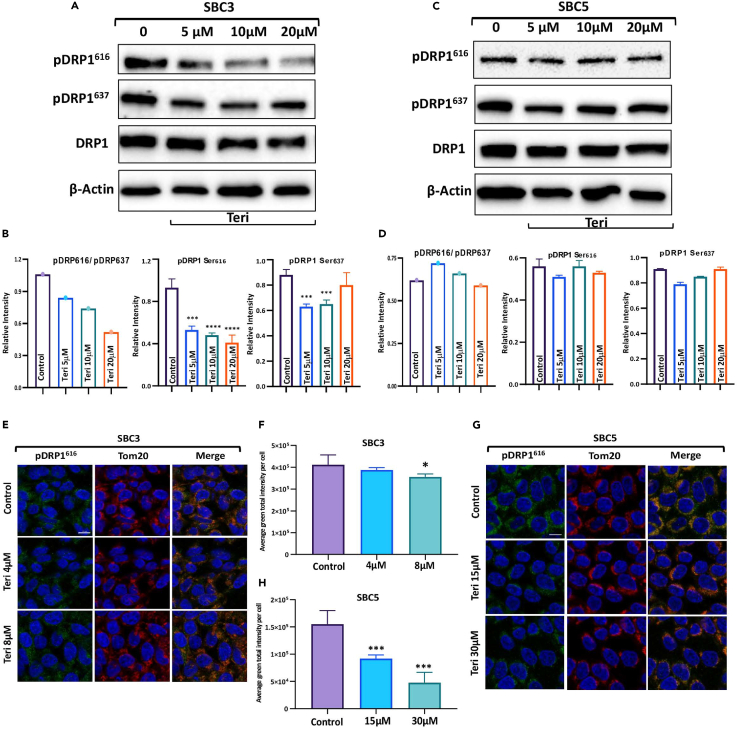
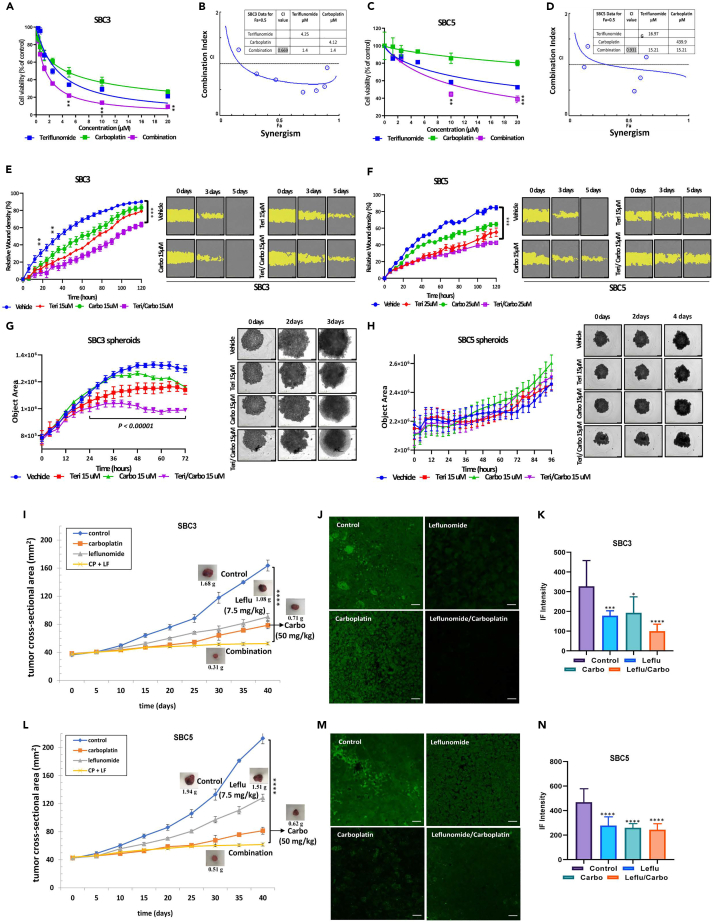
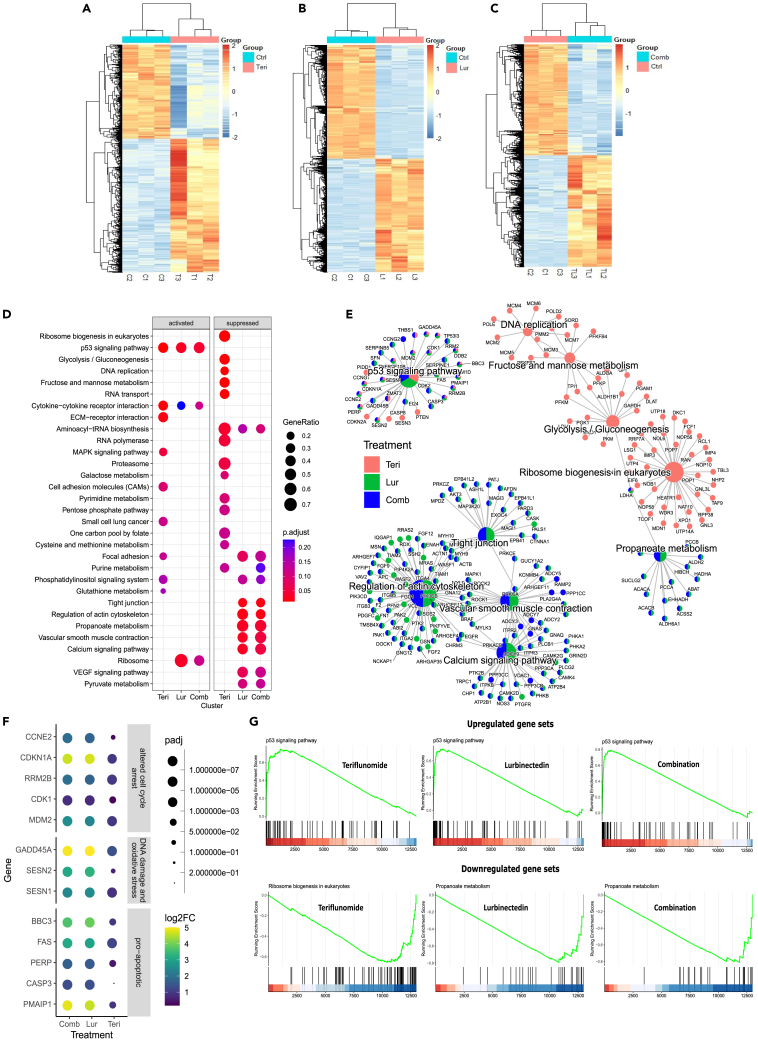
Although up to 80% small cell lung cancer (SCLC) patients' response is good for first-line chemotherapy regimen, most patients develop recurrence of the disease within weeks to months. Here, we report cytostatic effect of leflunomide (Leflu) and teriflunomide (Teri) on SCLC cell proliferation through inhibition of DRP1 phosphorylation at Ser616 and decreased mitochondrial fragmentation. When administered together, Teri and carboplatin (Carbo) act synergistically to significantly inhibit cell proliferation and DRP1 phosphorylation, reduce abundance of intermediates in pyrimidine de novo pathway, and increase apoptosis and DNA damage. Combination of Leflu&Carbo has anti-tumorigenic effect in vivo. Additionally, lurbinectedin (Lur) and Teri potently and synergistically inhibited spheroid growth and depleted uridine and DRP1 phosphorylation in mouse tumors. Our results suggest combinations of Carbo and Lur with Teri or Leflu are efficacious and underscore how the relationship between DRP1/DHODH and mitochondrial plasticity serves as a potential therapeutic target to validate these treatment strategies in SCLC clinical trials.

Keywords: cancer; cell biology; molecular biology; physiology.


Conflict of interest statement

R.S., S.T.R, and T.M. report a patent pending for combination treatment of teriflunomide&leflunomide with carboplatin&lurbinectedin.

Figures

None
Graphical abstract
Figure 1
Figure 1
DRP1 expression and targeting by Leflu and Teri directly in SCLC (A) DNM1L RNA expression in cancer (TCGA dataset). (B) TCGA data for the survival probability of DRP1 in LUAD. Graph shows the survival curves for two groups, low and high level of DNM1L gene expression in tumor tissue. Dataset is available on website: https://doi.org/10.1016/j.neo.2017.05.002 (UALCAN). (C) DRP1 mRNA expression in normal and SCLC lung tissue (NCBI/GEO/GSE149507). Bar graphs represent mean ± SEM, and p value was calculated by Student’s t test, ∗∗∗p < 0.001. (D) Representative immunoblots showing expression of DHODH and DRP1 in SCLC cell lines and BEAS 2B cells. (E) Binding AA docking poses of Leflu, Teri, and MDV1 with DRP1. Binding mode of Leflu and Teri at the GDP-binding site of DRP1 protein. MDV1 binds at another site with low score. (F) 2D representation of the binding pose. Red arrows represent hydrogen bonds. (G) Effect of Teri and Leflu on SBC3 and SBC5 cells proliferation was recorded by the Sartorius IncuCyte S3 live-cell analysis system (n = 6, biologically independent samples). Data are represented as mean ± SD. (D) and (G) were repeated independently three and two times with similar results, accordingly.
Figure 2
Figure 2
Teri affects the phosphorylation of DRP1 at Ser616 and mitochondrial/nuclear morphology (A) Effect of Teri on DRP1 phosphorylation; SBC3 cell lysates were subjected to immunoblotting with DRP1, pDRP1 Ser616 (activated form), and Ser637 (inactivated form) antibodies. (B) The ratio of pDRP1 Ser616 to pDRP1 Ser637 in SBC3 cells. Expression level of pDRP1 Ser616 to pDRP1 Ser637 was calculated via densitometric analysis of each blot using ImageJ software and normalized to actin level. (C and D) DRP1 phosphorylation in SBC5 cells after Teri dose and calculation of the expression ratio of pDRP1 Ser616 to pDRP1 Ser637. (E and G) Immunofluorescence staining of SBC3 and SBC5 cells with pDRP1 Ser616 and Tom20 antibodies. Scale bar: 10 μm (n = 3, biologically independent samples). (F and H) Calculating pDRP1 Ser616 fluorescence signal by QuPath software (see STAR Methods). (I and J) The mitochondrial and nuclear surface areas of SBC3 and SBC5 cells were obtained with Imaris Cells module. Individual cell data are plotted and organized by treatment group. The minimal number of SBC3 cells analyzed for each group was 103 (M1 10 μM) and the maximal was 383 (Control) (I). The minimal number of SBC5 cells analyzed for each group was 357 (MDIVI1 10 μM) and the maximal was 570 (Control) (J). (I) and (G) (right) are representative immunofluorescence (IF) images ([red] Tom 20 antibody with Hoechst 33342 [blue]) of SBC3 and SBC5 mitochondria after treatments. Scale bar: 20 μm. Bar graphs represent means ±SEM in (B), (D), (F), (H), (I), and (J). p values were calculated by ANOVA with Tukey post-test. ∗p < 0.05; ∗∗p < 0.01; ∗∗∗p < 0.001; ∗∗∗∗p < 0.0001 in (B), (D), (F), (H), (I), and (J). (A), (C), (E), and (G) were repeated independently three times and (I) and (J) two times.
Figure 2
Figure 2
Teri affects the phosphorylation of DRP1 at Ser616 and mitochondrial/nuclear morphology (A) Effect of Teri on DRP1 phosphorylation; SBC3 cell lysates were subjected to immunoblotting with DRP1, pDRP1 Ser616 (activated form), and Ser637 (inactivated form) antibodies. (B) The ratio of pDRP1 Ser616 to pDRP1 Ser637 in SBC3 cells. Expression level of pDRP1 Ser616 to pDRP1 Ser637 was calculated via densitometric analysis of each blot using ImageJ software and normalized to actin level. (C and D) DRP1 phosphorylation in SBC5 cells after Teri dose and calculation of the expression ratio of pDRP1 Ser616 to pDRP1 Ser637. (E and G) Immunofluorescence staining of SBC3 and SBC5 cells with pDRP1 Ser616 and Tom20 antibodies. Scale bar: 10 μm (n = 3, biologically independent samples). (F and H) Calculating pDRP1 Ser616 fluorescence signal by QuPath software (see STAR Methods). (I and J) The mitochondrial and nuclear surface areas of SBC3 and SBC5 cells were obtained with Imaris Cells module. Individual cell data are plotted and organized by treatment group. The minimal number of SBC3 cells analyzed for each group was 103 (M1 10 μM) and the maximal was 383 (Control) (I). The minimal number of SBC5 cells analyzed for each group was 357 (MDIVI1 10 μM) and the maximal was 570 (Control) (J). (I) and (G) (right) are representative immunofluorescence (IF) images ([red] Tom 20 antibody with Hoechst 33342 [blue]) of SBC3 and SBC5 mitochondria after treatments. Scale bar: 20 μm. Bar graphs represent means ±SEM in (B), (D), (F), (H), (I), and (J). p values were calculated by ANOVA with Tukey post-test. ∗p < 0.05; ∗∗p < 0.01; ∗∗∗p < 0.001; ∗∗∗∗p < 0.0001 in (B), (D), (F), (H), (I), and (J). (A), (C), (E), and (G) were repeated independently three times and (I) and (J) two times.
Figure 3
Figure 3
Effect of Teri and Leflu on in vitro and in vivo models in combination with Carbo SBC3 (A) and SBC5 (C) cells were treated with different concentrations of Teri and Carbo for 72 h to detect cell viability (n = 3, biologically independent samples). (B and D) Combination index (CI) was calculated using the Chou-Talalay method to find synergism. IC50 isobologram after SBC3 and SBC5 cells treatment with Teri/Carbo. CI values at the 50% inhibition of cell proliferation were below 1, indicating a synergistic effect of Teri/Carbo on SBC3 (0.562) and an additive effect on SBC5 (1.02) cells. (E and F) SBC3/SBC5 relative wound density at different time points (left panels, % mean values ± SD, monolayer wound measurements). Representative IncuCyte brightfield images of wounds on different days masked in yellow (right panels) (n = 3, biologically independent samples); experiment was repeated independently two times. (G and H) Live spheroid images analysis and IncuCyte brightfield images of SBC3 and SBC5 spheroids. Left panels show data as mean ± SD (n = 2, four technical replicates). (I and K) Athymic nude mice were implanted with SBC3 and SBC5 cells and treated with vehicle (control), Carbo (50 mg/kg), Leflu (7.5 mg/kg), and Carbo&Leflu, five mice per group. (J and M) Control and treated FFPE mouse tumor sections were stained with phospho-DRP1 (Ser616). Displayed are representative single channel Airyscan images for each group. Scale bar 20 μm. Multichannel images of pDRP1, EpCAM, and nuclei IF are available (Figure S6). (K and N) Mean signal intensities were measured from confocal images with ZEN 2.3 Lite (see STAR methods). Data are represented as means ± SEM in (A), (C), (G), (H), (I), (K), (L), and (M). p values were calculated by Student’s t test, ∗∗p < 0.01; ∗∗∗∗p < 0.0001 vs. control in (A), (C), (E), (F), (I), and (L); and by ANOVA with Tukey post-test, ∗p < 0.05; ∗∗p < 0.01;∗∗∗p < 0.001; ∗∗∗∗p < 0.0001 vs. control in (K) and (N). (A), (C), (E), (F), (G), and (H) were repeated independently two times with similar results.
Figure 4
Figure 4
Teri&Carbo affected DRP1 phosphorylation, apoptotic signaling, and DNA damage response and disturbed purine/pyrimidine pools DRP1 phosphorylation response to drug treatment in SBC3 (A) and SBC5 cells (B) and the average relative density of pDRP1 Ser616 and Ser637. (C and D) Western blot images and band densitometry analysis of levels of apoptotic markers in SBC3 and SBC5 cells. (E and F) Western blot images and band densitometry analysis of levels of DNA damage regulatory proteins in SBC3 and SBC5 cells. GAPDH was used as an internal control in western blot panels. Experiments were repeated independently three times with similar results. (G) Schematic diagram displays the effect of Teri&Carbo treatment on purine and pyrimidine pools in SBC3 cells. (H) Statistical comparisons of drug treatments were performed to evaluate the synergistic effect of Teri&Carbo on the concentrations of pyrimidine/purine bases. The table includes synergistically affected substances and p-values for three treatments of SBC3 cells. (I–K) Pyrimidine, purine, and purine/pyrimidine substance concentrations measured by LC-MS/MS in SBC3 cells after 24 h (n = 3, biologically independent samples). Bar graphs show concentration of synergistically significant substances from table (H). Concentrations of measured substances are available in the Table S2 and https://doi.org/10.17632/zfmb6dtw78.1. p values were calculated and were assessed with a linear model (ANOVA). See STAR methods, ∗p < 0.05; ∗∗p < 0.01. (L) Total clone number for SBC3 (DOX−/DOX+) and SBC5(DOX−/DOX+) cells. Each CRISPR-edited cell sample was sorted with single cell with DAPI into 3 × 96 well plates. The total visible clones were counted after 14 days incubation without DOX. (M) The NanoString differential expression analysis of gene patterns for SBC3 and SBC5 (DOX+ vs. DOX−). The dot plots were generated using the R ggplot2 package. (N) SBC3 and SBC5 expression pattern of public dataset GSE1037. The normalized data from NIH Gene Expression Omnibus (GEO). SBC3, SBC5, and 19 normal samples from GSE1037 are used for the analysis to identify the different expression pattern of SBC3 and SBC5 (vs. normal) using the R LIMMA package (v3.42.2). The differentially expressed genes are identified with FDR<0.05. (M and N) The dot size represents the p value, and the color represents the expression levels (log2-fold change). Bar graphs represent means ± SEM in (A)–(L). p values were calculated by ANOVA with Tukey post-test; ∗p < 0.05, ∗∗p < 0.01, ∗∗∗p < 0.001, ∗∗∗∗p < 0.0001 vs. control in (A), (B), (C), (D), (E), (F), and (L).
Figure 5
Figure 5
Spheroid response for drug treatment (A and B) LDH cytotoxicity/death assay. The synergy of Teri&Lur was calculated by Chou-Talalay method. CI isobologram analysis indicated synergy for Teri&Lur doses below midline. Insert table shows CI of treatment. (C and D) H446 and SBC3 spheroid cell lysates were subjected to immunoblotting with RNA poly II and DNA damage marker antibodies (left panel) and DRP1, MFN2, and ERK antibodies (middle panel). (Right panel) Cell-cycle regulatory antibody MDM2, p21, E2F1, CDK4, and cyclin D1 were used for western blotting detection after 72 h of drug treatment. Experiments were repeated independently three times with similar results. (E) H446 spheroid MitoSOX production was detected and quantified with IncuCyte system (n = 3, biologically independent samples). Bar graphs show the maximal level of MitoSOX in H446 spheroids after 44 h of treatment. Bottom MitoSOX/brightfield images of spheroids. Scale bar: 100 μm. (F) Dose-response relative ATP measurement in H446 spheroids after 72 h treatment with Teri, Lur, and Teri-Lur (n = 3, biologically independent samples). Significance between Lur and T-Lur treatments was assessed by Student’s t test; ∗∗p < 0.01, ∗∗∗∗p < 0.0001 (right panel). (G) Mitochondrial representative images: EL (elongated), R (round), ITM (intermediate), and CL (cluster) with Imaris Surface detections of individual mitochondria. Scale bar: 0.3 μm. (H) Panels show the percentage of mitochondria from the total number based on length ratios of round, elongated, and ITM groups. The average number of cells was 344–575 cells per group. (I) In vivo efficacy of Leflu&Lur in mouse xenograft. Each value in graph line is the mean ± SD from five mice per group (control vs. combination, ∗∗∗∗p < 0.0001, Student’s t test). (J) Control and treated FFPE mouse tumor sections were stained with phospho-DRP1 (Ser616). Displayed are representative single-channel Airyscan images for each group. Scale bar 20 μm. Multichannel images of pDRP1, EpCAM, and nuclei IF are available (Figure S11). (K) Mean signal intensities were measured from confocal images with ZEN 2.3 Lite (see STAR methods). (L) Schematic diagram displays the effect of Leflu&Lur combination on purine/pyrimidine pools in mouse xenograft. (M and N) Purine and pyrimidine substances measured by LC-MS/MS in mouse tumor tissue at the end of the study. All substance concentrations are available in Table S5 and https://doi.org/10.17632/ghzcbd74tz.1. p values were calculated and were assessed with a linear model (ANOVA) see STAR methods, ∗∗p < 0.01, ∗∗∗p < 0.001. Bar graphs represent means ± SEM in (E), (F), (H), (K), (M), and (N). p values were calculated by ANOVA with Tukey post-test, ∗p < 0.05; ∗∗p < 0.01; ∗∗∗p < 0.001; ∗∗∗∗p < 0.0001 vs. control in (E), (H), (L), (M), and (N).
Figure 6
Figure 6
RNA-seq-based gene expression profiles in response to different treatment (A–C) The RNA-seq differentially expressed gene profile for Teri, Lur, and combination treatment (vs. control) (GSE267928). (D) The comparison of top enriched KEGG pathways for the different treatment expression profiles. (E) The network plot of top enriched KEGG pathways comparing these three different treatments and the significant alternated genes. The proportion of treatment in the pie chart is determined by the number of different expressed genes in each treatment expression profile. (F) The dot plot for these different expressed genes in altered cell-cycle arrest, DNA damage and oxidative stress, and pro-apoptotic gene sets. The color of the dot represents the log2-fold change compared between the treatment and control. The dot size represents the adjusted p value. (G) The GSEA plots for the top activated and top suppression KEGG pathways for each treatment.

Similar articles

Cited by

References

    1. Koinis F., Kotsakis A., Georgoulias V. Small cell lung cancer (SCLC): no treatment advances in recent years. Transl. Lung Cancer Res. 2016;5:39–50. doi: 10.3978/j.issn.2218-6751.2016.01.03. - DOI - PMC - PubMed
    1. Rudin C.M., Ismaila N., Hann C.L., Malhotra N., Movsas B., Norris K., Pietanza M.C., Ramalingam S.S., Turrisi A.T., Giaccone G. Treatment of small-cell lung cancer: American Society of Clinical Oncology endorsement of the American College of Chest Physicians guideline. J. Clin. Onco. 2015;33:4106–4111. doi: 10.1200/JCO.2015.63.7918. - DOI - PubMed
    1. Society A.C. American Cancer Society; 2015. Cancer Facts & Figures 2015.
    1. Subbiah S., Nam A., Garg N., Behal A., Kulkarni P., Salgia R. Small cell lung cancer from traditional to innovative therapeutics: building a comprehensive network to optimize clinical and translational research. J. Clin. Med. 2020;9 doi: 10.3390/jcm9082433. - DOI - PMC - PubMed
    1. Ma Y., Wang L., Jia R. The role of mitochondrial dynamics in human cancers. Am. J. Cancer Res. 2020;10:1278–1293. - PMC - PubMed

LinkOut - more resources