. 2024 Jul:131:103949.
doi: 10.1016/j.jag.2024.103949.

Optimizing the detection of emerging infections using mobility-based spatial sampling

Affiliations

Optimizing the detection of emerging infections using mobility-based spatial sampling

Die Zhang et al. Int J Appl Earth Obs Geoinf. 2024 Jul.

Abstract

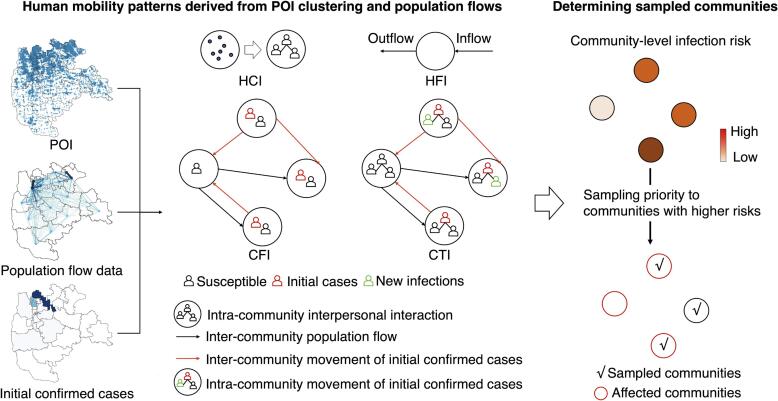
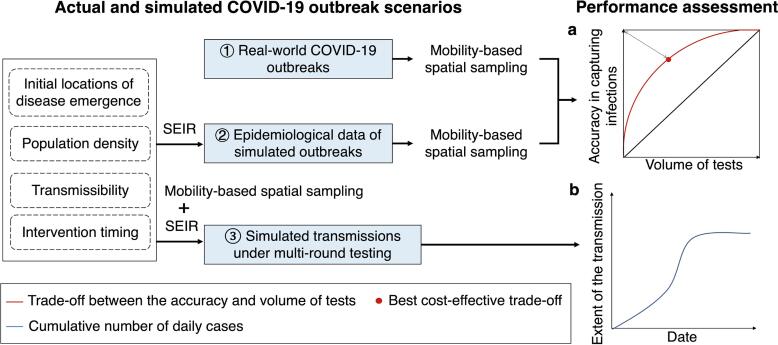
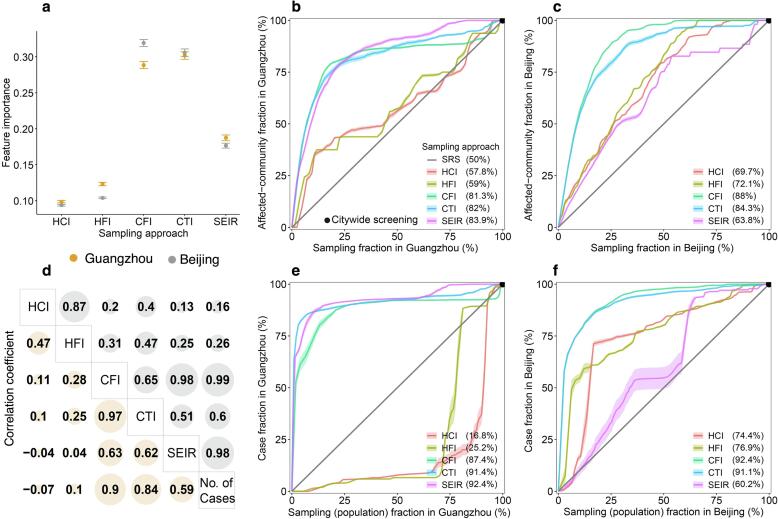
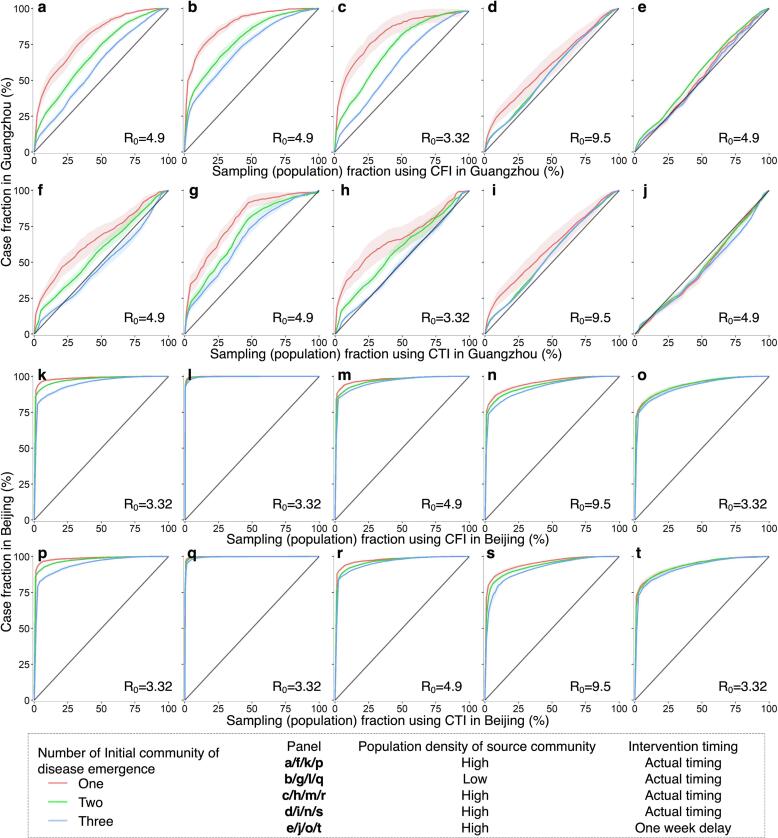
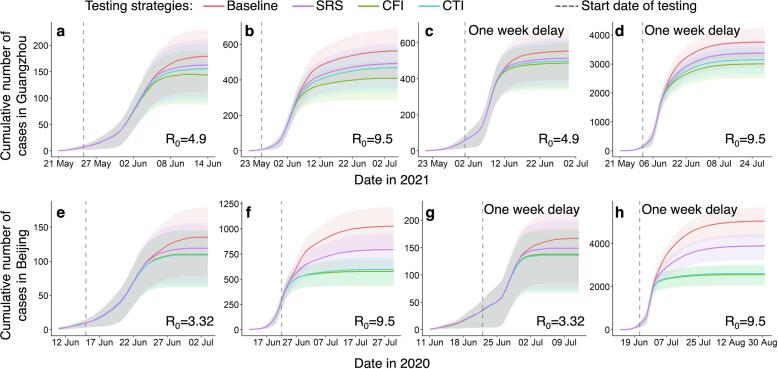
Timely and precise detection of emerging infections is imperative for effective outbreak management and disease control. Human mobility significantly influences the spatial transmission dynamics of infectious diseases. Spatial sampling, integrating the spatial structure of the target, holds promise as an approach for testing allocation in detecting infections, and leveraging information on individuals' movement and contact behavior can enhance targeting precision. This study introduces a spatial sampling framework informed by spatiotemporal analysis of human mobility data, aiming to optimize the allocation of testing resources for detecting emerging infections. Mobility patterns, derived from clustering point-of-interest and travel data, are integrated into four spatial sampling approaches at the community level. We evaluate the proposed mobility-based spatial sampling by analyzing both actual and simulated outbreaks, considering scenarios of transmissibility, intervention timing, and population density in cities. Results indicate that leveraging inter-community movement data and initial case locations, the proposed Case Flow Intensity (CFI) and Case Transmission Intensity (CTI)-informed spatial sampling enhances community-level testing efficiency by reducing the number of individuals screened while maintaining a high accuracy rate in infection identification. Furthermore, the prompt application of CFI and CTI within cities is crucial for effective detection, especially in highly contagious infections within densely populated areas. With the widespread use of human mobility data for infectious disease responses, the proposed theoretical framework extends spatiotemporal data analysis of mobility patterns into spatial sampling, providing a cost-effective solution to optimize testing resource deployment for containing emerging infectious diseases.

Keywords: Data analysis; Emerging infectious disease; Human mobility; Spatial sampling; Testing allocation.


Conflict of interest statement

The authors declare that they have no known competing financial interests or personal relationships that could have appeared to influence the work reported in this paper.

Figures

Fig. 1
Fig. 1
Framework of mobility-based spatial sampling approaches for detecting emerging infections at the community level. Utilizing data on Points of Interest (POIs), travel flows derived from mobile phone signaling, and the locations of initial confirmed cases within a city, four spatial sampling approaches were developed: human contact intensity (HCI), human flow intensity (HFI), case flow intensity (CFI), and case transmission intensity (CTI). The spatial sampling prioritizes communities based on infection risk (ρi), where communities with a higher ρi are given higher sampling priorities.
Fig. 2
Fig. 2
Design of assessing the performance of mobility-based spatial sampling approaches to detect emerging infections at the community level. Based on actual COVID-19 outbreaks and simulated outbreaks using an epidemiological model (SEIR) under the different transmissibility, intervention, and population density scenarios, trade-offs between the volume of tests and the detection of infections throughout an outbreak were employed to estimate the performance of sampling approaches, where the red curve and black diagonal represent the performance of the mobility-based sampling and simple random sampling, respectively. The red dot on the red curve with the least geometric distance to the upper left corner was considered the best cost-effective trade-off. Additionally, spatial sampling was incorporated into SEIR to simulate the disease transmission under multiple rounds of mass testing, where the cumulative number of estimated cases depicted the extent of the transmission within a city. Less cases under an outbreak using a sampling approach indicated a more significant effect on interrupting the spread of the disease. (For interpretation of the references to color in this figure legend, the reader is referred to the web version of this article.)
Fig. 3
Fig. 3
Overview of the data context of real-world COVID-19 outbreaks in Guangzhou and Beijing. a and e, Geospatial distributions of cases at the community level during the importation-related outbreaks. b and f, Geospatial distributions of community-level population density, which were classified into five levels. c and g, Geospatial patterns of point-of-interest (POI) kernel density. d and h, Human mobility patterns across communities within a city before travel restrictions are implemented. The directed lines depict inter-community origin–destination travel networks on 21–22 May 2021 in Guangzhou and 11–12 June 2020 in Beijing, respectively. The width and color of an edge represent the volume of an inter-community flow. In each panel, a darker color indicates a higher level of interest.
Fig. 4
Fig. 4
Performance of mobility-based spatial sampling approaches in detecting COVID-19 affected communities and cases at varying sample sizes. Four mobility-based spatial sampling approaches (HCI − human contact intensity; HFI − human flow intensity; CFI − case flow intensity; CTI − case transmission intensity) and an epidemiological model (SEIR) were evaluated. a, The relative importance of infection risk (ρi) in distinguishing communities with COVID-19 cases from those without, determined by a random forest built-in feature importance measure. Error bars indicate 95% confidence intervals. d, Pearson correlation coefficients between infection risk estimated from each sampling method and the number of confirmed cases during the outbreaks. For panels b-c and e-f, communities with high infection risk were sampled by ranking community-level ρi from high to low, excluding the simple random sampling (SRS) method. The x-axis in b and c represents the proportion of sampled communities over the total number of communities in Guangzhou and Beijing, respectively. In e and f, the x-axis denotes the fraction of sampled populations among the total populations. The y-axis in b and c represents the proportion of affected communities sampled over the total communities with COVID-19 cases in Guangzhou and Beijing. In e and f, the y-axis displays the proportion of cases detected by different sampling approaches among the total cases. The percentage in the legend indicates the area under each curve, reflecting the average performance of each sampling approach with different sample sizes. The black dot at the upper right corner of each panel represents citywide screening for the entire population, assuming the test can detect all infected people in the city. Shaded regions denote 95% confidence intervals.
Fig. 5
Fig. 5
Performance of mobility-based spatial sampling in simulated outbreaks under various scenarios utilizing a travel network-based epidemiological model. The outbreaks were simulated with initiation in one, two, or three communities selected randomly based on the probability weight of population density or inverse population density. Different basic reproduction numbers (R0) were considered for the original SARS-CoV-2, Delta, and Omicron variants, along with variations in the timing of interventions. The assessment focused on two optimized mobility-based spatial sampling approaches, namely CFI (case flow intensity) and CTI (case transmission intensity). The x-axis represents the fraction of sampled populations among the total populations in Guangzhou and Beijing using CFI and CTI, respectively. The y-axis presents the proportion of cases detected by different sampling approaches in Guangzhou and Beijing, respectively. The diagonal line in each panel symbolizes the performance of simple random sampling, while the shaded regions indicate the 95% confidence intervals.
Fig. 6
Fig. 6
Impact of spatial sampling on multi-round testing for detecting infections to contain transmission. The simulations for Guangzhou and Beijing scenarios are presented in panels a-d and e-h, respectively. Multiple rounds of testing for detecting infections were implemented using spatial sampling and incorporated into the travel network-based epidemiological model. The epidemiological model simulated the epidemic transmission, measured by the daily cumulative cases, under different sampling approaches and outbreak scenarios. The baseline approach of multi-round testing involved the equal allocation of daily testing resources to all communities within a city. However, simple random sampling (SRS), case flow intensity (CFI), and case transmission intensity (CTI) sampled a given number of communities per day and allocated more resources to sampled communities than unsampled areas. Spatial multiple rounds of testing were executed when a community could be sampled several times. The outbreaks were tested under different settings, including various basic reproduction numbers (R0) of the original SARS-CoV-2, Delta, and Omicron variants, and the timing of testing conduction. Detection testing started on the fifth day of an outbreak for panels a-b and e-f, while it began on the twelfth day of the outbreak for panels c-d and g-h. The shaded regions represent the interquartile ranges of the cumulative number of daily cases in the simulated outbreaks.

Update of

Similar articles

Cited by

  • Toward optimal disease surveillance with graph-based active learning.
    Tsui JL, Zhang M, Sambaturu P, Busch-Moreno S, Suchard MA, Pybus OG, Flaxman S, Semenova E, Kraemer MUG. Tsui JL, et al. Proc Natl Acad Sci U S A. 2024 Dec 24;121(52):e2412424121. doi: 10.1073/pnas.2412424121. Epub 2024 Dec 19. Proc Natl Acad Sci U S A. 2024. PMID: 39700149 Free PMC article.

References

    1. Aleta A., Martín-Corral D., Pastore y Piontti A., Ajelli M., Litvinova M., Chinazzi M., Dean N.E., Halloran M.E., Longini I.M., Jr, Merler S., Pentland A., Vespignani A., Moro E., Moreno Y. Modelling the impact of testing, contact tracing and household quarantine on second waves of COVID-19. Nat Hum Behav. 2020;4:964–971. doi: 10.1038/s41562-020-0931-9. - DOI - PMC - PubMed
    1. Baker C.M., Chades I., McVernon J., Robinson A.P., Bondell H. Optimal allocation of PCR tests to minimise disease transmission through contact tracing and quarantine. Epidemics. 2021;37 doi: 10.1016/j.epidem.2021.100503. - DOI - PMC - PubMed
    1. Baker R.E., Mahmud A.S., Miller I.F., Rajeev M., Rasambainarivo F., Rice B.L., Takahashi S., Tatem A.J., Wagner C.E., Wang L.-F., Wesolowski A., Metcalf C.J.E. Infectious disease in an era of global change. Nat Rev Microbiol. 2022;20:193–205. doi: 10.1038/s41579-021-00639-z. - DOI - PMC - PubMed
    1. Bansal S., Grenfell B.T., Meyers L.A. When individual behaviour matters: homogeneous and network models in epidemiology. J R Soc Interface. 2007;4:879–891. doi: 10.1098/rsif.2007.1100. - DOI - PMC - PubMed
    1. Benzell S.G., Collis A., Nicolaides C. Rationing social contact during the COVID-19 pandemic: Transmission risk and social benefits of US locations. Proc. Natl. Acad. Sci. 2020;117:14642. doi: 10.1073/pnas.2008025117. - DOI - PMC - PubMed

LinkOut - more resources