. 2024 Jun 17;20(9):3442-3460.
doi: 10.7150/ijbs.93462. eCollection 2024.

Negative Regulation of CPSF6 Suppresses the Warburg Effect and Angiogenesis Leading to Tumor Progression Via c-Myc Signaling Network: Potential Therapeutic Target for Liver Cancer Therapy

Affiliations

Negative Regulation of CPSF6 Suppresses the Warburg Effect and Angiogenesis Leading to Tumor Progression Via c-Myc Signaling Network: Potential Therapeutic Target for Liver Cancer Therapy

Deok Yong Sim et al. Int J Biol Sci. .

Abstract

In this study, we explored the oncogenic mechanism of cleavage and polyadenylation-specific factor 6 (CPSF6) in hepatocellular carcinoma (HCC). CPSF6 was overexpressed in HCC tissues with poor survival rates compared to normal tissues. Hence, CPSF6 depletion suppressed cell viability and colony formation, induced apoptosis via PARP cleavage, and increased the sub-G1 population of Hep3B and Huh7 cells. In addition, CPSF6 enhanced the stability of c-Myc via their binding through nuclear co-localization by binding to c-Myc at the site of 258-360. Furthermore, c-Myc degradation by CPSF6 depletion was disturbed by FBW7 depletion or treatment with the proteasomal inhibitor MG132. Additionally, CPSF6 depletion suppressed the Warburg effect by inhibiting glucose, HK2, PKM2, LDH, and lactate; showed a synergistic effect with Sorafenib in Hep3B cells; and inhibited angiogenesis by tube formation and CAM assays, along with decreased expression and production of vascular endothelial growth factor (VEGF). Notably, CPSF6 depletion attenuated PD-L1 expression and increased Granzyme B levels, along with an increase in the percentage of CD4/CD8 cells in the splenocytes of BALB/c nude mice bearing Hep3B cells. Consistently, immunohistochemistry showed that CPSF6 depletion reduced the growth of Hep3B cells in BALB/c mice in orthotopic and xenograft tumor models by inhibiting tumor microenvironment-associated proteins. Overall, these findings suggest that CPSF6 enhances the Warburg effect for immune escape and angiogenesis, leading to cancer progression via c-Myc, mediated by the HK, PD-L1, and VEGF networks, with synergistic potential with sorafenib as a molecular target for liver cancer therapy.

Keywords: CPSF6; Warburg effect; angiogenesis; c-Myc; hepatocellular carcinoma.


Conflict of interest statement

Competing Interests: The authors have declared that no competing interest exists.

Figures
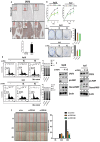
Figure 1
Figure 1
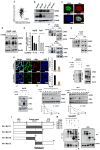
Overexpression of CPSF6 in HCC tissues and cytotoxic and apoptotic effect of CPSF6 depletion in HCCs. (A) Overexpression of CPSF6 in human HCC tissues. CPSF6 was overexpressed in human hepatocellular carcinoma tissues compared to adjacent normal tissues by immunohistochemistry. Data represent means ± SD. ***p < 0.001 vs untreated control. (B) Effect of CPSF6 depletion on the viability of Hep3B and Huh7 cells transfected with control vector or CPSF6 siRNA plasmid by MTT assay. ***p < 0.001 vs untreated control. (C) Effect of CPSF6 depletion on the number of colonies in Hep3B and Huh7 cells transfected with control vector or CPSF6 siRNA plasmid by colony formation assay. ** p < 0.01, ***p < 0.001 vs untreated control. (D) Effect of CPSF6 depletion on sub G1 population in Hep3B and Huh7 cells transfected with control vector or CPSF6 siRNA plasmid. (E) Effect of CPSF6 depletion on PARP in Hep3B and Huh7 cells transfected with control vector or CPSF6 siRNA plasmid. (F) Effect of CPSF6 depletion on the migratory activity of Hep3B cells transfected with control vector or CPSF6 siRNA plasmid by Wound healing assay. ***p < 0.001 vs untreated control. Experiments were performed in triplicate and repeated three times.
Figure 2
Figure 2
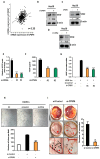
CPSF6 regulated c-Myc in HCCs through their binding and colocalization. (A) Spearman's correlation coefficient (r = 0.11) between CPSF6 and c-Myc, using TCGA database. (B) Endogenous protein expression levels of CPSF6 and c-Myc in HCCs and normal human liver lysates (NLH-1, G-Biosciences, MO, USA) by Western blotting. (C) Colocalization of CPSF6 and c-Myc in Hep3B cells by immunofluorescence (c-Myc, red; CPSF6, green; DAPI, blue). (D) Effect of CPSF6 depletion on c-Myc expression in Hep3B and Huh7 cells as determined by Western blotting. (E) Effect of CPSF6 depletion on c-Myc mRNA expression in Hep3B and Huh7 cells, as determined by qRT-PCR. (F) Binding between CPSF6 and c-Myc in CPSF6 depleted Hep3B cells as determined by IP. Hep3B and Huh7 cells transfected with control or CPSF6 siRNAs were subjected to IP and Western blotting. (G) Binding between CPSF6 and c-Myc in Hep3B cells as determined by IP. Hep3B and Huh7 cells transfected with the control vector and the CPSF6 plasmid were subjected to IP and Western blotting. (H) Effect of CPSF6 depletion on c-Myc in Hep 3B cells by IF. Hep3B cells transfected with the control vector or CPSF6 siRNA were subjected to immunofluorescence staining for c-Myc, CPSF6, and DAPI (c-Myc in red; CPSF6 in green; DAPI in blue). * p < 0.05, **p < 0.01 vs untreated control. (I) The Effect of CPSF6 depletion on c-Myc degradation in Hep3B cells. Hek-293T cells transfected with control vector, V5-tagged c-Myc, HA-tagged ubiquitin, and CPSF6 siRNA plasmids were subjected to Immunoprecipitation with anti-HA antibody detected by c-Myc antibody, while β-actin was immunoblotted as a loading control. (J) The effect of the proteasome inhibitor MG132 on c-Myc expression in CPSF6 depleted Hep3B cells. Hep3B cells transfected with CPSF6 siRNA plasmid were exposed to MG132 for 5 h for Western blotting. (K) The Effect of CPSF6 depletion on c-Myc stability in CPSF6 depleted Hep3B and Huh7 cells in the presence or absence of the protein synthesis inhibitor cycloheximide. (L) The full-length and three-fragment domains of c-Myc. (M) CPSF6 bound to c-Myc in Hek-293T cells transfected with CPSF6 and c-Myc domain plasmids.
Figure 3
Figure 3
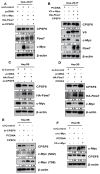
CPSF6 depletion enhanced c-Myc degradation in HCCs. (A, B) Effect of FBW7 overexpression on c-Myc expression in Hep3B and Hek-293T cells. Control vector, V5-tagged c-Myc, HA-tagged FBW7 and CPSF6 siRNA plasmids were cotransfected into Hek-293T cells for Western blotting. (C) Effect of FBW7 overexpression on c-Myc expression in CPSF6 depleted Hep3B cells. (D) Effect of FBW7 overexpression on c-Myc expression in CPSF6 overexpressed Hep3B cells. (E) Effect of CPSF6 depletion or overexpression on c-Myc (S62) and c-Myc (T58) expression in Hep3B cells. (F) Effect of c-Myc depletion or overexpression on CPSF6 expression in Hep3B cells. Experiments were performed in triplicate and repeated three times.
Figure 4
Figure 4
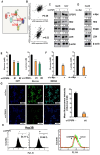
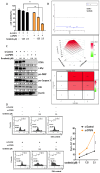
CPSF6 depletion suppressed cancer metabolism related genes, glucose and lactate in HCCs. (A) Protein-protein interaction between CPSF6, c-Myc, HK2, and PKM by STRING database. (B) A strong correlation between CPSF6 and HK2 or PKM2 by Spearman's correlation coefficients (r = 0.36, and r = 0.52, respectively) by cBioPortal database. (C) Effect of CPSF6 depletion on HK2, PKM2 and LDH in Hep3B and Huh7 cells by Western blotting. (D) Effect of c-Myc depletion on HK2, PKM2 and LDH in Hep3B cells by Western blotting. (E) Effect of CPSF6 depletion on glucose and lactate in the culture supernatants from Hep3B cells by ELISA. *p < 0.05, ***p < 0.001 vs untreated control. (F) Effect of c-Myc depletion on glucose and lactate in the culture supernatants from Hep3B cells by ELISA. ***p < 0.001 vs untreated control. (G) Effect of CPSF6 depletion on glucose uptake in Hep3B cells by Immunofluorescence. (H) Effect of CPSF6 depletion on glucose uptake in Hep3B cells by flow cytometry analysis. Data represent means ± SD. Experiments were performed in triplicate and repeated three times.
Figure 5
Figure 5
CPSF6 depletion suppressed immune escape and its related genes in HCCs. (A) Protein-protein interaction between PD-L1 and CD4 or CD8 by STRING database. (B) Close correlation between CPSF6 and PD-L1(r = 0.12), and inverse correlation between CPSF6 and CD8 (r = -0.48), or CD4(r = -0.12) by Spearman's correlation coefficient. (C) Effect of CPSF6 depletion on the expression of PD-L1 in Hep3B cells. (D) Effect of CPSF6 overexpression on the expression of PD-L1 in Hep3B cells. (E) Effect of c-Myc depletion on the expression of PD-L1 in Hep3B cells. (F) The binding between CPSF6 and PD-L1 in CPSF6 depleted Hep3B cells by IP. (G)Effect of CPSF6 depletion on mRNA levels of IL-6 and TGF-β in Hep3B cells by qRT-PCR. **p < 0.01, ***p < 0.001 vs untreated control. (H) Effect of CPSF6 depletion on protein expression of TGF-β, SMAD1/2/3 and FOXP3 in Hep3B cells. (I) Effect of CPSF6 depletion on the proliferation of murine splenocytes in the presence or absence of T cell activator Concanavalin A (Con A). **p < 0.01, ***p < 0.001 vs untreated control. (J) Effect of CPSF6 depletion on the protein expression of Granzyme B in Hep3B cells. (K) Effect of CPSF6 depletion on the percentage of CD4 and CD8 cells in the splenocytes of BALB/C mice bearing CPSF6 depleted Hep3B cells. The splenocytes of BALB/C mice were isolated six weeks after implantation of CPSF6 depleted Hep3B cells. The percentages of CD4 and CD8 cells were measured in the isolated splenocytes of BALB/c nude mice bearing Hep3B cells transfected with control vector or CPSF6 shRNA plasmid by using flow cytometry. ***p < 0.001 vs untreated control. (L) Effect of CPSF6 depletion on the expression of CD4 and CD8 cells in the tumor section of CPSF6 depleted Hep3B cells inoculated in BALB/C mice by IHC.
Figure 6
Figure 6
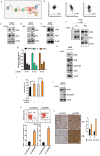
CPSF6 depletion abrogated angiogenesis in HCCs. (A) Close correlation between CPSF6 and VEGF by Spearman's correlation coefficient (r = 0.35). (B) Effect of CPSF6 depletion on VEGF in Hep3B cells by Western blotting. (C) Effect of CPSF6 overexpression on VEGF in Hep3B cells by Western blotting. (D) Effect of c-Myc depletion on VEGF in Hep3B cells by Western blotting. (E) Effect of CPSF6 depletion on mRNA level of VEGF in Hep3B cells transfected with CPSF6 siRNA plasmid by qRT-PCR. ***p < 0.001 vs untreated control. (F) Effect of CPSF6 depletion on VEGF production in CPSF6 depleted Hep3B cells by ELISA. **p < 0.01, ***p < 0.001 vs untreated control. (G) Effect of CPSF6 depletion on VEGF activity in Hep3B cells transfected with VEGF-Luc reporter by luciferase assay. ***p < 0.001 vs untreated control. (H) Effect of CPSF6 depletion on the number of tube formed networks in HUVECs compared to untreated control. Tube formation assay was conducted with the culture supernatants from Hep3B cells transfected by CPSF6 siRNA or negative control siRNA. ***p < 0.001 vs untreated control. (I) Effect of CPSF6 depletion on the number of neovascularization networks in CAMs. CAM assay was conducted with the culture supernatants from Hep3B cells transfected by CPSF6 siRNA. **p < 0.01 vs untreated control. Experiments were performed in triplicate and repeated three times.
Figure 7
Figure 7
Synergistic potential of CPSF6 depletion with Sorafenib in Hep3B cells. (A) Effect of CPSF6 depletion on the cytotoxicity of Sorafenib in Hep3B cells. ***p < 0.001 vs untreated control. (B) Synergy analysis between CPSF6 depletion and Sorafenib by CompuSyn and SynergyFinder softwares. Cytotoxicity data by CPSF6 depletion and/or Sorafenib were analyzed by using CompuSyn and SynergyFinder software. Synergy is determined when the value is below 1 of CI, and is considered synergistic with the score over 10 (red fraction). (C) Effect of CPSF6 depletion and Sorafenib on the expression of c-Myc, pro-PARP, pro-caspase 3 and LDH in Hep3B cells. (D) Effect of CPSF6 depletion and Sorafenib on sub G1 population in Hep3B cells. ***p < 0.001 vs untreated control.
Figure 8
Figure 8
CPSF6 depletion suppressed the growth of Hep3B cells in orthotopic and xenograft tumor models. (A) Animal study plan in a xenograft tumor model. Hep3B cells transfected with LV-shControl vector and shCPSF6 plasmid were injected into the right flank of BALB/c athymic nude mice. Six weeks after implantation, tumors and spleens were isolated from the mice for next experiments. (B) Effect of CPSF6 depletion on the volumes of Hep3B cells in a xenograft tumor model. (C)Animal study plan in an orthotopic tumor model. LV-shControl or LV-shCPSF6 Hep3B cells were injected into the left-lateral lobes of the liver of BALB/c nude mice. On Day 42 after implantation, livers including tumors from the sacrificed mice were isolated, photographed and weighed for next experiments. (D) Effect of CPSF6 depletion on the volumes of Hep3B cells in an orthotopic tumor model. ***p < 0.001 vs untreated control. (E) Effect of CPSF6 depletion on liver weights in an orthotopic tumor model. ***p < 0.001 vs untreated control. (F) Morphology of liver and tumors in LV-shControl and LV-shCPSF6 Hep3B groups. (G) Effect of CPSF6 depletion on histopathological changes by H&E staining and the expression of CPSF6, c-Myc, PCNA, caspase 3, HK2, PKM2, LDH, VEGF and PD-L1 by IHC in tumor sections compared to LV-shControl group. *p < 0.05, **p < 0.01, ***p < 0.001 vs untreated control.
Figure 9
Figure 9
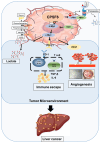
Schematic diagram on the oncogenic networks of CPSF6 via warburg effect, immune escape, and angiogenesis.

References

    1. Llovet JM, Kelley RK, Villanueva A, Singal AG, Pikarsky E, Roayaie S. et al. Hepatocellular carcinoma. Nature reviews Disease primers. 2021;7:6. - PubMed
    1. McGlynn KA, London WT. The global epidemiology of hepatocellular carcinoma: present and future. Clinics in liver disease. 2011;15:223–43. vii-x. - PMC - PubMed
    1. De Matteis S, Ragusa A, Marisi G, De Domenico S, Casadei Gardini A, Bonafe M. et al. Aberrant Metabolism in Hepatocellular Carcinoma Provides Diagnostic and Therapeutic Opportunities. Oxidative medicine and cellular longevity. 2018;2018:7512159. - PMC - PubMed
    1. Li H. Angiogenesis in the progression from liver fibrosis to cirrhosis and hepatocelluar carcinoma. Expert review of gastroenterology & hepatology. 2021;15:217–33. - PubMed
    1. Li H, Li CW, Li X, Ding Q, Guo L, Liu S. et al. MET Inhibitors Promote Liver Tumor Evasion of the Immune Response by Stabilizing PDL1. Gastroenterology. 2019;156:1849–61.e13. - PMC - PubMed