. 2024 Jul 1;20(9):3656-3674.
doi: 10.7150/ijbs.97091. eCollection 2024.

TRIM50 inhibits glycolysis and the malignant progression of gastric cancer by ubiquitinating PGK1

Affiliations

TRIM50 inhibits glycolysis and the malignant progression of gastric cancer by ubiquitinating PGK1

Chao Gu et al. Int J Biol Sci. .

Abstract

Ubiquitination plays a pivotal regulatory role in tumor progression. Among the components of the ubiquitin-proteasome system (UPS), ubiquitin-protein ligase E3 has emerged as a key molecule. Nevertheless, the biological functions of E3 ubiquitin ligases and their potential mechanisms orchestrating glycolysis in gastric cancer (GC) remain to be elucidated. In this study, we conducted a comprehensive transcriptomic analysis to identify the core E3 ubiquitin ligases in GC, followed by extensive validation of the expression patterns and clinical significance of Tripartite motif-containing 50 (TRIM50) both in vitro and in vivo. Remarkably, we found that TRIM50 was downregulated in GC tissues, associated with malignant progression and poor patient survival. Functionally, overexpression of TRIM50 suppressed GC cell proliferation and indirectly mitigated the invasion and migration of GC cells by inhibiting the M2 polarization of tumor-associated macrophages (TAMs). Mechanistically, TRIM50 inhibited the glycolytic pathway by ubiquitinating Phosphoglycerate Kinase 1 (PGK1), thereby directly suppressing GC cell proliferation. Simultaneously, the reduction in lactate led to diminished M2 polarization of TAMs, indirectly inhibiting the invasion and migration of GC cells. Notably, the downregulation of TRIM50 in GC was mediated by the METTL3/YTHDF2 axis in an m6A-dependent manner. In our study, we definitively identified TRIM50 as a tumor suppressor gene (TSG) that effectively inhibits glycolysis and the malignant progression of GC by ubiquitinating PGK1, thus offering novel insights and promising targets for the diagnosis and treatment of GC.

Keywords: Gastric cancer; glycolysis; m6A; tumor-associated macrophages; ubiquitination.


Conflict of interest statement

Competing Interests: The authors have declared that no competing interest exists.

Figures
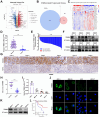
Figure 1
Figure 1
Expression patterns and clinical significance of TRIM50 in GC. (A) Volcano plot illustrated the differential expression of mRNA in 24 GC tissues compared to adjacent normal tissues (P < 0.05, Log2FC > 1 or < -1, excluding duplicate values). (B) Venn diagram depicted the intersection between differentially expressed genes and the E3 ubiquitin ligase gene family. (C) Heatmap presented the mRNA expression levels of the 24 intersected genes, with TRIM50 showing the most pronounced differential expression among them. (D) qRT‒PCR demonstrated the variation in TRIM50 mRNA expression between 124 pairs of GC tissues and adjacent non-neoplastic tissues. (E) Fold changes (log2) of TRIM50 in each paired sample, arranged in descending order. (F) Western blotting revealed the differential expression of the TRIM50 protein in GC tissues and adjacent non-neoplastic tissues. (G), (H) Immunohistochemistry and scoring displayed the differential expression of TRIM50 protein in GC tissues and adjacent non-neoplastic tissues (n = 24). Scale bar: 100 μm. (I) qRT‒PCR exhibited the expression levels of TRIM50 mRNA in gastric mucosal epithelial cell lines (GES-1) and GC cell lines (MKN-45, AGS, and HGC-27). (J) Immunofluorescence demonstrated the protein expression levels of TRIM50 in gastric mucosal epithelial cell lines (GES-1) and GC cell lines (MKN-45, AGS, and HGC-27), with cell nuclei stained using DAPI. Scale bar: 10 μm. (K) Western blotting showed the protein expression levels of TRIM50 in gastric mucosal epithelial cell lines (GES-1) and GC cell lines (MKN-45, AGS, and HGC-27). (L) Survival analysis of GC patients based on TRIM50 mRNA expression (n = 124). The median expression level of TRIM50 was used as the cut-off value to classify patients into high and low expression groups. The data are representative of three independent experiments. Quantitative data are shown as mean ± SD (D, H, I), or mean ± SEM (L), and p values were determined by two-tailed unpaired Student's t test (I, D, H), or log rank test (L) (*p < 0.05, **p < 0.01, ***p < 0.001).
Figure 2
Figure 2
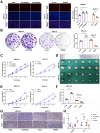
Suppression of GC cell proliferation by TRIM50. (A) EdU assay examined the impact of TRIM50 knockdown and overexpression on the proliferation of MKN-45 and HGC-27 cells. Scale bar: 100 μm. (B) Colony formation assay investigated the effect of TRIM50 on the proliferation of MKN-45 and HGC-27 cells. (C) CCK-8 assay evaluated the influence of TRIM50 on the proliferation of MKN-45 and HGC-27 cells. (D) Mouse xenograft model was used to evaluate the effect of TRIM50 on cell proliferation in vivo; images of subcutaneous xenograft tumors from mouse models were displayed (n = 6). (E) Time-volume curve of subcutaneous xenograft tumors. (F) Weight of subcutaneous xenograft tumors. (G) Immunohistochemical staining of TRIM50 and Ki-67 in subcutaneous xenograft tumors. (H) Immunohistochemical staining score of TRIM50 and Ki-67 in subcutaneous xenograft tumors. The data are representative of three independent experiments. Quantitative data are shown as mean ± SD (A, B, F, H), or mean ± SEM (C, E). p values were determined by two-way ANOVA test (C, E), or two-tailed unpaired Student's t test (A, B, F, H) (*p < 0.05, **p < 0.01, ***p < 0.001).
Figure 3
Figure 3
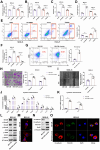
TRIM50 inhibits the invasion and migration of GC cells by suppressing M2 polarization of tumor-associated macrophages. (A), (B) Immunohistochemical staining and their scoring showed the expression of TRIM50 in primary tumors of GC patients with and without metastasis. Scale bar: 100 μm. (C) Immunofluorescence staining of TRIM50, CD68 (human macrophage marker), and CD163 (M2 marker) in GC tissues with and without distant metastasis, with cell nuclei stained using DAPI. Scale bar: 100 μm. (D) Relative fluorescence intensity ratio of CD163/TRIM50 in the tissues. (E) Coculture of HGC-27 cells transfected with TRIM50 overexpression vectors or MKN-45 cells transfected with TRIM50 knockdown vectors with M0 macrophages, followed by flow cytometry analysis of CD68 (human macrophage marker) and CD163 (M2 marker) expression on macrophages. (F), (G) Collection of macrophage supernatant from each well and addition to the culture medium of human GC cells (HGC-27, MKN-45). Transwell (F) and wound healing assays (G) examined changes in the migration and invasion ability of GC cells. Scale bar: 100 μm (F), 200 μm (G). (H) Mouse lung metastasis model was used to evaluate the indirect effect of TRIM50 on cell metastasis in vivo. IVIS was used to detect the values of bioluminescence imaging signals in lung metastases. Relative bioluminescence was expressed as mean ± standard deviation (n = 3). (I) Lung metastasis and H&E staining. (J) Mouse liver metastasis model was used to evaluate the indirect effect of TRIM50 on cell metastasis in vivo. IVIS was used to detect the values of bioluminescence imaging signals in liver metastases. Relative bioluminescence was expressed as mean ± standard deviation (n = 3). (K) Liver metastasis and HE staining. The data are representative of three independent experiments. Quantitative data are shown as mean ± SD (B, D, F, G, H, I, J, K). p values were determined by two-tailed unpaired Student's t test (*p < 0.05, **p < 0.01, ***p < 0.001).
Figure 4
Figure 4
TRIM50 suppresses glycolysis to directly inhibit GC cell proliferation and indirectly inhibit their invasion and migration. (A), (B) Gene Set Enrichment Analysis (GSEA) based on our mRNA array results. Specifically, TRIM50 expression in the mRNA array served as the phenotype label, and all mRNA data were considered as gene sets. (C), (D) Assessment of TRIM50's impact on oxygen consumption rate using the Seahorse Energy Flux system by measuring OCR, OM (oligomycin), FCCP (Carbonyl cyanide 4-(trifluoromethoxy)phenylhydrazone), and R&A (Rotenone & Antimycin A). (E), (F) Assessment of TRIM50's impact on glycolysis rate using the Seahorse Energy Flux system by measuring ECAR, OM (oligomycin), and 2-DG (2-deoxyglucose). (G) CCK-8 assay evaluated the effect of TRIM50 knockdown and Galloflavin (a glycolysis inhibitor at 50 μM) on the proliferation of MKN-45 cells. (H) EdU assay assessed the effect of TRIM50 knockdown and Galloflavin on the proliferation of MKN-45 cells. Scale bar: 50 μm. (I) Colony formation assay examined the effect of TRIM50 knockdown and Galloflavin on the proliferation of GC cells (MKN-45). (J) Coculture of intervened MKN-45 cells with M0 macrophages, followed by flow cytometry analysis of CD68 (human macrophage marker) and CD163 (M2 marker) expression on macrophages. (K), (L) Addition of intervened macrophage supernatant to the culture medium of GC cells (MKN-45), followed by Transwell (K) and wound healing assay (L) to assess the invasion and migration ability of GC cells (MKN-45). Scale bars: 100 μm (K), 200 μm (L). The data are representative of three independent experiments. p values were determined by two-way ANOVA test (G), or two-tailed unpaired Student's t test (C, D, E, F, H, I, J, K, L) (*p < 0.05, **p < 0.01, ***p < 0.001).
Figure 5
Figure 5
The mechanism by which TRIM50 directly inhibits GC cell proliferation and indirectly inhibits invasion and migration through the glycolytic pathway. (A) Impact of TRIM50 knockdown and overexpression on glucose uptake in MKN-45 and HGC-27 cells. (B) Effect of TRIM50 modulation on ATP production in MKN-45 and HGC-27 cells. (C) The influence of TRIM50 on NADH/NAD+ ratios in MKN-45 and HGC-27 cells. (D) Effect of TRIM50 on ROS accumulation in MKN-45 and HGC-27 cells. (E) The role of TRIM50 in regulating apoptosis in MKN-45 and HGC-27 cells. (F) Lactate production in response to TRIM50 modulation in MKN-45 and HGC-27 cells. (G) M2 macrophage polarization in THP-1 cells induced with PMA and treated with lactate, analyzed by flow cytometry. (H), (I) The migration and invasive capabilities of MKN-45 cells treated with lactate-conditioned macrophage supernatant, assessed by Transwell (H) and wound healing (I) assays. Scale bars: 100 μm (H), 200 μm (I). (J) ELISA assay measured the concentration of tumor invasion and migration-related cytokines (TGF-β, MCP-1, IP-10, IL-6, VEGF, G-CSF, IL-15, IL-1β, IL-10, and IL-12) in lactate-trained macrophage conditioned medium, with TGF-β and IL-6 showing marked changes. (K) qRT‒PCR analysis of TGF-β and IL-6 mRNA in lactate-conditioned macrophage media. (L) Western blotting analysis of TGF-β and JAK-STAT pathway protein phosphorylation in MKN-45 cells treated with lactate-conditioned supernatant. (M) Morphological changes of GC cells cultured with lactate-trained macrophage supernatant observed by immunofluorescence staining of the cytoskeleton using phalloidin, with DAPI staining for cell nuclei. Scale bar: 20 μm. (N), (O) Analysis of EMT marker protein expression in MKN-45 cells with lactate-conditioned macrophage supernatant by Western blotting (N) and immunofluorescence staining (O), with DAPI staining for cell nuclei. Scale bar: 20 μm. The data are representative of three independent experiments. p values were determined by two-tailed unpaired Student's t test (*p < 0.05, **p < 0.01, ***p < 0.001).
Figure 6
Figure 6
Interaction between TRIM50 and PGK1 and regulation of PGK1 expression. (A) Coimmunoprecipitation (Co-IP) of TRIM50-FLAG plasmid transfected into GC cells. Silver staining analysis of the pulled-down proteins. The image showed the silver-stained gel, with the target protein location marked by red boxes. (B) Secondary structure of PGK1 pulled down by TRIM50 in mass spectrometry. (C) Confirmation of the interaction between TRIM50 and PGK1 through reciprocal Co-IP and Western blotting. (D) Schematic representation of the TRIM50 structure domains and its structural domain-deleted mutants (Flag-ΔRING, Flag-ΔB-box, Flag-ΔCoiled-coil 1, Flag-ΔCoiled-coil 2, Flag-ΔSPRY) plasmid constructs. (E) HEK293T cells were transfected with HA-PGK1 plasmid together with wild-type Flag-TRIM50 plasmid or its structural domain-deleted mutants. The interaction between HA-PGK1 and wild-type Flag-TRIM50 or its mutants was detected by immunoprecipitation. (F) Protein semi-quantitative analysis of 24 tumor tissues revealed the correlation between PGK1 protein expression and TRIM50 protein expression, calculated by Spearman correlation analysis with statistical significance determined using a two-tailed unpaired Student's t-test (*p < 0.05, **p < 0.01, ***p < 0.001). (G) Western blotting confirmed that TRIM50 knockdown increased the protein level of PGK1 in MKN-45 cells, while TRIM50 overexpression decreased the protein level of PGK1 in HGC-27 cells. (H) Immunofluorescence observation of the effect of TRIM50 knockdown and overexpression on the protein level of PGK1 in GC cells, with cell nuclei stained with DAPI. Scale bar: 10 μm.
Figure 7
Figure 7
Rescue of glycolysis and cellular malignancy in TRIM50-overexpressing GC cells by PGK1 restoration. (A) Western blotting analysis of PGK1 expression in HGC-27-TRIM50 cells. (B) ECAR assay showed that PGK1 restoration reversed the inhibitory effect of TRIM50 on glycolytic capacity in HGC-27 cells overexpressing TRIM50. (C) OCR assay showed that PGK1 restoration reversed the promoting effect of TRIM50 on mitochondrial oxidative phosphorylation capacity in HGC-27 cells overexpressing TRIM50. (D)-(H) Restoration of PGK1 expression reversed the inhibitory effects of TRIM50 overexpression on glucose uptake (D), ATP levels (E), lactate production (F), NADH/NAD+ conversion (G), and ROS levels (H) in HGC-27 cells overexpressing TRIM50. (I) CCK-8 assay, (J) EdU assay and (K) colony formation assay demonstrated that restoration of PGK1 expression reverses the inhibitory effect of TRIM50 on the proliferation capacity of HGC-27 cells. Scale bar: 100 μm (J). (L) Flow cytometry analysis showed that restoration of PGK1 expression reverses the M2 polarization of macrophages cocultured with HGC-27 cells overexpressing TRIM50. (M), (N) Transwell (M) and wound healing assay (N) demonstrated that restoration of PGK1 expression reverses the indirect inhibitory effect of TRIM50 on the invasion and migration capacity of GC cells cultured with macrophage-conditioned medium. Scale bar: 100 μm (M), 200 μm (N). (O) The mouse model of subcutaneous xenograft tumor was used to evaluate the effect of restoring PGK1 expression on reversing the direct inhibition of tumor growth caused by TRIM50 overexpression (n = 6). (P) Time-volume curve of subcutaneous xenograft tumors. (Q) Weight of subcutaneous xenograft tumors. (R) Immunohistochemical staining of TRIM50, PGK1, and Ki-67 in subcutaneous xenograft tumors was performed, with (S) showing the quantified staining scores. (T), (U) Mouse models of lung (T) and liver metastasis (U) were used to evaluate how PGK1 restoration reversed the indirect inhibitory effects of TRIM50 on metastasis, with H&E staining for evaluation (n=3 for each).The data are representative of three independent experiments. p values were determined by two-way ANOVA test (I, P), or two-tailed unpaired Student's t test (B, C, D, E, F, G, H, J, K, L, M, N, Q, S, T, U) (*p < 0.05, **p < 0.01, ***p < 0.001)
Figure 8
Figure 8
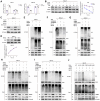
TRIM50 induces the degradation of PGK1 through ubiquitination modification. (A) qRT‒PCR analysis demonstrated that PGK1 mRNA levels remained unchanged following TRIM50 overexpression or knockdown, suggesting post-transcriptional regulation. (B) In HGC-27 cells, the degradation rate of PGK1 protein was significantly accelerated when TRIM50 was overexpressed, as shown by Western blotting analysis after treatment with cycloheximide (CHX) at various time points. (C) The proteasome inhibitor MG132, but not the lysosome inhibitor chloroquine, reduced the degradation rate of PGK1 in TRIM50-overexpressing cells, indicating proteasome-mediated degradation. (D) The addition of MG132 led to a time-dependent increase in PGK1 protein levels, further supporting proteasomal degradation. (E) Immunoprecipitation (IP) analysis using HA-Ub plasmid in HGC-27 cells with TRIM50 overexpression showed increased ubiquitination of PGK1. (F) Immunoprecipitation analysis using HA-Ub plasmid in MKN-45 cells with TRIM50 knockdown demonstrated a decrease in PGK1 ubiquitination, indicating that TRIM50 is required for PGK1 ubiquitination. (G) Co-immunoprecipitation of TRIM50 with HA-Ub in HGC-27 cells, using a TRIM50 RING domain deletion mutant, confirmed the necessity of the RING domain for the interaction and the role of TRIM50 in PGK1 ubiquitination. (H) Co-transfection of TRIM50 with HA-UB-K48 or HA-UB-K63 in HGC-27 cells, followed by immunoprecipitation analysis, further validated the ubiquitination process. (I) Co-transfection with TRIM50 and mutant HA-UB plasmids (K48R or K63R) in HGC-27 cells confirmed the specificity of the ubiquitination process. (J) Co-transfection with TRIM50 and PGK1 ubiquitination site mutants in HGC-27 cells, followed by immunoprecipitation, identified the critical lysine residues involved in PGK1 ubiquitination. The data are representative of three independent experiments. Quantitative data are shown as mean ± SEM (B, D), or mean ± SD (A). p values were determined by two-way ANOVA test (B), or two-tailed unpaired Student's t test (A) (*p < 0.05, **p < 0.01, ***p < 0.001)
Figure 9
Figure 9
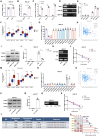
m6A methylation modulates TRIM50 expression in GC cells. (A) The qRT‒PCR analysis did not detect any statistically significant changes in the expression of the TRIM50 mRNA following treatment with 5-azacytidine (5-AzaC), an inhibitor of DNA methylation, in the HGC-27 GC cells. (B) qRT‒PCR analysis revealed a distinct alteration in the expression of TRIM50 mRNA upon treatment with cycloleucine (CLeu), an inhibitor of the m6A methylation, in HGC-27 GC cells. (C) m6A sequencing distinguished m6A patterns between GC and normal tissues. (D) Agarose gel electrophoresis analysis confirmed the RNA integrity. (E) MeRIP-qRT‒PCR detected variable m6A modification in the TRIM50 3'-UTR among GES-1 and GC cell lines (HGC-27, MKN-45). (F) TCGA data analyzed expression levels of m6A writers (methyltransferases) and erasers (demethylases) in GC tissues and adjacent tissues. (G) METTL3 knockdown significantly reduced m6A levels in the TRIM50 3'-UTR. (H) Spearman correlation identified a link between METTL3 and TRIM50 expression in TCGA's GC data. (I)-(K) Western blotting (I), MeRIP (J) and Agarose gel electrophoresis analysis (K) confirmed the impact of METTL3 on TRIM50 protein and mRNA levels. (L) Actinomycin D assay assessed mRNA stability post-METTL3 knockdown. (M) TCGA data revealed expression levels of m6A reader proteins in GC tissues and adjacent tissues. (N) Knockdown of these readers influenced TRIM50 mRNA expression. (O) Spearman correlation identified a link between YTHDF2 and TRIM50 expression in TCGA's GC data. (P)-(R) Western blotting (P), MeRIP (Q) and Agarose gel electrophoresis analysis (R) confirmed the impact of YTHDF2 on TRIM50 protein and mRNA levels. (S) Actinomycin D assay assessed mRNA stability post-YTHDF2 knockdown. (T) Prediction of potential m6A modification sites on TRIM50 mRNA was performed using m6A-Atlas databases, and the intersection of these predictions was determined. (U) Luciferase reporter gene assays confirmed the functional significance of the primary m6A site. The data are representative of three independent experiments. Quantitative data are shown as mean ± SEM (L, S), or mean ± SD (A, B, C, E, F, G, J, M, N, Q, U). p values were determined by two-way ANOVA test (L, S), two-tailed unpaired Student's t test (A, B, C, E, F, G, H, J, M, N, O, Q, U) (*p < 0.05, **p < 0.01, ***p < 0.001)
Figure 10
Figure 10
Mechanistic overview of TRIM50's regulation of the glycolytic pathway and its role in inhibiting the malignant phenotype of GC cells through PGK1 ubiquitination. TRIM50 mediates the degradation of lactate dehydrogenase PGK1, thereby suppressing the glycolytic pathway in GC and directly inhibiting GC cell proliferation. Simultaneously, the reduction of lactate, a glycolytic product, leads to decreased infiltration of TAMs and a decrease in M2 polarization in the tumor microenvironment. This, in turn, results in reduced secretion of EMT-related cytokines, such as TGF-β and IL-6, indirectly inhibiting the invasive and migratory abilities of GC cells. The low expression of TRIM50 in GC cells is mainly mediated by mRNA m6A methylation.

References

    1. Siegel RL, Miller KD, Wagle NS. et al. Cancer statistics, 2023. CA Cancer J Clin. 2023;73(1):17–48. - PubMed
    1. Ajani JA, D'Amico TA, Bentrem DJ. et al. Gastric Cancer, Version 2.2022, NCCN Clinical Practice Guidelines in Oncology. J Natl Compr Canc Netw. 2022;20(2):167–192. - PubMed
    1. Popovic D, Vucic D, Dikic I. Ubiquitination in disease pathogenesis and treatment. Nat Med. 2014;20(11):1242–1253. - PubMed
    1. Han S, Wang R, Zhang Y. et al. The role of ubiquitination and deubiquitination in tumor invasion and metastasis. Int J Biol Sci. 2022;18(6):2292–2303. - PMC - PubMed
    1. Zheng N, Shabek N. Ubiquitin Ligases: Structure, Function, and Regulation. Annu Rev Biochem. 2017;86:129–157. - PubMed

MeSH terms