. 2024 Jun 17;20(9):3461-3479.
doi: 10.7150/ijbs.94863. eCollection 2024.

Fgf9 regulates bone marrow mesenchymal stem cell fate and bone-fat balance in osteoporosis by PI3K/AKT/Hippo and MEK/ERK signaling

Affiliations

Fgf9 regulates bone marrow mesenchymal stem cell fate and bone-fat balance in osteoporosis by PI3K/AKT/Hippo and MEK/ERK signaling

Mingmei Chen et al. Int J Biol Sci. .

Abstract

Bone-fat balance is crucial to maintain bone homeostasis. As common progenitor cells of osteoblasts and adipocytes, bone marrow mesenchymal stem cells (BMSCs) are delicately balanced for their differentiation commitment. However, the exact mechanisms governing BMSC cell fate are unclear. In this study, we discovered that fibroblast growth factor 9 (Fgf9), a cytokine expressed in the bone marrow niche, controlled bone-fat balance by influencing the cell fate of BMSCs. Histomorphology and cytodifferentiation analysis showed that Fgf9 loss-of-function mutation (S99N) notably inhibited bone marrow adipose tissue (BMAT) formation and alleviated ovariectomy-induced bone loss and BMAT accumulation in adult mice. Furthermore, in vitro and in vivo investigations demonstrated that Fgf9 altered the differentiation potential of BMSCs, shifting from osteogenesis to adipogenesis at the early stages of cell commitment. Transcriptomic and gene expression analyses demonstrated that FGF9 upregulated the expression of adipogenic genes while downregulating osteogenic gene expression at both mRNA and protein levels. Mechanistic studies revealed that FGF9, through FGFR1, promoted adipogenic gene expression via PI3K/AKT/Hippo pathways and inhibited osteogenic gene expression via MAPK/ERK pathway. This study underscores the crucial role of Fgf9 as a cytokine regulating the bone-fat balance in adult bone, suggesting that FGF9 is a potentially therapeutic target in the treatment of osteoporosis.

Keywords: Adipogenesis; Bone marrow adipose tissue; Bone-fate balance; Mesenchymal stem cells; Osteogenesis.


Conflict of interest statement

Competing Interests: The authors have declared that no competing interest exists.

Figures

Figure 1
Figure 1
Fgf9 is expressed in the bone marrow niche and upregulated with aging and OVX. (A) UMAP visualization of seventeen bone marrow stroma cell clusters. (B) Distribution of Fgf9 in bone marrow stroma cell clusters. (C) Expression of Fgf9 and Fgfrs in seventeen clusters of bone marrow stroma cells. The size of dots represents the percentage of expression; red and blue represent the level of scaled mean expression. (D) Relative mRNA levels of Fgf9 in tibiae of young (4-month-old) and aged (22-month-old) mice, n = 4 in each group. (E, F) Protein levels of FGF9 in femurs of young (4-month-old) and aged (22-month-old) mice were detected by immunoblotting (E) and were quantitatively analyzed (F), n = 4 in each group. Recombinant FGF9 protein (rFGF9) as the positive control. (G) Relative mRNA levels of Fgf9 in tibiae of Sham-wt and OVX-wt mice (4-month-old), n = 5 in each group. (H) Relative mRNA levels of Fgf9 in fibroblast-like cells of young (2-month-old), middle (10-month-old), and aged (20-month-old) mice, n = 3 in each group. Data are analyzed by Student's t-test and shown as boxplots (median ± interquartile range).
Figure 2
Figure 2
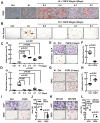
Fgf9S99N mutation mitigates bone-fat imbalance in OVX-induced osteoporosis. (A) H&E staining of longitudinal section of femurs from 4-month-old male wild-type (wt) and heterozygous (het) mice. (B) Statistical analysis of femur adipocyte number in 4-month-old wt and het mice. (C) 8-week-old female wt and het mice underwent sham surgery and ovariectomy, and their femurs were assessed using micro-CT scanning after 8 weeks. The representative figures illustrate the 3D reconstructed structures, the sagittal section of the femur (scale bars = 2 mm) and the trabecular bone of the metaphyseal region (scale bars = 1 mm). (D-G) Bone mineral density (BMD), Bone surface density (BS/TV), Trabecular number (Tb.N), and Trabecular separation (Tb.Sp) of trabecular bone of Sham-wt, OVX-wt, and OVX-het mice were determined by micro-CT analysis. (H) Representative images of H&E staining in left femurs of Sham-wt, OVX-wt, and OVX-het mice. (I) Immunofluorescence staining of Osteopontin and Perilipin A in femurs of Sham-wt, OVX-wt, and OVX-het mice. (J) Statistical analysis of adipocyte number in femurs of Sham-wt, OVX-wt, and OVX-het mice. (K) Quantification analysis of serum PINP level in Sham-wt, OVX-wt, and OVX-het mice by ELISA. Data are analyzed by Student's t-test and shown as boxplots (median ± interquartile range), n = 4 mice in each group. In (A), (H), and (I), the dashed box indicates the area of local magnification (below), and the scale bars represent 200 μm.
Figure 3
Figure 3
Fgf9 inhibits osteoblastic differentiation and promotes adipogenic differentiation of BMSCs in vitro. (A-B) Oil Red O (ORO) staining (A) and quantification analysis (B) showed the differentiated adipocytes in BMSCs from 20-month-old wt and het mice with adipogenic induction (AI) medium for 6 days. n = 8 mice in each group. (C-D) Von Kossa staining (C) and quantification analysis (D) showed the mineralized ECM generated by BMSCs from 20-month-old wt and het mice in osteogenic induced (OI) medium for 9 days. n = 8 mice in each group. (E) ALP, Von Kossa, and ORO staining of BMSCs under OI conditions with different concentrations of FGF9 stimulation (0, 5, 10, 20, and 50 ng/ml) for 9 days. (F) Quantification measurement of ALP-positive area percentage from (E), n = 4 independent experiments with biological replicates. (G) ORO staining of BMSCs under AI conditions with different concentrations of FGF9 stimulation (0, 5, 10, 20, and 50 ng/ml) for 6 days. (H) Quantification measurement of adipocyte area percentage from (G), n = 4 independent experiments with biological replicates. (I-L) BMSCs were cultured with different concentrations of FGF9 (0, 5, 10, and 20 ng/ml), and mRNA expression was detected by qRT-PCR. Relative mRNA levels of Col1a1 (I) and Adipoq (J) in OI condition, and relative mRNA levels of Cebpa (K) and Adipoq (L) in AI condition, n = 3 biological replicates over three independent experiments. Data are analyzed by Student's t-test and shown as boxplots (median ± interquartile range). The BMSCs in (E-L) derived from 1-month-old wild-type mice. Scale bars represent 200 μm.
Figure 4
Figure 4
Fgf9 controls osteogenic/adipogenic differentiation of BMSCs in vivo. (A) Fgf9 stable overexpressed (OE-Fgf9) and control (OE-Ctrl) BMSCs were differentiated with OI medium for 9 days. Von Kossa, ALP, ORO staining were performed. (B-D) Quantitative analysis of mineralization (B), ALP activity (C) and adipocytes area (D) from A. n ≥ 3 independent experiments with biological replicates. (E-F) ORO staining (E) and quantitative analysis (F) showed that Fgf9 overexpression promoted BMSCs adipogenic differentiation under AI conditions for 6 days. n = 3 independent experiments with biological replicates. (G) A schematic diagram of subcutaneous injection of 5×10⁵ OE-Ctrl and 5×10⁵ OE-Fgf9 BMSCs into nude mice. (H) H&E staining images of OE-Ctrl and OE-Fgf9 BMSCs implants after 5 weeks of injection. (I) Immunofluorescence staining of Osteopontin (OPN) and Perilipin A (PLIN1) in OE-Ctrl and OE-Fgf9 BMSCs implants. (J-K) Statistical analysis of adipose tissue and ossified tissue percentages, n = 3 mice. Data are analyzed by Student's t-test and shown as boxplots (median ± interquartile range). Scale bars represent 200 μm.
Figure 5
Figure 5
FGF9 alters the osteogenic and adipogenic cell fate of BMSCs in the early stage of differentiation. (A) BMSCs were cultured in an AI medium with 20 ng/ml recombinant FGF9 for the indicated periods. On day 7, ORO staining showed the adipocytes. (B) BMSCs were cultured in an OI medium with 20 ng/ml recombinant FGF9 for the indicated periods. On day 7, Von Kossa staining showed the mineralized ECM. Ctrl groups were maintained in the culture medium (CM). (C-D) Quantification measurement of adipocyte area percentage from (A) and mineralization area percentage from (B). (E-H) BMSCs were prior stimulated with FGF9 in the culture medium for 2 days, then differentiated with OI (E) and AI (G) medium. ALP, Von Kossa staining (E), and quantification analysis (F) indicated the osteogenic differentiation potential. ORO staining (G) and quantification analysis (H) indicated the adipogenic differentiation potential. (I-J) BMSCs were cultured in a culture medium for 9 days with or without 20 ng/ml FGF9. ALP and ORO staining (I) were performed and quantitatively analyzed (J). (K-L) OE-Fgf9 and OE-Ctrl BMSCs were cultured in a culture medium for 9 days. ALP, ORO staining (K), and quantification analysis (L) were used to detect the spontaneous differentiation. n ≥ 3 independent experiments with biological replicates. Data are analyzed by Student's t-test and shown as boxplots (median ± interquartile range). Scale bars represent 200 μm.
Figure 6
Figure 6
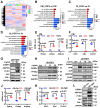
FGF9 regulates BMSCs cell fate via changing the expression of osteoblastic and adipogenic genes. (A) The heatmap of differentially expressed genes (DEGs) from 3 independent RNA-seq analyses in BMSCs with CM, OI, and AI conditions with/without 20 ng/ml FGF9 stimulation for 4 days. (B-D) Gene Ontology (GO) classification of DEGs from CM (B), OI (C), and AI (D) conditions. The adipogenesis and osteogenesis related terms were presented. (E-F) Relative mRNA level of adipogenic genes (Pparg, Cebpa, Adipoq) and osteogenic genes (Dlx5, Alpl, Col1a1) in BMSCs with FGF9 stimulation for 4 days in CM. (G-I) Protein levels of adipogenic genes (C/EBPα, PPARγ, ADIPOQ, PLIN1) and osteogenic genes (ALP, COL1, RUNX2, OPN) were detected by immunoblotting in BMSCs under CM (G), AI (H) and OI (I) conditions with/without FGF9 stimulation. (J-K) Relative mRNA level of Pparg, Cebpa, Adipoq (J), and Dlx5, Alpl, and Col1a1 (K) in OE-Ctrl and OE-Fgf9 BMSCs. (L) Protein levels of C/EBPα, ADIPOQ, PLIN1, ALP, and COL1 in OE-Ctrl and OE-Fgf9 BMSCs were detected by immunoblotting. n = 3 biological replicates over three independent experiments. DEGs are defined as |Log2FC|≥1 and adjusted P-value≤0.05, corrected P-value of GO terms < 0.05. Data are analyzed by Student's t-test and shown as boxplots (median ± interquartile range).
Figure 7
Figure 7
FGF9 stimulation activates multiple signaling pathways in BMSCs. (A-C) Kyoto Encyclopedia of Genes and Genomes (KEGG) enrichment of DEGs from CM (A), AI (B), and OI (C) groups. Bar diagrams showed the top 10 significant pathways for Environmental Information Processing. (D-E) Venn diagram revealed 250 co-up-regulated genes (D) and 340 co-down-regulated genes (E) in three compared groups of BMSCs. (F) KEGG enrichment of 590 co-regulated DEGs from D and E, and listed the top 10 significant pathways for Environmental Information Processing. DEGs are defined as |Log2FC|≥1 and adjusted P-value≤0.05, corrected P-value of pathways < 0.05.
Figure 8
Figure 8
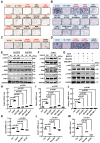
FGF9 regulates BMSCs osteogenic/adipogenic fate through MEK/ERK, PI3K/AKT, and Hippo signaling pathways. (A) ORO staining showed the effect of the indicated inhibitors on adipose differentiation of BMSCs with 20 ng/ml FGF9 stimulation in an AI medium. BMSCs were cultured for 6 days, the red-labeled inhibitors showed a significant effect. (B) ALP staining showed the effect of the indicated inhibitors on osteogenic differentiation of BMSCs with 20 ng/ml FGF9 stimulation in the OI medium. BMSCs were cultured for 6 days, the red-labeled inhibitors showed a significant effect. (C-D) ORO staining (C) and ALP staining (D) showed the effect of FGFR1 and FGFR2 inhibitors on the differentiation of BMSCs with 20 ng/ml FGF9 stimulation. BMSCs were cultured for 6 days, the red-labeled inhibitors showed a significant effect. (E) Immunoblotting analysis showed the phosphorylated and total protein levels of ERK, AKT, and YAP1 in BMSCs with FGF9 stimulation (0, 10, and 20 ng/ml) under AI or OI conditions for 6 days. (F) Immunoblotting analysis showed the phosphorylated and total protein levels of ERK, AKT, and YAP1 in the BMSCs stimulated with FGF9 (0, 10, and 20 ng/ml). BMSCs were cultured for 4 days under CM conditions. (G) Immunoblotting results showed the phosphorylated and total protein levels of AKT and YAP1 in BMSCs, which were pre-treated with inhibitors (BEZ235, MK-2206, and XMU-MP-1) for 10 hours and stimulated with 20 ng/ml FGF9 for 10min. (H-J) Relative mRNA levels of Cebpa, Pparg, and Adipoq in BMSCs stimulated with 20 ng/ml FGF9 and inhibitors (BGJ398, BEZ235, MK-2206, and XMU-MP-1) under CM conditions for 4 days. (K-M) Relative mRNA levels of Dlx5, Alpl, and Col1a1 in BMSCs stimulated with 20ng/ml FGF9 and inhibitors (BGJ398 and U0126) under CM conditions for 4 days. n = 3 biological replicates over three independent experiments. Data are analyzed by Student's t-test and shown as boxplots (median ± interquartile range). Scale bars represent 200 μm.

Similar articles

Cited by

References

    1. Sims NA, Martin TJ. Chapter 4 - The osteoblast lineage: Its actions and communication mechanisms. In: Bilezikian JP, Martin TJ, Clemens TL, Rosen CJ, editors. Principles of Bone Biology (Fourth Edition): Academic Press. 2020. p. 89-110.
    1. Chen Q, Shou P, Zheng C, Jiang M, Cao G, Yang Q. et al. Fate decision of mesenchymal stem cells: adipocytes or osteoblasts? Cell Death Differ. 2016;23:1128–39. - PMC - PubMed
    1. Fan Y, Hanai JI, Le PT, Bi R, Maridas D, DeMambro V. et al. Parathyroid Hormone Directs Bone Marrow Mesenchymal Cell Fate. Cell metabolism. 2017;25:661–72. - PMC - PubMed
    1. Wolock SL, Krishnan I, Tenen DE, Matkins V, Camacho V, Patel S. et al. Mapping Distinct Bone Marrow Niche Populations and Their Differentiation Paths. Cell Reports. 2019;28:302–11.e5. - PMC - PubMed
    1. Zou W, Rohatgi N, Brestoff JR, Li Y, Barve RA, Tycksen E. et al. Ablation of Fat Cells in Adult Mice Induces Massive Bone Gain. Cell metabolism. 2020;32:801–13. e6. - PMC - PubMed

Substances