

Value of intralesional and perilesional radiomics for predicting the bioactivity of hepatic alveolar echinococcosis
- PMID: 38993649
- PMCID: PMC11236607
- DOI: 10.3389/fonc.2024.1389177
Value of intralesional and perilesional radiomics for predicting the bioactivity of hepatic alveolar echinococcosis
Abstract
Objectives: To investigate the value of intralesional and perilesional radiomics based on computed tomography (CT) in predicting the bioactivity of hepatic alveolar echinococcosis (HAE).
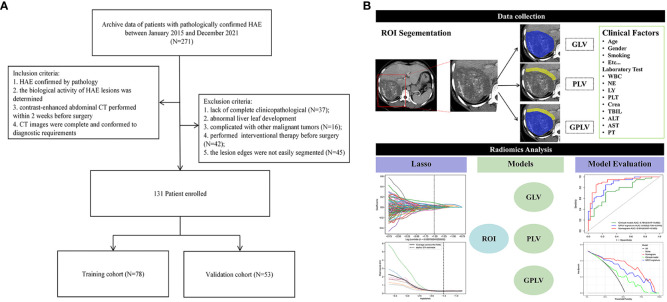
Materials and methods: In this retrospective study, 131 patients who underwent surgical resection and diagnosed HAE in pathology were included (bioactive, n=69; bioinactive, n=62). All patients were randomly assigned to the training cohort (n=78) and validation cohort (n=53) in a 6:4 ratio. The gross lesion volume (GLV), perilesional volume (PLV), and gross combined perilesional volume (GPLV) radiomics features were extracted on CT images of portal vein phase. Feature selection was performed by intra-class correlation coefficient (ICC), univariate analysis, and least absolute shrinkage and selection operator (LASSO). Radiomics models were established by support vector machine (SVM). The Radscore of the best radiomics model and clinical independent predictors were combined to establish a clinical radiomics nomogram. Receiver operating characteristic curve (ROC) and decision curves were used to evaluate the predictive performance of the nomogram model.
Results: In the training cohort, the area under the ROC curve (AUC) of the GLV, PLV, and GPLV radiomic models was 0.774, 0.729, and 0.868, respectively. GPLV radiomic models performed best among the three models in training and validation cohort. Calcification type and fibrinogen were clinical independent predictors (p<0.05). The AUC of the nomogram-model-based clinical and GPLV radiomic signatures was 0.914 in the training cohort and 0.833 in the validation cohort. The decision curve analysis showed that the nomogram had greater benefits compared with the single radiomics model or clinical model.
Conclusion: The nomogram model based on clinical and GPLV radiomic signatures shows the best performance in prediction of the bioactivity of HAE. Radiomics including perilesional tissue can significantly improve the prediction efficacy of HAE bioactivity.
Keywords: computed tomography; hepatic alveolar echinococcosis; nomogram; perilesional; radiomics.
Copyright © 2024 Zhang, Hou, Xia, Zhao, Xu, Li, Xu, Zhang and Liu.
Conflict of interest statement
Authors ZZ and MX are employed by the company Canon Medical Systems China. The remaining authors declare that the research was conducted in the absence of any commercial or financial relationships that could be construed as a potential conflict of interest.
Figures


Similar articles
-
CT-based radiomics models using intralesional and different perilesional signatures in predicting the microvascular density of hepatic alveolar echinococcosis.BMC Med Imaging. 2025 Mar 10;25(1):84. doi: 10.1186/s12880-025-01612-5. BMC Med Imaging. 2025. PMID: 40065220 Free PMC article.
-
MRI-based multiregional radiomics for predicting lymph nodes status and prognosis in patients with resectable rectal cancer.Front Oncol. 2023 Jan 4;12:1087882. doi: 10.3389/fonc.2022.1087882. eCollection 2022. Front Oncol. 2023. PMID: 36686763 Free PMC article.
-
Clinical-radiomics nomogram for predicting esophagogastric variceal bleeding risk noninvasively in patients with cirrhosis.World J Gastroenterol. 2023 Feb 14;29(6):1076-1089. doi: 10.3748/wjg.v29.i6.1076. World J Gastroenterol. 2023. PMID: 36844133 Free PMC article.
-
Development and validation of a radiomic nomogram based on pretherapy dual-energy CT for distinguishing adenocarcinoma from squamous cell carcinoma of the lung.Front Oncol. 2022 Nov 23;12:949111. doi: 10.3389/fonc.2022.949111. eCollection 2022. Front Oncol. 2022. PMID: 36505773 Free PMC article.
-
A CT-based radiomics model for predicting lymph node metastasis in hepatic alveolar echinococcosis patients to support lymph node dissection.Eur J Med Res. 2024 Aug 7;29(1):409. doi: 10.1186/s40001-024-01999-x. Eur J Med Res. 2024. PMID: 39113113 Free PMC article.
Cited by
-
CT-based radiomics models using intralesional and different perilesional signatures in predicting the microvascular density of hepatic alveolar echinococcosis.BMC Med Imaging. 2025 Mar 10;25(1):84. doi: 10.1186/s12880-025-01612-5. BMC Med Imaging. 2025. PMID: 40065220 Free PMC article.
-
The value of nomogram analysis in predicting pulmonary metastasis in hepatic alveolar echinococcosis.Sci Rep. 2025 May 14;15(1):16685. doi: 10.1038/s41598-025-97134-9. Sci Rep. 2025. PMID: 40369021 Free PMC article.
-
Hepatic cystic echinococcosis (type II): A case report.J Int Med Res. 2025 Mar;53(3):3000605251325164. doi: 10.1177/03000605251325164. Epub 2025 Mar 13. J Int Med Res. 2025. PMID: 40079438 Free PMC article.
References
-
- Wen H. Advancement of diagnosis and surgical treatment for hepatic echinococcosis. Chin J Dig Surg. (2011) 10:290–2. doi: 10.3760/cma.j.issn.1673-9752.2011.04.014 - DOI
LinkOut - more resources
Full Text Sources