. 2024 Jun 8;27(7):110217.
doi: 10.1016/j.isci.2024.110217. eCollection 2024 Jul 19.

A neutral invertase controls cell division besides hydrolysis of sucrose for nutrition during germination and seed setting in rice

Affiliations

A neutral invertase controls cell division besides hydrolysis of sucrose for nutrition during germination and seed setting in rice

Zizhang Wang et al. iScience. .

Abstract

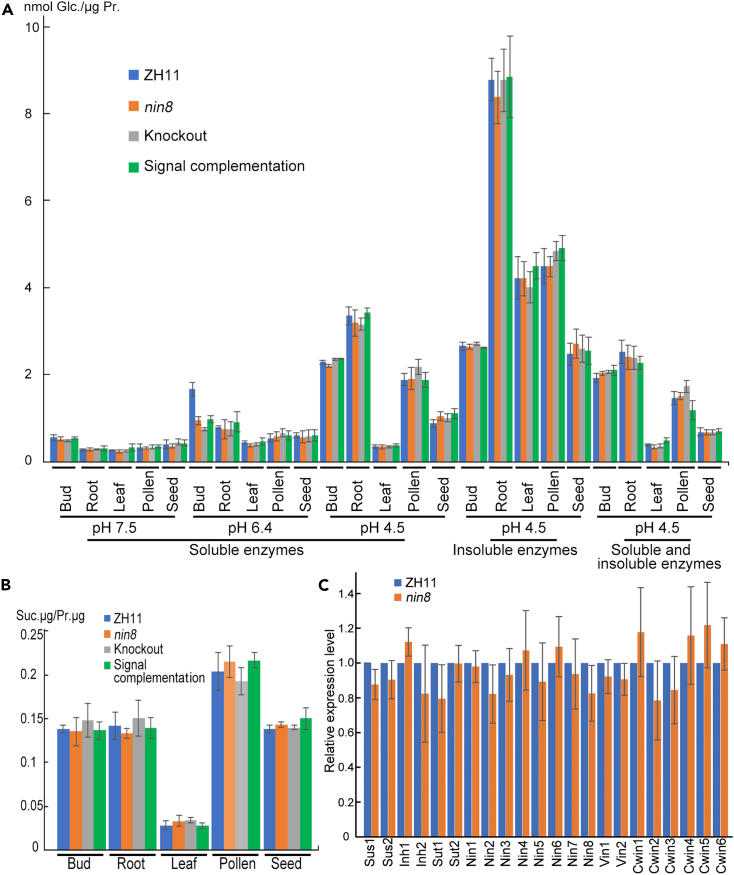
Sucrose is the transport form of carbohydrate in plants serving as signal molecule besides nutrition, but the signaling is elusive. Here, neutral invertase 8 (OsNIN8) mutated at G461R into OsNIN8m, which increased its charge and hydrophobicity, decreased hydrolysis of sucrose to 13% and firmer binding to sucrose than the wildtype. This caused downstream metabolites and energy accumulation forming overnutrition. Paradoxically, division of subinitials in longitudinal cell lineages was only about 15 times but more than 100 times in wildtype, resulting in short radicle. Further, mutation of OsNIN8 into deficiency of hydrolysis but maintenance of sucrose binding allowed cell division until ran out of energy showing the association but not hydrolysis gave the signal. Chemically, sucrose binding to OsNIN8 was exothermic but to OsNIN8m was endothermic. Therefore, OsNIN8m lost the signal function owing to change of thermodynamic state. So, OsNIN8 sensed sucrose for cell division besides hydrolyzed sucrose.

Keywords: Cell biology; Plant biology; Plant development.


Conflict of interest statement

The authors declare no conflicts of interest.

Figures

None
Graphical abstract
Figure 1
Figure 1
Mutation of an invertase causes arrests of radicle and seed setting (A–D) Phenotypes of WT (ZH11) and mutant (nin8) at 10 days after inoculation (DAI) in test-tube culture (A-B), and tillering stage (C) and maturation stage (D) in the field. (E) Root systems of ZH11 and nin8 at maturation stage, plants were grown in barrel singly and barrels were submerged in the field during the whole growing period, root system was recovered by washing carefully. (F) Mature spikes of ZH11 and nin8 showing different seed settings in nin8 spikes. (G) Diagram of map-based cloning, OsNIN8m locus was mapped to chromosome 2 between makers 404 and 252. Structure of gene indicated position of nucleotide substitution and amino acid replacement. (H–L) Radicle phenotypes of ZH11 (genotype, OsNIN8, H), nin8 (OsNIN8m, I), complementation (OsNIN8m+OsNIN8, J) and CRISPR/Cas9 knockout (OsNIN8CRISPR, K–L) lines at 10 DAI in test-tube culture. CRISPR 1 and 2, two targets of the knockout. Bar = 20 cm. (M and N) Alignments of target region between ZH11 and knockout lines showing deletions of 28 bp in CRISPR 1 and 31 bp in CRISPR 2. Regions underlined in red were guide sequences. (O and P) Morphology of mature pollen grains in ZH11 (O) and nin8 (P) by Alexander staining showing most pollen grains were not filling and agglomerated in lighter color in nin8. Bar = 50 μm. See also Figures S1–S6 and Table S1.
Figure 2
Figure 2
Arrest of subinitial division for elongation of longitudinal cell lineages stunts root growth in nin8 (A and B) Longitudinal section of ZH11 (A) and nin8 (B) root tips at 10 DAI stained by toluidine blue O. Boundary lines between elongation and mature regions and distance between two boundary lines were indicated showing the length of dividing regions in ZH11 and nin8; a, showing the central procambium cell lineage was composed of different cell lineages (a connection region); b, emergence of lateral root in nin8 showing the root was short. (C and D) Longitudinal sections of meristematic zone in ZH11 (C) and nin8 (D). Some cell lineages were indicated with line segments: longitudinal line segments indicated cell lineages in the meristem; horizontal line segments indicated cell lineages in the root cap, number represented age of cell lineages after division from the initial. Arrowheads pointed to initials. Cells with large nucleus indicated cell in mitotically active, two adjacent cells with similarly large nucleus indicated they were latest produced from the same division, cells with nuclei getting smaller and smaller on both flanks alternately indicated they were from earlier divisions; Cavities between cell lineages remained from sizes of cell became larger and larger basipetally but elder cells no longer grew with age forming spindle cell lineages. (E and F) Joints of two cell lineages in nin8 (E) and ZH11 (F). Arrowheads, ends of cell lineages. (G) Image away from growth cone showing cell lineages clearer in ZH11. Line segments indicated the length of the cell lineage, cell lineages about similar length gathered together indicated their ages were similar. (H) Cell lineages in cortex of root tips in nin8 at tillering stage showing ordering of cell lineages. (I and J) Transverse sections at maturation zone of radicles in ZH11 (I) and nin8 (J) showing their cell (cell lineage) numbers, each cell represented a cell lineage divided from the initial. (K) Cell (cell lineage) numbers in ZH11 and nin8 were similar. Cell number of 6 sections from 2 root-tips each, data were represented as mean ± SEM. (L) Cell numbers from generation 1–6 cell lineages between ZH11 and nin8 showing a big difference. Generations 1–6 of cell lineage, from the initial basipetally end to end connection cell lineages were defined as different generations. Cell number of 6 cell lineages from sections of 2 root-tips each, data were represented as mean ± SEM. (M–O) EdU incorporation and label of newly replicated DNA. Seedlings of ZH11 at 10 DAI were fed with EdU for 30 min, 3 h and 10 h, and incorporated EdU was detected by immunofluorescence. A queue of cells with EdU labeled DNA indicated newly divided cells during the treatment time in the center of a cell lineage. Scattered cell queues indicated subinitials distributed in meristem and elongation regions everywhere. Lengths of cell queue getting longer and longer successionally with treatment time indicated division of subinitials were in a line manner continually. (P–R) Cells with EdU incorporation in DNA in nin8 treated with EdU for 30 min, 3 h and 10h. (S and T) Root tips of ZH11 after EdU incorporation for 10 h showing no DNA synthesis in QC regions (circle region). Bar = 20 μm. See also Figure S11.
Figure 3
Figure 3
Different mutations of OsNIN8 alter its structure and characteristics to separate sucrose binding from sucrose hydrolysis in enzymology (A and B) Purification of proteins. Proteins were expressed in E. coli, purified using resin, dialyzed for salt removal and dissolved in 50 mM potassium phosphate buffer (pH6.4); MBP-tag (MBP), MBP fused to OsNIN8 (MBP-OsNIN8) and MBP-OsNIN8m were checked by Coomassie blue staining (A); MBP, MBP-OsNIN8, MBP-OsNIN8m, MBP-OsNIN8D275A, MBP-OsNIN8E501A, and MBP-OsNIN8D275AE501A proteins were checked by immunoblotting with MBP antibody (B). (C) Conformational comparison of MBP-OsNIN8 with MBP-OsNIN8m determined by FTIR spectroscopy assay. A mutation induced random coils at 1645 cm−1 on OsNIN8m was indicated. (D) Comparison of protein unfolding between MBP-OsNIN8 and MBP-OsNIN8m using nanoDSF assay. Temperature range, 30°C–95°C (horizontal ordinate). Recording fluorescence at 330 nm and 350 nm showing OsNIN8m was more compact (lower tryptophan fluorescence intensity) than OsNIN8 (n = 2). (E) MBP-OsNIN8 and MBP-OsNIN8m affinities to sucrose was determined by pulldown assay using amylose magnetic beads, and sucrose was determined using GC-TOF MS after washing and collection. Data were from 3 independent experiments and represented as mean ± SEM. (F) The optimum pH of OsNIN8 for sucrose hydrolysis into glucose was determined in 50 mM potassium phosphate buffer using microplate assay recorded at 450 nm. Data were from 3 independent experiments and represented as mean ± SEM. (G) Sucrose hydrolysis activities of OsNIN8, OsNIN8m, OsNIN8D275A, OsNIN8E501A and OsNIN8D275AE501A using microplate assay. Data were from 3 independent experiments and represented as mean ± SEM. MBP tag was as the negative control. (H) Enthalpy changes of sucrose hydrolysis of OsNIN8, OsNIN8m, OsNIN8D275A, OsNIN8E501A, OsNIN8D275AE501A and MBP-tag involved using the single injection of ITC assay. Reaction for 1 h at 25°C. Cumulative heat rates were indicated. (I) Enzyme kinetics of OsNIN8 for sucrose hydrolysis characterized by single injection of ITC assay. Parameters of the reaction were indicated. (J and K) High concentrations of sucrose inhibited hydrolysis activity of OsNIN8 determined by microplate (J, data were from 3 independent experiments and represented as mean ± SEM) or ITC (K). Km of microplate determine was fit to reaction curve from 0 to 20 mM of series sucrose concentration. (L and M) Concentrations of glucose (L) and fructose (M) did not inhibit OsNIN8 activity. Data were from 3 independent experiments and represented as mean ± SEM. OsNIN8 was boiled to inactivate as negative control, and different glucose or fructose concentrations were added before reaction as background, OsNIN8 increased glucose contents were shown. (N) OsNIN8 specific hydrolyzed sucrose but had little activities for hydrolysis of raffinose, cellobiose or maltose into glucose using microplate assay. Data were from 3 independent experiments and represented as mean ± SEM. (O) Titration of MBP, MBP-OsNIN8 and MBP-OsNIN8m with sucrose using ITC assay. Titration was 20 injections with interval 200 s at 25°C. Peak value > 0, Exothermic; Peak value < 0, endothermic; MBP titrating with sucrose was as negative control, its peaks were the background from the physical motion of titration; Exothermic peaks of OsNIN8 indicated heats of sucrose hydrolysis; Inversion of exothermic to endothermic peaks of OsNIN8m indicated that its endothermic binding to sucrose was offset by exothermic sucrose hydrolysis (it remained 13% activity of hydrolysis) before injection 10, when OsNIN8m binding sucrose reached an equilibrium, after then was net endotherm of binding. (P) Titrations of OsNIN8D275A, OsNIN8E501A and OsNIN8D275AE501A with sucrose. No hydrolyzing exotherm as OsNIN8 shown but the peak heights getting lower and lower indicated the sites for sucrose docking lessening with the titration showing a strong exothermic association between proteins and sucrose. See also Figures S8–S10.
Figure 4
Figure 4
Catalytic mutation of OsNIN8 separates sucrose signaling from sucrose hydrolysis in cytology (A–C) Germination of mutants deficient in sucrose hydrolysis of OsNIN8. Transgenic lines of complementation of OsNIN8m (nin8) with OsNIN8D275A, OsNIN8E501A and OsNIN8D275AE501A for deficiency of OsNIN8 hydrolytic activity. Seeds germinated for 4 days (B), 7 days (C) and 10 days (A) were shown. Root length and shoot height were similar to positive control (nin8+OsNIN8) but were longer than that in negative control (nin8) showing normal cell division at DAI 4 indicated signal for cell division was working (B); root lengths only a half at DAI 7 (C) and one-third at DAI 10 to the positive control because their nutrient source was only 13% of the positive control from nin8. bar = 6 mm. nin8 arrested cell division all the time. (D and E) Roots of three catalytic mutation lines stopped growing at about 1 cm in length with root tips turning brown (D) and appeared dysmorphosis after magnification (E) at DAI 10. bar = 6 mm. (F–H) Longitudinal sections exhibited cell division continuing in the meristem but elongation stop forming an inflated meristem and burst in hydrolysis-deficient line (H) as compared to positive (F) and negative (G) controls. bar = 50 μm. (I–K) Catalytic mutation lines were lack of energy. Assay of ATP, ADP and AMP using UPLC-Q-TOF/MS. (I) Peak standards of ATP, ADP and AMP. Ratios of AMP/ATP (J) or ADP/ATP (K) were greater than that in positive control (nin8+OsNIN8) indicated lack of energy, while nin8 was rich in energy. Data were from 3 independent experiments and represented as mean ± SEM. Double star in red indicated significant increase; in black indicated significant decrease. (L) Rescue of root growths for a catalytic mutation line by addition of glucose in medium. A dose-dependent on glucose contents for the rescue showing lack of glucose in these seedlings owing to the catalytic mutations. nin8+OsNIN8 without glucose as control. bar = 6 mm. (M) Reducing photosynthetic sugars worsened sugar deficiency. Seedlings of a catalytic mutation line were roots and leaves removed and inoculated in media showed roots could not regrow without glucose but regrew well with addition of glucose. bar = 6 mm. See also Figure S2.
Figure 5
Figure 5
Possible effect of OsNIN8 mutation on genetic compensation for metabolic network of sucrose (A) Activities of mainly relative enzymes for sucrose hydrolysis in different tissues among different lines. Protein samples of ZH11, nin8, OsNIN8 knockout (CRISPR/Cas9) line and signal complementation line (nin8+NIN8D275AE501A) from bud (DAI 4), root and leaf of seedling (DAI 17), young panicle at pollen filling stage (7 days before heading), seed at filling stage (5 days after flower) were extracted as soluble and insoluble fractions. Soluble fraction was determined for activities of sucrose hydrolysis at pH 7.5 (alkaline invertases) and pH 6.4 (neutral invertases) from cytoplasm, and pH 4.5 (acid invertase) from vacuole; insoluble fraction was determined at pH 4.5 for acid invertases bound to cell wall; while joined soluble with insoluble fractions at pH 4.5 for possible acid invertases regulated by invertase inhibitors if they were soluble proteins. The activity unit was indicated as produced nmol glucose per μg proteins. Data were from 3 independent experiments and represented as mean ± SEM. (B) Activity of sucrose synthases for sucrose synthesis in different tissues among different lines. Soluble extracted proteins from four rice lines were determined for sucrose production from UDP-glucose and fructose. The activity unit was indicated as produced μg sucrose per μg proteins. Data were from 3 independent experiments and represented as mean ± SEM. (C) Comparison of expression levels of main sucrose metabolism relative genes in bud of ZH11 with those of nin8. These genes included two sucrose synthases (Sus1: LOC_Os06g09450; Sus2: LOC_03g28330), two invertase inhibitors (Inh1: LOC_Os10g10620; Inh2: LOC_Os04g49720), two sucrose transporters (Sut1: LOC_Os03g07470; Sut2: LOC_Os12g44370), eight neutral/alkaline invertases (Nin1-8, locus numbers saw Figure S6), two vacuolar invertases (Vin1: LOC_Os04g45290; Vin2: LOC_ Os02g01590) and six cell wall invertases (Cwin1: LOC_Os02g33110; Cwin2: LOC_Os04g33740; Cwin3: LOC_ Os04g33720; Cwin4: LOC_Os04g56920; Cwin5: LOC_Os09g08072; Cwin6: LOC_Os08g06210), expression level of ubiquitin-conjugating enzyme (LOC_ Os02g16040) served as internal standard using quantitative PCR. Data were from 3 independent experiments and represented as mean ± SEM. See also Table S8.
Figure 6
Figure 6
List comparison of sucrose signal generation relating to molecular function of OsNIN8 Showing differences in sucrose binding, binding thermodynamics, levels of nutrition and energy, and cell division among ZH11, nin8 and complementation of nin8 with OsNIN8D275AE501A line, which was the characterization of sucrose signal.

Similar articles

Cited by

References

    1. Murata T. Enzymic mechanism of starch breakdown in germinating rice seeds I. An analytical study. Plant Physiol. 1968;43:1899–1905. doi: 10.1104/pp.43.12.1899. - DOI - PMC - PubMed
    1. Palmiano E.P., Juliano B.O. Biochemical changes in the rice grain during germination. Plant Physiol. 1972;49:751–756. doi: 10.1104/pp.49.5.751. - DOI - PMC - PubMed
    1. Nomura T., Kono Y., Akazawa T. Enzymic mechanism of starch breakdown in germinating rice seeds II. scutellum as the site of sucrose synthesis. Plant Physiol. 1969;44:765–769. doi: 10.1104/pp.44.5.765. - DOI - PMC - PubMed
    1. Humphreys T.E. Sucrose efflux and export from the maize scutellum. Plant Cell Environ. 1987;10:259–266. doi: 10.1111/1365-3040.EP11602277. - DOI
    1. Sánchez-Linares L., Gavilanes-Ruiz M., Diaz-Pontones D., Guzman-Chavez F., Calzada-Alejo V., Zurita-Villegas V., Luna-Loaiza V., Moreno-Sanchez R., Bernal-Lugo I., Sanchez-Nieto S. Early carbon mobilization and radicle protrusion in maize germination. J. Exp. Bot. 2012;63:4513–4526. doi: 10.1093/jxb/ers130. - DOI - PMC - PubMed

LinkOut - more resources