. 2024 Jun 6;27(7):110202.
doi: 10.1016/j.isci.2024.110202. eCollection 2024 Jul 19.

Effect of time-restricted eating regimen on weight loss is mediated by gut microbiome

Affiliations

Effect of time-restricted eating regimen on weight loss is mediated by gut microbiome

Chensihan Huang et al. iScience. .

Abstract

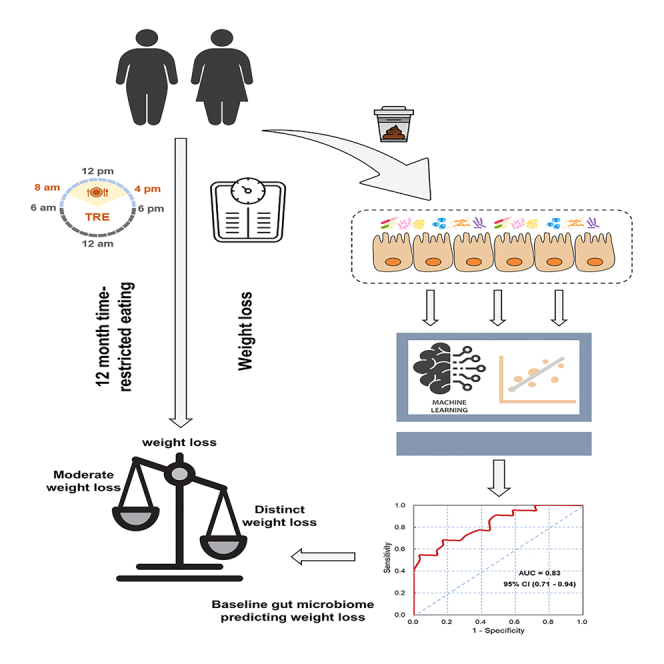
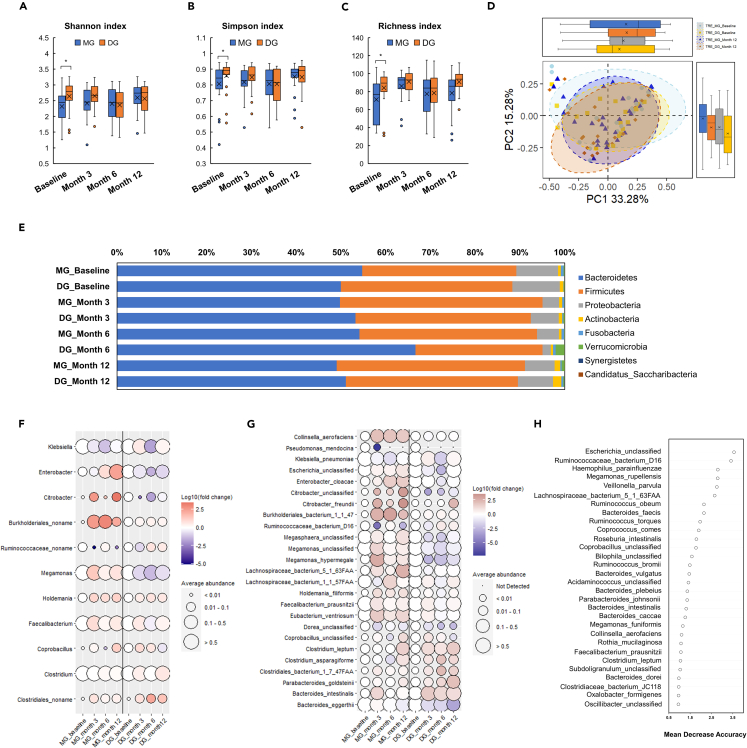
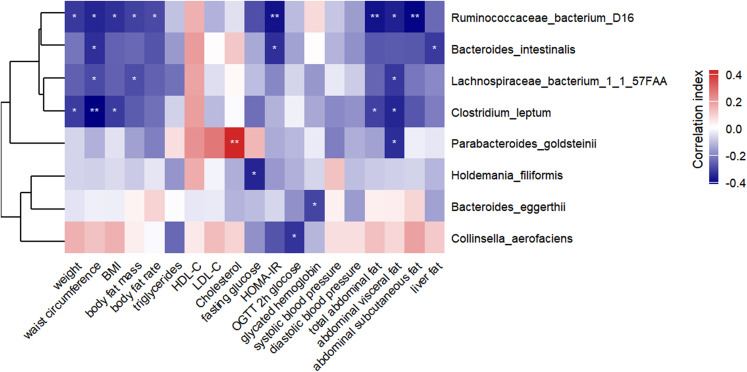
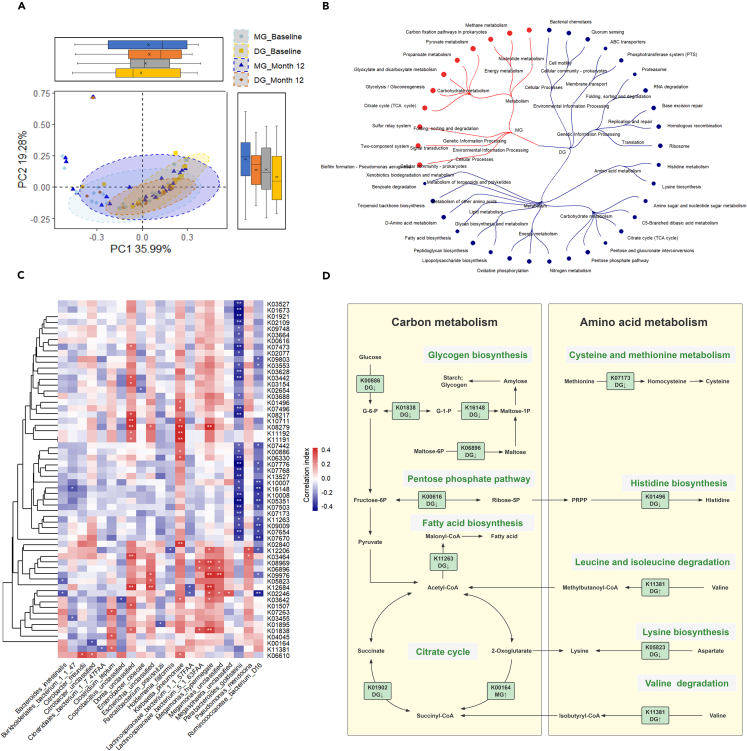
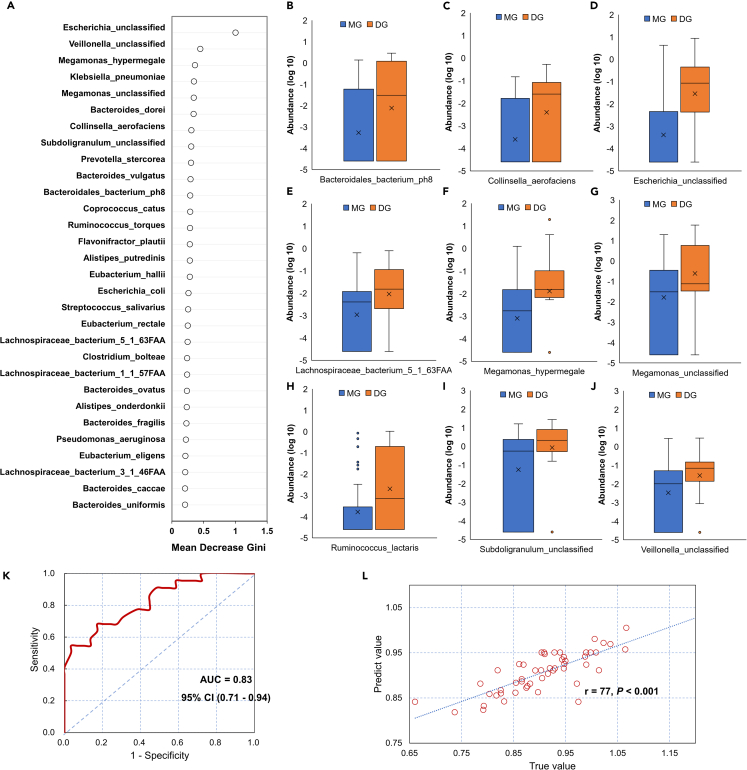
Time-restricted eating (TRE) is a promising obesity management strategy, but weight-loss efficacy varies among participants, and the underlying mechanism is unclear. The study aimed to investigate the role of gut microbiota in weight-loss response during long-term TRE intervention. We analyzed data from 51 obese adults in a 12-month TRE program, categorizing them into distinct weight loss groups (DG) and moderate weight loss groups (MG) based on their TRE responses. Shotgun metagenomic sequencing analysis revealed a significant increase in species closely associated with weight loss effectiveness and metabolic parameter changes in the DG group. Pathways related to fatty acid biosynthesis, glycogen biosynthesis, and nucleotide metabolism were reduced in the DG group and enhanced in the MG group. Next, we identified nine specific species at baseline that contributed better responses to TRE intervention and significant weight loss. Collectively, gut microbiota contributes to responsiveness heterogeneity in TRE and can predict weight-loss effectiveness.

Keywords: Human metabolism; Microbial genomics; Microbiome; Physiology.


Conflict of interest statement

The authors declare no competing interests.

Figures

None
Graphical abstract
Figure 1
Figure 1
Variation in the metabolic parameters change during a 12-month trial period (A) Schematic diagram of the study design. (B–D) Average (B) energy intake, (C) diet compliance, and (D) physical activity level during the 12-month intervention. Compliance to prescribed diets was calculated as adherent/intervention days. (E–P) The change of (E) body weight (E), (F) waist circumference, (G) body fat mass, (H) abdominal subcutaneous fat area, (I) abdominal visceral fat area, (J) liver fat, (K) systolic blood pressure, (L) diastolic blood pressure, (M) HOMA-IR, (N) fasting glucose level, (O) LDL-C, and (P) triglyceride after 12-month TRE intervention. Data were shown as mean ± standard error. ∗, p < 0.05; ∗∗, p < 0.01; ns, not significant using the PROC MIXED procedure controlling for the baseline measurements.
Figure 2
Figure 2
Gut microbial characteristics in moderate and distinct weight loss groups during a 12-month trial period (A–C) Boxplots of the alpha-diversity index including (A) Shannon, (B) Simpson, and (C) richness index between the moderate weight loss group (MG) group and distinct weight loss group (DG) group at 0, 3, 6, or 12 months of TRE intervention. In the boxplot, the cross indicates the mean, the horizontal bar indicates median; the top and bottom borders of the box mark the first and third quartiles; the error bars indicate the 5th and 95th percentiles, and the dots indicate the individuals whose values were outside the 5th or 95th percentiles. (D) Principal coordinate analysis (PCoA) of beta-diversity based on Bray-Curtis distance between the MG and DG groups. The boxplot of samples discrete distribution on the principal component (PC)1 and PC2 axis were also shown. (E) The overall composition and relative abundance of the bacterial community in each group at the phylum level. (F and G) The relative abundance of bacterium significantly altered by a 12-month TRE intervention (p < 0.05 by Wilcoxon signed-rank test) at the (F) genus and (G) species level in MG and DG groups at 0, 3, 6, or 12 months. (H) The importance of the species alterations ranked according to their contribution to the distinguishing of MG and DG groups in the classifier model built by Random Forest.
Figure 3
Figure 3
Co-abundance network before and after dietary intervention The cooccurrence networks in (A) MG group and (B) DG group at 0, 6, and 12 months of TRE intervention reflect network interaction complexity. All nodes were colored at the phylum level (isolated nodes were excluded), and edges were estimated by Spearman’s rank correlation coefficient (abs[r] > 0.6, p < 0.05). The node size represented the average relative abundance of each species.
Figure 4
Figure 4
Associations between alterations of microbial species and changes of clinical indices Heatmap of the Spearman’s correlation coefficients between changes in different clinical indices and taxonomic alterations caused by a 12-month TRE intervention after adjustment for baseline measurements. ∗p < 0.05, and ∗∗p < 0.01. Only species significantly altered by a 12-month TRE intervention (p < 0.05 by Wilcoxon signed-rank test) and with significant correlations (at least one p value <0.05) with changes of clinical indices were shown.
Figure 5
Figure 5
Functional shifts of gut microbiota in moderate and distinct weight loss groups (A) Principal coordinates analysis (PCoA) plot based on the Bray-Curtis distance in KEGG orthology(KO). The boxplot of samples discrete distribution on the principal component (PC)1 and PC2 axis in KOs were also shown. (B) Significantly altered pathways (p < 0.05) induced by TRE intervention in MG and DG, respectively. The tree demonstrates a functional hierarchy in the KEGG pathway maps. Red and blue indicate increased and decreased relative abundance, respectively. The size of outer nodes reflected the magnitude of the change. (C) Heatmap of the Spearman’s correlation coefficients between the differential KOs and taxonomic alterations caused by TRE intervention. ∗p < 0.05, and ∗∗p < 0.01. (D) Altered KOs involved in carbon metabolism and amino acids metabolism.
Figure 6
Figure 6
Baseline microbial composition contributing to the classifier of moderate and distinct weight loss groups (A) The importance of the species ranked according to their contribution to the predictive model built by Random Forest. (B–J) The relative abundance of (B) Bacteroidales_bacterium_ph8, (C) Collinsella_aerofaciens, (D) Escherichia_unclassified, (E) Lachnospiraceae_bacterium_5_1_63FAA, (F) Megamonas_hypermegale, (G) Megamonas_unclassified, (H) Ruminococcus_lactaris, (I) Subdoligranulum_unclassified, and (J) Veillonella_unclassified at baseline. ∗, p < 0.05 by Wilcoxon rank-sum test. (K) The receiver operating characteristic (ROC) curves and area under curve (AUC) of the nine-species-based algorithm for the discrimination between moderate and distinct weight loss efficacy. (L) Comparison of the association strength between the true and predicted body weight change based on the nine species.

Similar articles

Cited by

References

    1. Bluher M. Obesity: global epidemiology and pathogenesis. Nat. Rev. Endocrinol. 2019;15:288–298. doi: 10.1038/s41574-019-0176-8. - DOI - PubMed
    1. Jensen M.D., Ryan D.H., Apovian C.M., Ard J.D., Comuzzie A.G., Donato K.A., Hu F.B., Hubbard V.S., Jakicic J.M., Kushner R.F., et al. 2013 AHA/ACC/TOS guideline for the management of overweight and obesity in adults: a report of the American College of Cardiology/American Heart Association Task Force on Practice Guidelines and The Obesity Society. J. Am. Coll. Cardiol. 2014;63:2985–3023. doi: 10.1016/j.jacc.2013.11.004. - DOI - PubMed
    1. Liu D., Huang Y., Huang C., Yang S., Wei X., Zhang P., Guo D., Lin J., Xu B., Li C., et al. Calorie Restriction with or without Time-Restricted Eating in Weight Loss. N. Engl. J. Med. 2022;386:1495–1504. doi: 10.1056/NEJMoa2114833. - DOI - PubMed
    1. Bray G.A., Ryan D.H., Johnson W., Champagne C.M., Johnson C.M., Rood J., Williamson D.A., Sacks F.M. Markers of dietary protein intake are associated with successful weight loss in the POUNDS Lost trial. Clin. Obes. 2017;7:166–175. doi: 10.1111/cob.12188. - DOI - PMC - PubMed
    1. Greenberg I., Stampfer M.J., Schwarzfuchs D., Shai I., DIRECT Group Adherence and success in long-term weight loss diets: the dietary intervention randomized controlled trial (DIRECT) J. Am. Coll. Nutr. 2009;28:159–168. doi: 10.1080/07315724.2009.10719767. - DOI - PubMed

LinkOut - more resources