. 2024 Jun 8;27(7):110215.
doi: 10.1016/j.isci.2024.110215. eCollection 2024 Jul 19.

Control of a chemical chaperone by a universally conserved ATPase

Affiliations

Control of a chemical chaperone by a universally conserved ATPase

Hong Jiang et al. iScience. .

Abstract

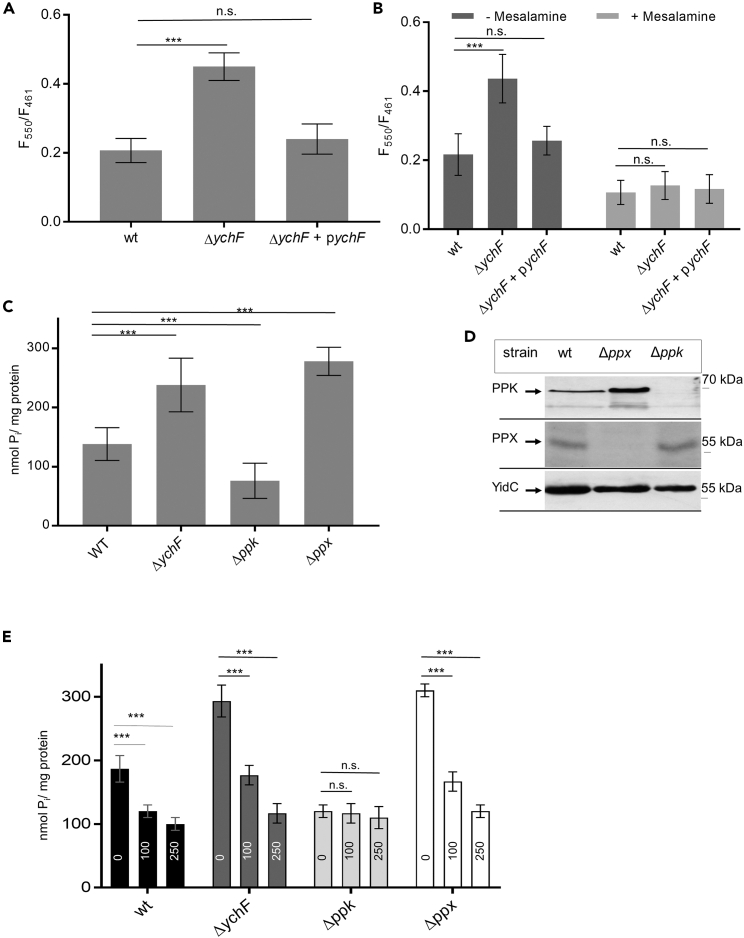
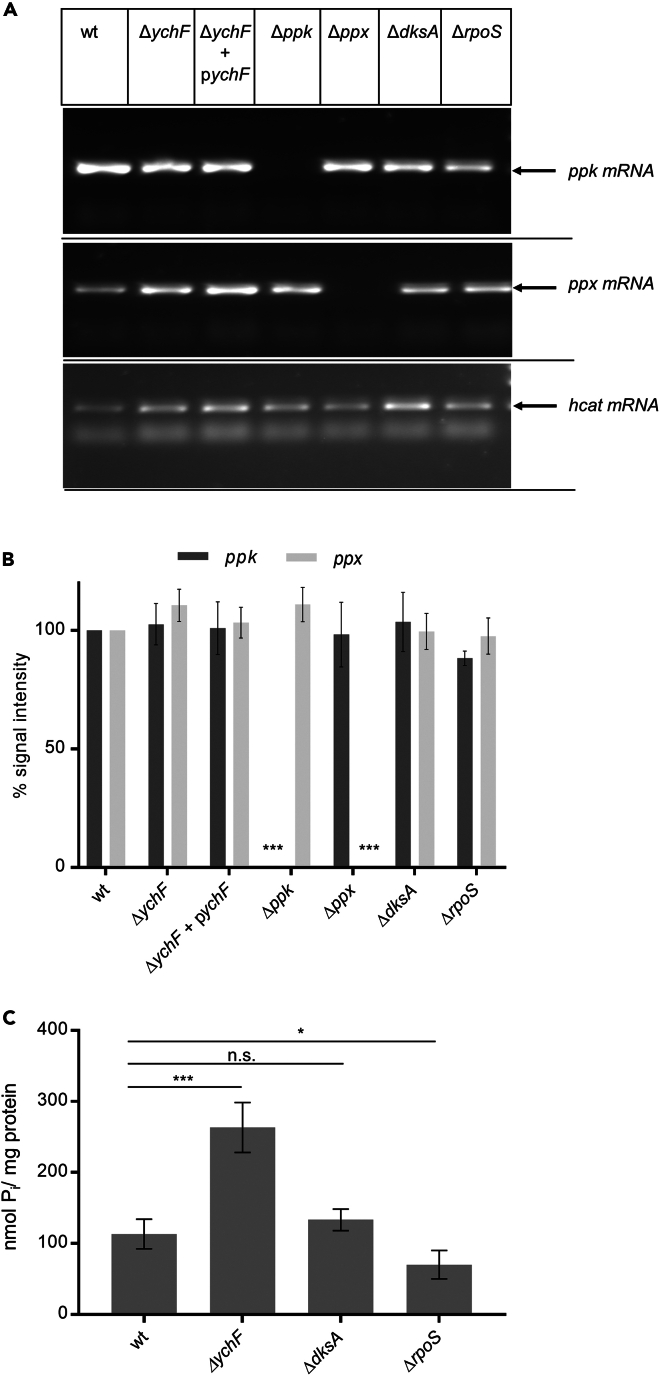
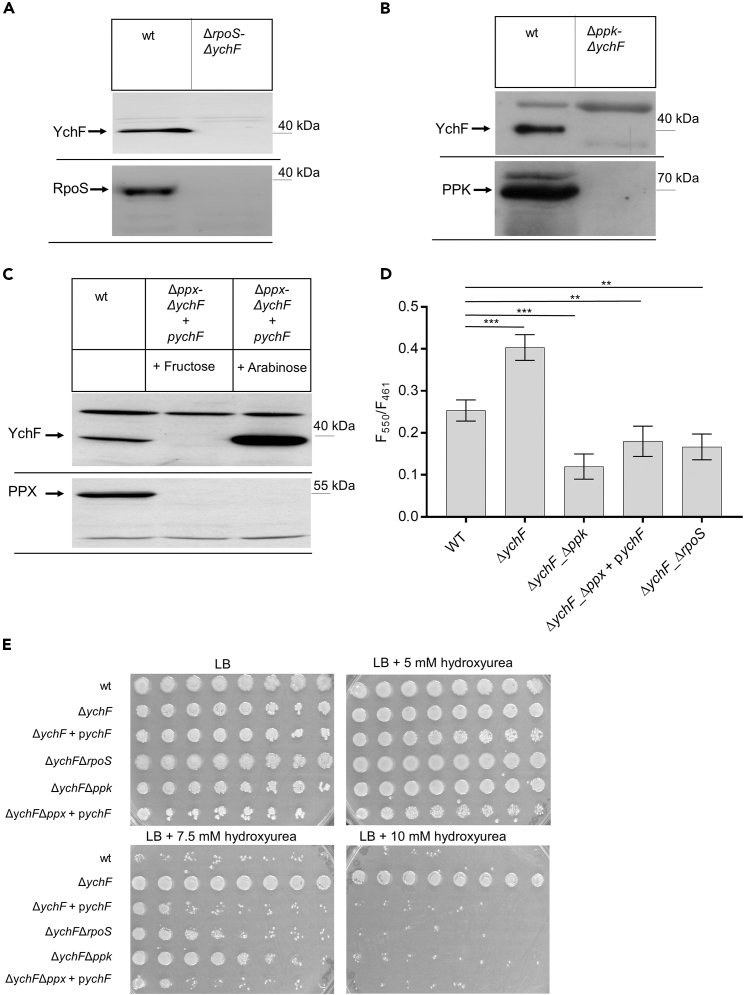
The universally conserved YchF/Ola1 ATPases regulate stress response pathways in prokaryotes and eukaryotes. Deletion of YchF/Ola1 leads to increased resistance against environmental stressors, such as reactive oxygen species, while their upregulation is associated with tumorigenesis in humans. The current study shows that in E. coli, the absence of YchF stimulates the synthesis of the alternative sigma factor RpoS by a transcription-independent mechanism. Elevated levels of RpoS then enhance the transcription of major stress-responsive genes. In addition, the deletion of ychF increases the levels of polyphosphate kinase, which in turn boosts the production of the evolutionary conserved and ancient chemical chaperone polyphosphate. This potentially provides a unifying concept for the increased stress resistance in bacteria and eukaryotes upon YchF/Ola1 deletion. Intriguingly, the simultaneous deletion of ychF and the polyphosphate-degrading enzyme exopolyphosphatase causes synthetic lethality in E. coli, demonstrating that polyphosphate production needs to be fine-tuned to prevent toxicity.

Keywords: Applied sciences; Biotechnology; Medical biochemistry.


Conflict of interest statement

The authors declare no competing interests.

Figures

None
Graphical abstract
Figure 1
Figure 1
The absence of YchF increases the RpoS levels in E. coli (A) Wild type (wt), the ΔychF strain, and the ΔychF strain containing ychF on a plasmid under the arabinose promoter were grown on LB medium or LB medium supplemented with 0.01% arabinose for ΔychF + pychF up to an optical density (OD600) of 1.5 and cells were then precipitated with trichloroacetic acid (TCA) and separated by SDS-PAGE, followed by western blotting and immune detection using α-YchF antibodies. ∗ indicates a band that is unspecifically recognized by α-YchF antibodies. A representative blot of n ≥ 3 experiments is shown. (B) Growth-phase-dependent production of YchF. E. coli wt cells were grown on LB medium up to the indicated OD and processed as in (A). The membrane after blotting was cut into two pieces, which were either decorated with α-YchF antibodies or with α-YidC antibodies as loading control. A representative blot of n ≥ 3 experiments is shown. (C) The E. coli strains were grown on LB medium up to OD600 0.8 and processed as in (A). One part of the membrane was incubated with α-RpoS antibodies, and the other part with α-YidC antibodies. ∗ indicates a band that is unspecifically recognized by α-RpoS antibodies. See also Figure S1. (D) The α-RpoS western blot signals of several independent experiments as shown in Figure 1C (n = 18; cells grown on LB medium to OD600 ∼0.8) were quantified by ImageJ. Signal intensities of wt cells in individual experiments were set to 100% and the intensities in the ΔychF and ΔychF + pychF strains were calculated and visualized by GraphPad prism. The error bars reflect the standard deviation. To determine the significance of the results, the p value was calculated using the “unpaired, two-tailed t test” of the program GraphPad prism. The p values are depicted as asterisks (∗) above the graphs as following: not significant (n.s.) = p > 0.05; ∗∗∗ = p ≤ 0.001. (E) RT-qPCR of wt and ΔychF cells, grown in LB medium until OD600 = 0.8. Total cellular RNAs were extracted from 108 cells, using the RNAeasy mini Kit (QIAGEN) and samples were treated with DNaseI. Using random primers, a cellular cDNA library was created of 1 μg total RNA by reverse transcription. The cDNA amount of the target genes katE, osmY and the reference gene hcaT were analyzed by qPCR, as described in Material and Methods. The graph shows the mean values of the fold change of the expression of katE and osmY in biological triplicates from ΔychF cells (gray) compared to wt cells (white). The error bars reflect the standard deviation. To determine the significance of the results, the p value was calculated using the “unpaired, two-tailed t test” of the program GraphPad Prism 6. The p values are depicted as asterisks (∗) above the graphs as following: n.s. = p > 0.05; ∗ = p ≤ 0.05; ∗∗ = p ≤ 0.01; ∗∗∗ = p ≤ 0.001. (F) Lipidomic analyses of isolated inner membrane vesicles (INVs) derived from the indicated strains. The extraction, analysis, and quantification were performed by Lipotype GmbH, Dresden, Germany, as described in Material and Methods. Shown are the percentages of the main E. coli lipids (phosphatidylethanolamine, PE; phosphatidylglycerol, PG; cardiolipin, CL; and phosphatidic acid, PA). The error bars reflect the standard deviation (n = 3). The “unpaired, two-tailed t test” of the program GraphPad prism revealed no significant differences in the lipid composition between wt, ΔychF, and ΔychF + pychF strains (p > 0.05). For the sake of clarity, the p values are not displayed in the figure.
Figure 2
Figure 2
Post-transcriptional regulation of RpoS levels by YchF (A) The rpoS mRNA levels were determined and analyzed as described in Figure 1E from cells grown on LB medium to OD600 0.8 (n = 3). (B) Wt and the ΔychF strain were grown on LB medium up to OD600 0.8 and protein synthesis was stopped by the addition of chloramphenicol (35 μg/mL). One sample was directly precipitated by TCA, while the others were only TCA precipitated after the indicated time points. Samples were then separated by SDS-PAGE and RpoS was visualized after western blotting. FtsY served as a control. (C) Quantification of the data shown in (B). Signal intensities of several independent experiments (RpoS n = 9; FtsY n = 3) were quantified by ImageJ. The values at time = 0 were set to 100%. (D) Cartoon depicting the translational mCherry fusion constructs for monitoring the influence of YchF on RpoS production. See text for details. (E) mCherry fluorescence of the constructs shown in (D) was monitored at an emission wavelength of 610 nm in wt and ΔychF cells grown in LB medium up to OD600 = 1.0 using a Tecan Spark plate reader. The values were corrected for the OD600 values and the F610/OD600 values are displayed. Values represent the mean values of n ≥ 3and the standard deviation is indicated. To determine the significance of the results, the p value was calculated using the “unpaired, two-tailed t test” of the program GraphPad prism. The p values are depicted as asterisks (∗) above the graphs as following: n.s. = p > 0.05; ∗∗ = p ≤ 0.01; ∗∗∗ = p ≤ 0.001.
Figure 3
Figure 3
The absence of YchF increases the polyP levels in E. coli (A) Polyphosphate was determined in whole cells using DAPI fluorescence. Cells were grown overnight in LB medium, transferred to fresh LB medium, and grown up to an optical density of 0.6–0.7. Cells were then washed and transferred to minimal MOPS medium for 2 h. 2 × 108 cells were then incubated with 10 μM DAPI for 5 min at 37°C. For polyP-DAPI, the fluorescence was determined after excitation at 414 nm and emission at 550 nm with the Tecan Spark plate reader. As internal control, the DNA-DAPI fluorescence was also determined after excitation at 358 nm and emission at 461 nm. Shown are the mean values of the F550/F461 values and standard deviations of n = 4 independent experiments. (B) As in (A), but polyP was also determined in cells that were incubated for 2 h in minimal MOPS medium in the presence of 200 μM mesalamine for inhibiting polyphosphate kinase (PPK). (C) Polyphosphate determination in cell extracts via E. coli exopolyphosphatase (PPX)-based polyP degradation and phosphate determination by malachite green. Cells were grown as above and shifted to minimal MOPS medium for 2 h. PolyP was then extracted from E. coli cells by phenol-chloroform treatment and precipitated by ethanol-sodium acetate treatment. After dissolving polyP, purified PPX (3 μM) was added and the released phosphate was determined spectrophotometrically by malachite green and the phosphate concentration was determined using a phosphate standard curve (0–40 μM). The phosphate concentrations were normalized to the protein content of the cell extract. Indicated are mean values and the standard deviations of n ≥ 5 independent experiments. (D) Immune detection of PPK and PPX in the corresponding single deletion strains. E. coli cells grown as above in MOPS minimal medium were TCA precipitated and after separation by SDS-PAGE and western blotting analyzed by the indicated antibodies. Shown is a representative blot of n = 3 repeats. (E) PPX-based polyP determination of mesalamine-treated E. coli cells. Cells were incubated with increasing mesalamine concentrations (0, 100, and 250 μM, as indicated within the columns) and analyzed as described in (C). The significances of the quantitative results were determined via the “unpaired, two-tailed t test” of the program GraphPad prism. The p values are depicted as asterisks (∗) above the graphs as following: n.s. = p > 0.05; ∗∗∗ = p ≤ 0.001.
Figure 4
Figure 4
YchF does not influence the transcription of the ppk-ppx operon (A) Total mRNA was isolated from the indicated strains and treated as described in Figure 1, followed by RT-PCR using specific ppk, ppx, and hcat primer, respectively. (B) Quantification of the data shown in (A). Shown are the mean values and standard deviations of n ≥ 4 independent experiments. For the sake of clarity, only significant p values are displayed. (C) PolyP was determined by the PPX-based assay as in Figure 3C and shown are the mean values and standard deviations of n ≥ 4 independent experiments. The significance of the results was determined via the “unpaired, two-tailed t test” of the program GraphPad prism. The p values are depicted as asterisks (∗) above the graphs as following: n.s. = p > 0.05; ∗ = p ≤ 0.05; ∗∗ = p ≤ 0.01; ∗∗∗ = p ≤ 0.001.
Figure 5
Figure 5
YchF increases the steady-state levels of PPK (A) In vitro assay of PPX-based polyP100 degradation. Purified PPX (3 μM) was incubated with 1 mM polyP100 in the absence or presence of purified YchF (3 μM or 12 mM final concentration). At the indicated time points, samples were taken and the released phosphate was determined spectrophotometrically by malachite green. Shown are the mean values of three independent experiments and the standard deviation is indicated by error bars. (B) The in vitro assay was performed as in (A), but as endpoint assay (20 min incubation, n = 3) in the presence of different YchF concentrations and with polyP100 and polyP700 (1 mM final concentration) as substrates. (C) Immune detection of PPK in different strains. Cells were grown in LB medium and 2 × 108 cells were TCA precipitated, and separated by SDS-PAGE. Note, that the PPK levels in wt cells grown on LB medium are below the detection level. After western blotting the upper part of the membrane was analyzed with PPK antibodies and the lower part of the membrane was stained with Ponceau S. Shown is a representative blot of n = 3 repeats. (D) Wt and ΔychF cells were grown on LB medium to an optical density of 0.8 and then shifted to minimal MOPS medium for 2 h before TCA precipitation, SDS-PAGE, and immune detection using α-YchF and α-PPK antibodies. Shown is a representative blot of n = 3 repeats.
Figure 6
Figure 6
Synthetic lethality of a ychF-ppx double knockout strain (A) A ychF-rpoS double knockout strain was generated via λ-red recombination, grown on LB medium, and analyzed with α-YchF and α-RpoS antibodies. (B) The ychF-ppk double knockout strain was also generated via λ-red recombination and whole cells were analyzed by immune detection using α-YchF and α-PPK antibodies after cell growth for 2 h on MOPS minimal medium. (C) Deleting ppx in a ΔychF background was only possible in a ΔychF strain containing a ychF copy on the pBAD24 plasmid. However, ΔychFΔppx + pychF cells were able to grow on LB medium even in the absence of the inducer arabinose, because the ara promoter showed some leakiness. (D) Polyphosphate levels in the indicated strains were determined via DAPI staining of cells grown first on LB medium, before shifting them to MOPS minimal medium, as described in Figure 3 (n = 4). The significance of the results was determined via the “unpaired, two-tailed t test” of the program GraphPad prism. The p values are depicted as asterisks (∗) above the graphs as following: n.s. = p > 0.05; ∗ = p ≤ 0.05; ∗∗ = p ≤ 0.01; ∗∗∗ = p ≤ 0.001. (E) The indicated strains were grown on LB medium or on LB medium containing 0.01% arabinose in case of ΔychFΔppx + pychF to OD600 of ∼1.0, washed once with PBS before serial dilution in PBS. Of each dilution, starting with 107 cells, 10 μL cell suspensions were spotted onto LB plates and LB plates containing, 5, 7.5, or 10 mM hydroxyurea. Cell growth was monitored after overnight incubation at 37°C. See also Figure S2.

Similar articles

Cited by

References

    1. Costa-Mattioli M., Walter P. The integrated stress response: From mechanism to disease. Science. 2020;368 doi: 10.1126/science.aat5314. - DOI - PMC - PubMed
    1. Pan T. Adaptive translation as a mechanism of stress response and adaptation. Annu. Rev. Genet. 2013;47:121–137. doi: 10.1146/annurev-genet-111212-133522. - DOI - PMC - PubMed
    1. Landwehr V., Milanov M., Hong J., Koch H.G. The Role of the Universally Conserved ATPase YchF/Ola1 in Translation Regulation during Cellular Stress. Microorganisms. 2021;10:14. doi: 10.3390/microorganisms10010014. - DOI - PMC - PubMed
    1. Njenga R., Boele J., Öztürk Y., Koch H.G. Coping with stress: how bacteria fine-tune protein synthesis and protein transport. J. Biol. Chem. 2023;299 doi: 10.1016/j.jbc.2023.105163. - DOI - PMC - PubMed
    1. Rother M., Teixeira da Costa A.R., Zietlow R., Meyer T.F., Rudel T. Modulation of Host Cell Metabolism by Chlamydia trachomatis. Microbiol. Spectr. 2019;7 doi: 10.1128/microbiolspec.BAI-0012-2019. - DOI - PMC - PubMed

LinkOut - more resources