. 2024 May 23;27(7):110065.
doi: 10.1016/j.isci.2024.110065. eCollection 2024 Jul 19.

Thalamocortical interactions shape hierarchical neural variability during stimulus perception

Affiliations

Thalamocortical interactions shape hierarchical neural variability during stimulus perception

Adrià Tauste Campo et al. iScience. .

Abstract

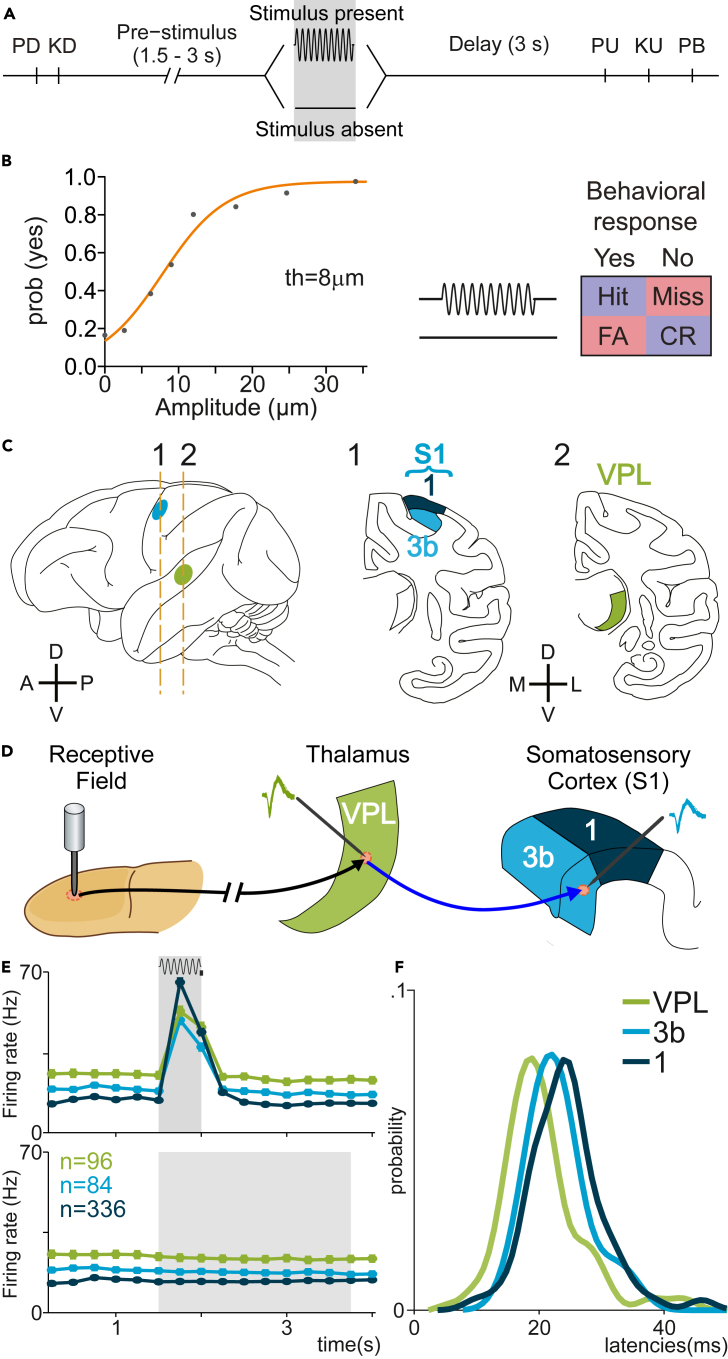
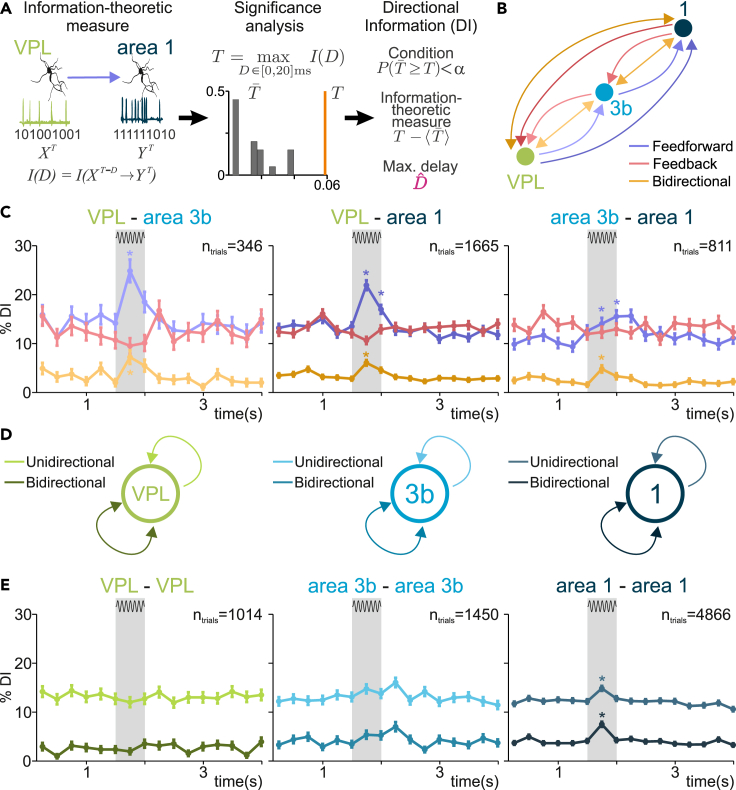
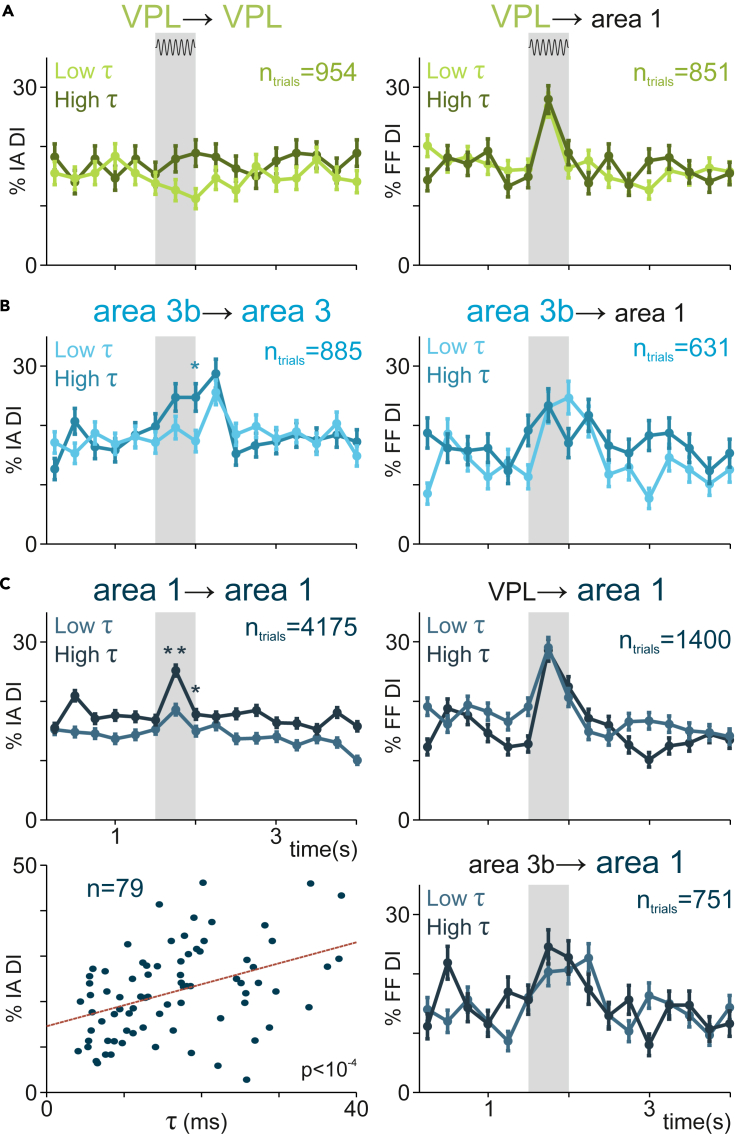
The brain is organized hierarchically to process sensory signals. But, how do functional connections within and across areas contribute to this hierarchical order? We addressed this problem in the thalamocortical network, while monkeys detected vibrotactile stimulus. During this task, we quantified neural variability and directed functional connectivity in simultaneously recorded neurons sharing the cutaneous receptive field within and across VPL and areas 3b and 1. Before stimulus onset, VPL and area 3b exhibited similar fast dynamics while area 1 showed slower timescales. During the stimulus presence, inter-trial neural variability increased along the network VPL-3b-1 while VPL established two main feedforward pathways with areas 3b and 1 to process the stimulus. This lower variability of VPL and area 3b was found to regulate feedforward thalamocortical pathways. Instead, intra-cortical interactions were only anticipated by higher intrinsic timescales in area 1. Overall, our results provide evidence of hierarchical functional roles along the thalamocortical network.

Keywords: Neuroscience; cognitive neuroscience; sensory neuroscience.


Conflict of interest statement

All authors have no relevant financial or non-financial interests to disclose.

Figures

None
Graphical abstract
Figure 1
Figure 1
Detection task, psychophysical performance, recording sites, and neuronal responses during the task (A) Vibrotactile detection task. Trials began when the stimulator probe indented the skin of one fingertip of the monkey’s restrained right hand (probe down, PD); the monkey reacted by placing its left, free hand on an immovable key (key down, KD). After a variable prestimulus period (1.5–3 s), a vibratory stimulus of variable amplitude (1–34 μm, 20 Hz, 0.5 s duration) was presented on one-half of the trials; no stimulus was presented on the other half of the trials. Following the stimulus presentation period (whether the stimulus was present or not), the monkey waited for 3 s until the probe was lifted off from the skin (PU, probe up), then the animal releases the key (KU, key up) and pressed one of two push buttons (PBs) to report whether the stimulus was present (lateral button) or absent (medial button). Stimulus-present and stimulus-absent trials were randomly interleaved within a run. (B, Left) Mean psychometric function depicting the probability of the monkey’s reporting yes (presence) as a function of the stimulus amplitude (th = 8 μm, detection threshold). (B, Right) Behavioral responses depending on the stimulus presence (Hit or Miss) or stimulus absence (CR, correct rejection; FA, false alarm). (C) Recording sites in the thalamus ventral posterior lateral (VPL) nucleus (green) and in areas 1 (dark blue) and 3b (light blue) of the primary somatosensory cortex (S1). (D) Scheme depicting how the neural activity from single neurons in the VPL and S1 (3b or area 1) sharing the same cutaneous receptive field was simultaneously recorded during the detection task. (E) Mean firing rate for the simultaneously recorded VPL (n = 96 units), area 3b (n = 84 units), and area 1 (n = 336 units) neurons supra-threshold hits (top) and correct rejections (CR, bottom). The timescale is aligned to the minimum variable period, 1.5 s before stimulus onset. Gray rectangle (top) represents stimulation period, whereas gray rectangle (bottom) represents the possible period of stimulation, according to task design. (F) Probability density of the neuronal response latencies with respect to stimulus onset during hit trials.
Figure 2
Figure 2
Areas’ intrinsic timescales are hierarchically ordered across the somatosensory network Autocorrelation functions were computed on the spiking activity recorded during the baseline period (1.5 s) before stimulus onset. An exponential decay function was fit to the resulting autocorrelation function. Confidence intervals for the decay rate parameter intrinsic timescale (τ) were estimated through non-parametric bootstrap. (A) Distribution of neuronal τ in each area (green, VPL, n = 21 units, median τ = 8.46 ms; light blue, area 3b, n = 31 units, median τ = 8.64 ms; dark blue, area 1, n = 87 units, median τ = 12.5 ms.). (B–D) Population autocorrelation and fitted exponential decay function by each area. Colored filled dots represent the average autocorrelation values for each time bin difference (across pairs and neurons). Solid lines represent the fitted exponential decay function. (B) VPL (green, τ = 9.98 ± 2 ms). (C) Area 3b (light blue, τ = 10.11 ± 2 ms). (D) Area 1 (dark blue, τ = 14.06 ± 3 ms).
Figure 3
Figure 3
Fano factor is hierarchically distributed across the somatosensory pathway (A) Time-varying average Fano factor during hit trials for each area (VPL, n = 55 units; area 3b, n = 43 units; area 1, n = 123 units). Values for each neuron are computed and averaged over all amplitudes with enough hit trials (≤5). Error bars denote the SEM with respect to the mean over neurons in each area. Shaded area highlights the stimulus period. (B) Relationship between the average and the variance of the number of spikes during stimulus period intervals. Each dot corresponds to a different stimulus amplitude for each neuron. The red dashed line plots the identity straight line (mean = variance) that should follow a Poisson distribution. (C) Histograms and estimated probability density of Fano factor per neurons during the first half of the stimulus period. The median value of each distribution are FVPL = 0.692, FArea 3b = 0.731 and FArea_1 = 0.899.
Figure 4
Figure 4
Inter- and intra-area directional interactions in the thalamocortical network (A) Sequential scheme representing the method to infer DI at single-trial level. Left: information-theoretic measure is estimated between single-trial spike trains of the simultaneously recorded neurons in VPL and area 1 for delays (0, 2, 4, ⋯ , 20 ms). Middle: significance is locally determined via non-parametric testing (α=0.05) of a maximizing-delay statistic. Right: every significant trial (P<α) is denoted as Directional Information (DI) trial and is associated with an unbiased value and a delay. (B) Scheme showing feedforward, feedback, and bidirectional interactions across VPL, area 3b, and area 1. The arrows connecting VPL and area 1 are slightly darker colors to indicate the relationships in (C). Darker colors represent direct interactions without passing through area 3b as an intermediary. (C) Percentage of DI trials for feedforward (purple), feedback (red), and bidirectional (orange) interactions is shown along the task during supra-threshold hits. Left: VPL-area 3b neuron pairs (n = 346 trials). Middle: VPL-area 1 pairs (n = 1,665 trials). Right: area 3b-area 1 pairs (n = 811 trials). Error bars denote the SEM. Asterisks denote significant differences (p < 0.01) between a pre-stimulus baseline (1 s) and stimulus periods with sufficiently high effect size (H ≥ 0.1). H (Cohen’s H) measures the effect size of each DI type: VPL→area 3b, H = 0.26; VPL↔area 3b, H = 0.17; VPL→area 1, H = 0.22; VPL↔area 1, H = 0.12; area 3b→area 1, H = 0.1; area 3b↔area 1, H = 0.11 (0–0.25 s of stimulus period). Shaded area highlights the stimulus period (500 ms). (D) Scheme showing unidirectional and bidirectional interactions within VPL (left), area 3b (middle), and area 1 (right). (E) Percentage of DI trials for unidirectional (lighter color) and bidirectional interactions (darker color) are shown throughout the task during supra-threshold hit trials. Error bars denote the SEM. Asterisks denote significant differences (p < 0.01) between a pre-stimulus baseline (1 s) and stimulus periods with sufficiently high effect size (H ≥ 0.07). Left: VPL-VPL pairs (n = 1,014 trials). Middle: area 3b-area 3b pairs (n = 1,450 trials). Right: area 1-area 1 pairs (n = 4,866 trials). H (Cohen’s H) for each significant DI type during first half of stimulation: area 1→area 1, H = 0.075; area 1↔area 1, H = 0.15.
Figure 5
Figure 5
Feedforward interactions are differentially related to the Fano factor in each area (A) Average Fano factor during the task in VPL (left), area 3b (middle), and area 1 (right) as a function of two groups of neurons (low [light-colored] and high [dark] Fano factor neurons). These groups are split by the population median during the first half of the stimulus. (B and C) Percentage of feedforward interactions from VPL to area 1 (B) and from area 3b to area 1 (C) during the task (0–4 s) for two groups split by VPL (B) and the area 3b (C) Fano factor median during the stimulus, respectively. (D) Percentage of feedforward interactions from VPL to area 1 during the task (0–4 s) for two groups split by the area 1 Fano factor median during the first half of the stimulus. (E and F) Percentage of feedforward interactions from VPL to area 1 (E) and from area 3b to area 1 (F) during the task (0–4 s) for two groups split by VPL (E) and the area 3b (F) firing rate median during the first half of the stimulus, respectively. (G) Percentage of feedforward interactions from area 3b to area 1 during the task (0–4s) for two groups split by the area 1 Fano factor median during the first half of the stimulus. Error bars denote the SEM. Shaded areas highlight the stimulus period (1.5–2 s). Asterisks denote significant differences (∗, p < 0.05) in percentage of outgoing/incoming feedfoward interactions between both groups of neurons.
Figure 6
Figure 6
Cortical intra-area interactions area associated with intrinsic timescales Percentage of intra-area incoming unidirectional interactions (left) and feedforward interactions (right) in each area during the task for two groups of neurons (low [light-colored] and high [dark] intrinsic timescale neurons). Error bars denote the SEM, and shaded areas highlight the stimulus period (0–0.5 s). (A) Effect of VPL intrinsic timescales. Left: percentage of intra-VPL unidirectional DI. Right: percentage of feedforward interactions from VPL to area 1. (B) Effect of area 3b intrinsic timescales. Left: percentage of intra-area 3b unidirectional incoming interactions. Right: percentage of feedforward interactions from area 3b to area 1. (C) Effect of area 1 intrinsic timescales. Left top: percentage of intra-area 1 unidirectional incoming information. Left bottom: scatterplot highlighting the correlation (ρ = 0.43, n = 79 pairs, p < 10−4) between the intrinsic timescale and the percentage of incoming intra-area interactions across area 1 neurons during the first half of the stimulus period. Right top: percentage of feedforward interactions from VPL to area 1. Right bottom: percentage of feedforward interactions from area 3b to area 1. Asterisks denote significant differences (∗∗, p < 0.01; ∗, p < 0.05) in percentage of directional interactions (incoming intra-area or feedforward) between both groups of neurons.

Similar articles

Cited by

References

    1. Wang X.-J. Macroscopic gradients of synaptic excitation and inhibition in the neocortex. Nat. Rev. Neurosci. 2020;21:169–178. - PMC - PubMed
    1. Harris J.A., Mihalas S., Hirokawa K.E., Whitesell J.D., Choi H., Bernard A., Bohn P., Caldejon S., Casal L., Cho A., et al. Hierarchical organization of cortical and thalamic connectivity. Nature. 2019;575:195–202. - PMC - PubMed
    1. Romo R., Rossi-Pool R. Turning Touch into Perception. Neuron. 2020;105:16–33. - PubMed
    1. Sherman S.M., Guillery R.W. The role of the thalamus in the flow of information to the cortex. Philos. Trans. R. Soc. Lond. B Biol. Sci. 2002;357:1695–1708. - PMC - PubMed
    1. Halassa M.M., Sherman S.M. Thalamocortical Circuit Motifs: A General Framework. Neuron. 2019;103:762–770. - PMC - PubMed