

Spatial-temporal analysis of hepatitis E in Hainan Province, China (2013-2022): insights from four major hospitals
- PMID: 38993698
- PMCID: PMC11236752
- DOI: 10.3389/fpubh.2024.1381204
Spatial-temporal analysis of hepatitis E in Hainan Province, China (2013-2022): insights from four major hospitals
Abstract
Objective: Exploring the Incidence, Epidemic Trends, and Spatial Distribution Characteristics of Sporadic Hepatitis E in Hainan Province from 2013 to 2022 through four major tertiary hospitals in the Province.
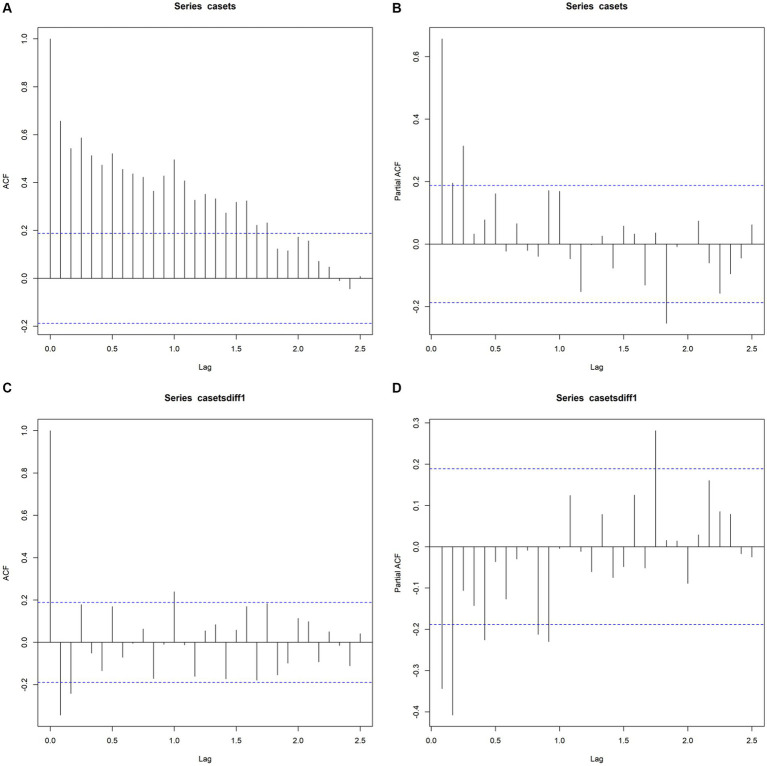
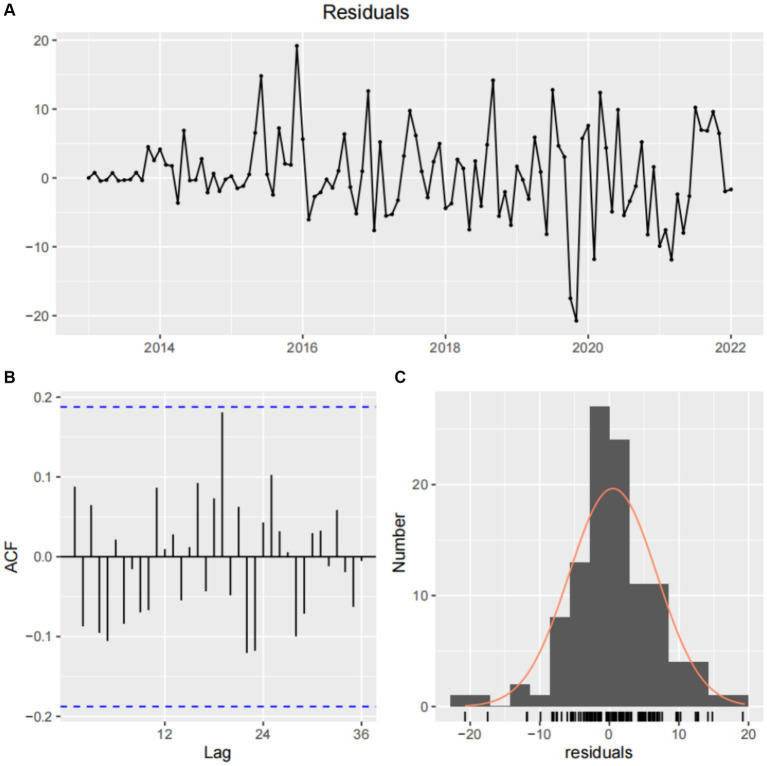
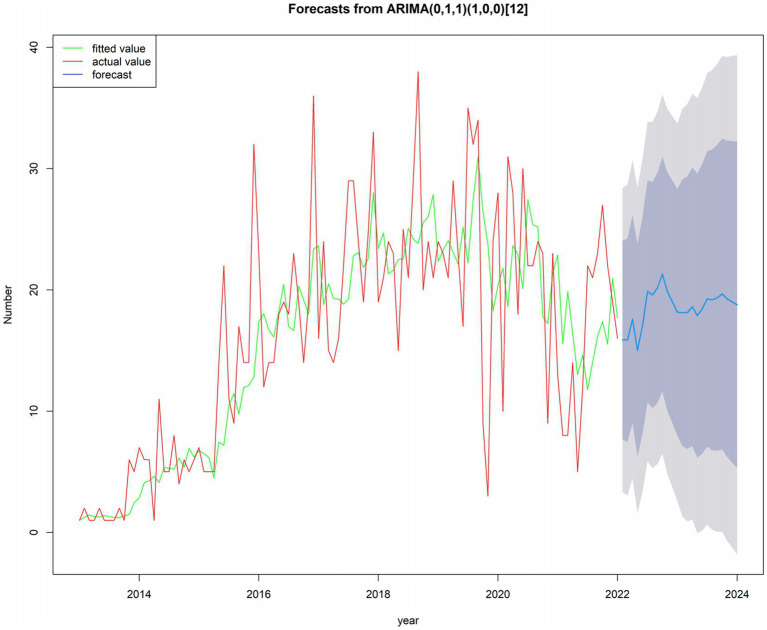
Methods: We collected data on confirmed cases of hepatitis E in Hainan residents admitted to the four major tertiary hospitals in Haikou City from January 2013 to December 2022. We used SPSS software to analyze the correlation between incidence rate and economy, population density and geographical location, and origin software to draw a scatter chart and SAS 9.4 software to conduct a descriptive analysis of the time trend. The distribution was analyzed using ArcMap 10.8 software (spatial autocorrelation analysis, hotspot identification, concentration, and dispersion trend analysis). SAS software was used to build an autoregressive integrated moving average model (ARIMA) to predict the monthly number of cases in 2023 and 2024.
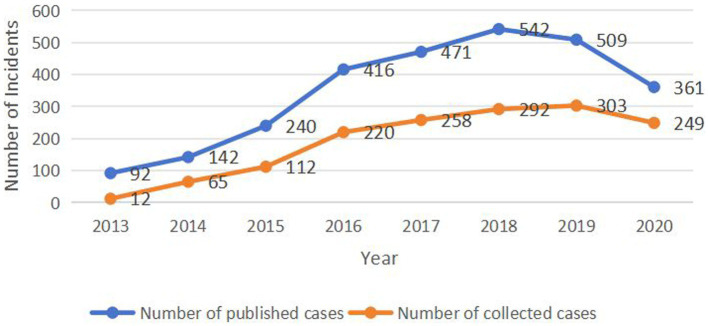
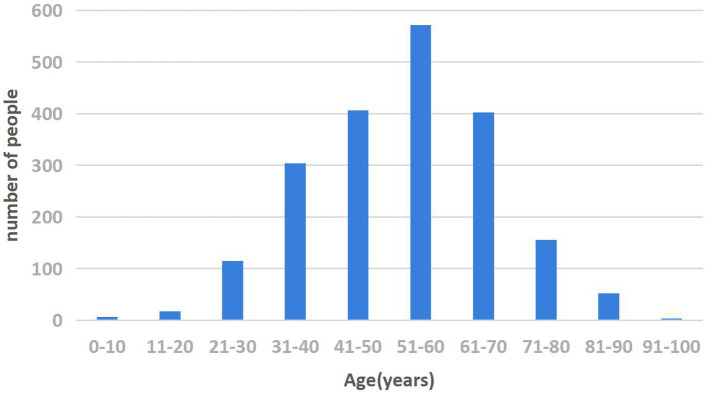
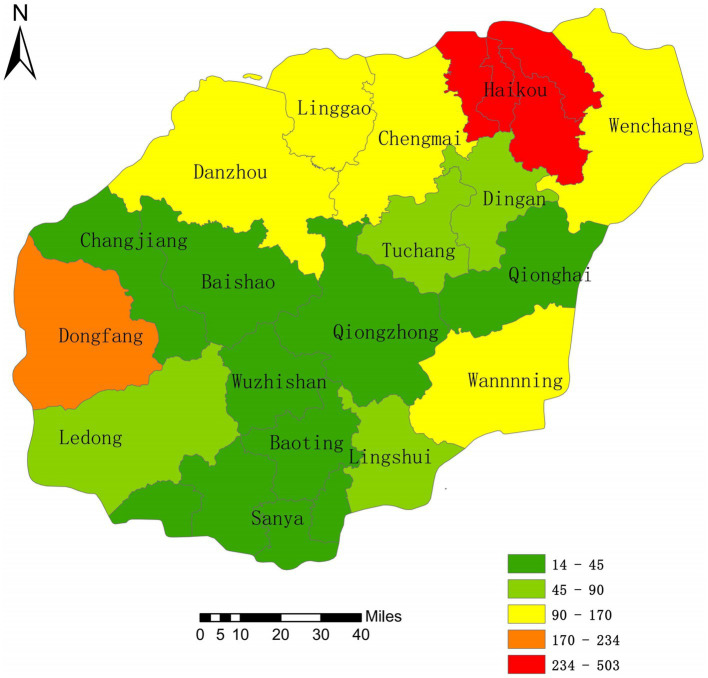
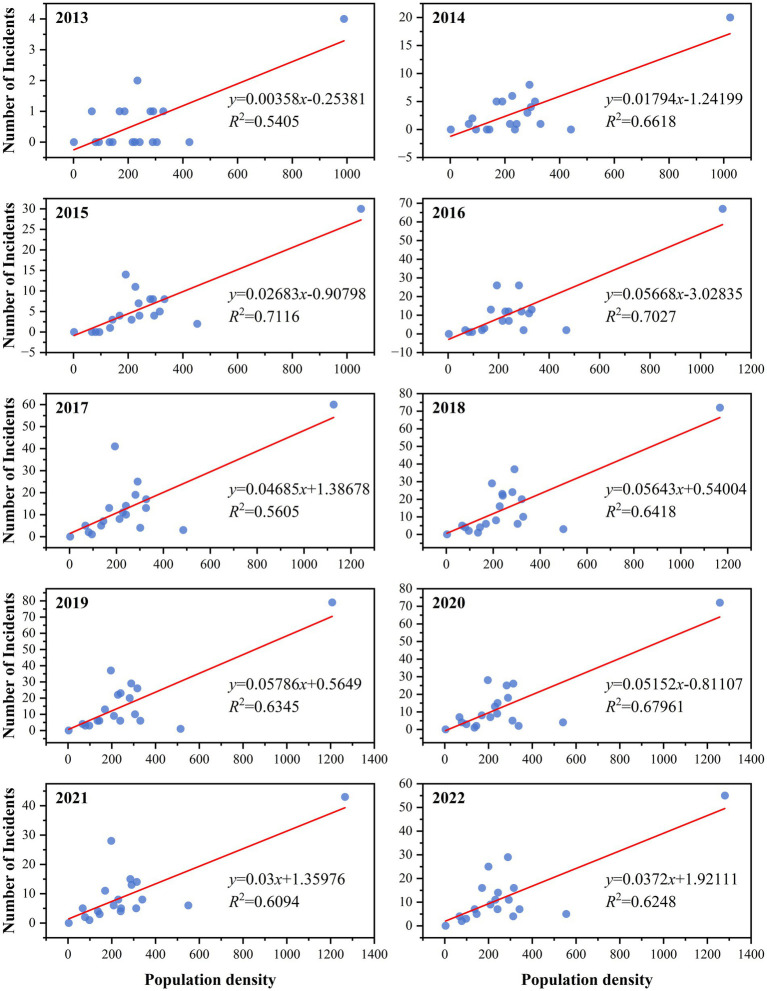
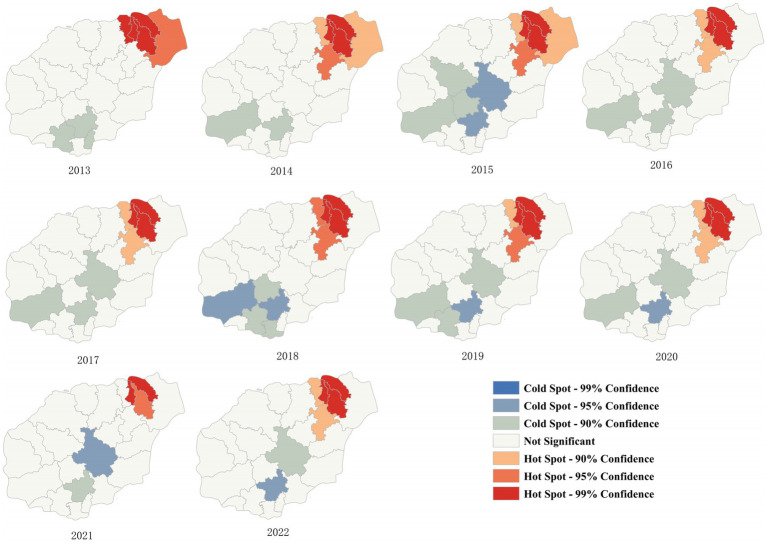
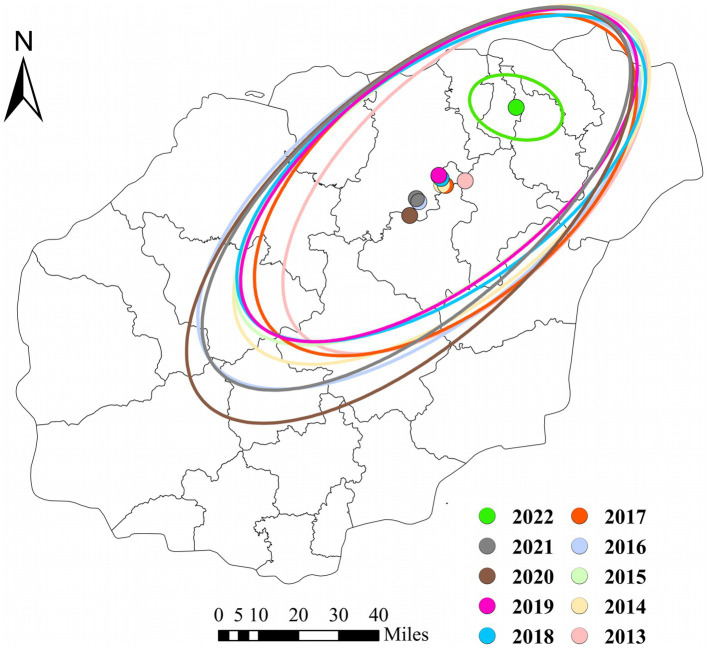
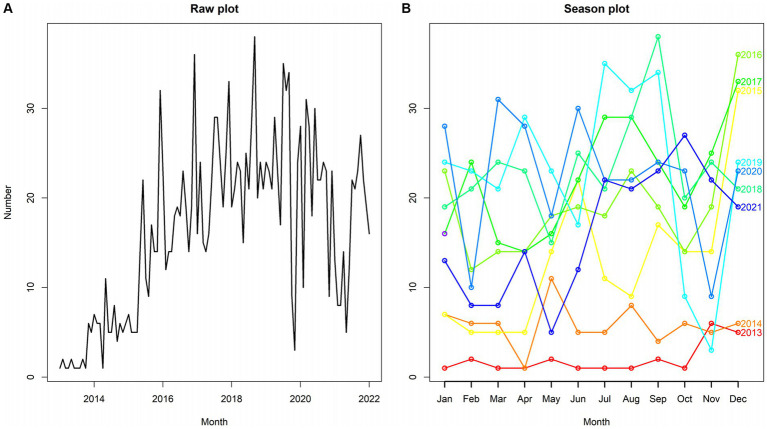
Results: From 2013 to 2022, 1,922 patients with sporadic hepatitis E were treated in the four hospitals of Hainan Province. The highest proportion of patients (n = 555, 28.88%) were aged 50-59 years. The annual incidence of hepatitis E increased from 2013 to 2019, with a slight decrease in 2020 and 2021 and an increase in 2022. The highest number of cases was reported in Haikou, followed by Dongfang and Danzhou. We found that there was a correlation between the economy, population density, latitude, and the number of cases, with the correlation coefficient |r| value fluctuating between 0.403 and 0.421, indicating a linear correlation. At the same time, a scatter plot shows the correlation between population density and incidence from 2013 to 2022, with r2 values fluctuating between 0.5405 and 0.7116, indicating a linear correlation. Global Moran's I, calculated through spatial autocorrelation analysis, showed that each year from 2013 to 2022 all had a Moran's I value >0, indicating positive spatial autocorrelation (p < 0.01). Local Moran's I analysis revealed that from 2013 to 2022, local hotspots were mainly concentrated in the northern part of Hainan Province, with Haikou, Wenchang, Ding'an, and Chengmai being frequent hotspot regions, whereas Baoting, Qiongzhong, and Ledong were frequent cold-spot regions. Concentration and dispersion analysis indicated a clear directional pattern in the average density distribution, moving from northeast to southwest. Time-series forecast modeling showed that the forecast number of newly reported cases per month remained relatively stable in 2023 and 2024, fluctuating between 17 and 19.
Conclusion: The overall incidence of hepatitis E in Hainan Province remains relatively stable. The incidence of hepatitis E in Hainan Province increased from 2013 to 2019, with a higher clustering of cases in the northeast region and a gradual spread toward the southwest over time. The ARIMA model predicted a relatively stable number of new cases each month in 2023 and 2024.
Keywords: Hainan Province; forecasting model; hepatitis E; spatial autocorrelation; trend analysis.
Copyright © 2024 Yun, Li, Wang, Lin, Li, Weng, Zhang, Wu, Li, Cai, Li, Fu, Wu and Gao.
Conflict of interest statement
The authors declare that the research was conducted in the absence of any commercial or financial relationships that could be construed as a potential conflict of interest.
Figures
References
-
- Naidu SS, Viswanathan R. Infectious hepatitis in pregnancy during Delhi epidemic. Indian J Med Res. (1957) 45:71–6. PMID: - PubMed
MeSH terms
LinkOut - more resources
Full Text Sources