Review
. 2024 Jun 17;14(10):3859-3899.
doi: 10.7150/thno.96516. eCollection 2024.

Osteoporotic osseointegration: therapeutic hallmarks and engineering strategies

Affiliations
Review

Osteoporotic osseointegration: therapeutic hallmarks and engineering strategies

Jiayao Chen et al. Theranostics. .

Abstract

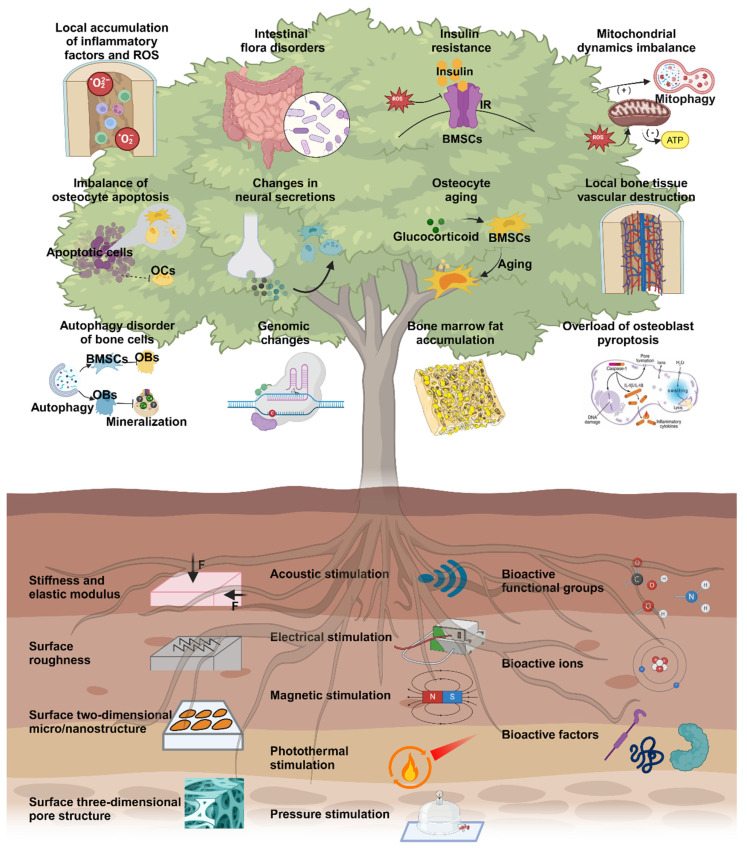
Osteoporosis is a systemic skeletal disease caused by an imbalance between bone resorption and formation. Current treatments primarily involve systemic medication and hormone therapy. However, these systemic treatments lack directionality and are often ineffective for locally severe osteoporosis, with the potential for complex adverse reactions. Consequently, treatment strategies using bioactive materials or external interventions have emerged as the most promising approaches. This review proposes twelve microenvironmental treatment targets for osteoporosis-related pathological changes, including local accumulation of inflammatory factors and reactive oxygen species (ROS), imbalance of mitochondrial dynamics, insulin resistance, disruption of bone cell autophagy, imbalance of bone cell apoptosis, changes in neural secretions, aging of bone cells, increased local bone tissue vascular destruction, and decreased regeneration. Additionally, this review examines the current research status of effective or potential biophysical and biochemical stimuli based on these microenvironmental treatment targets and summarizes the advantages and optimal parameters of different bioengineering stimuli to support preclinical and clinical research on osteoporosis treatment and bone regeneration. Finally, the review addresses ongoing challenges and future research prospects.

Keywords: Applications; Bone regeneration; Bone tissue engineering; Engineering stimuli; Osteoporosis.


Conflict of interest statement

Competing Interests: The authors have declared that no competing interest exists.

Figures

Scheme 1
Scheme 1
Overview of microenvironmental hallmarks of osteoporosis and engineering stimulations in topical osteoporotic osteoregeneration and osseointegration. Created with BioRender.com.
Figure 1
Figure 1
Local accumulation of inflammatory factors and ROS. (A) Mechanisms of growth and differentiation of inflammatory cells induced by the osteoporotic microenvironment. (B-C) (B) Representative microcomputed tomography images of femurs from SHAM mice and oophorectomy (OVX) mice (± antimony administered). (C) Histological analysis of OCLs from tibias from SHAM and OVX mice treated or not treated with Sb determined via TRAcP staining (in purple). Scale bars: 100 µm. Adapted with permission from , copyright 2023. (D) The gut flora influences the osteoporosis process through the immune system. Created with BioRender.com. (E-H) Probiotic LGG administration improved the expression of bone turnover markers and changes in serum Ca levels, CTX-I, PINP and CTX-I/PINP in all groups. (n = 8-10). Adapted with permission from , copyright 2023.
Figure 2
Figure 2
Mechanisms and experiments related to ROS clearance (A, B, C) GPF attenuates RANKL-induced ROS generation in vitro. (D) Representative images showing the inhibitory effect of GPFs on BMM osteoclastogenesis. BMMs were incubated with RANKL and M-CSF in the absence or presence of GPFs (0, 10, 20 and 40 μM). On day 7, the cells were fixed, and the cells were stained for TRAP (n = 3). (E) CCK-8 assay after 96 h of treatment with different concentrations of GPF (n = 3). Adapted with permission from , copyright 2021. (F) Mechanisms associated with the development of osteoporosis and insulin resistance. Created with BioRender.com. (G-H) Folic acid ameliorated bone loss and destruction induced by a high-fat diet in mice, and quantitative statistics of HE-stained images showed a reduction in the number of osteoclasts and adipocytes in the HFD+FA group compared with the HFD group. Adapted with permission from , copyright 2021.
Figure 3
Figure 3
Interaction of cellular autophagy and apoptosis with the osteoporotic microenvironment (A) Schematic illustration of autophagy ultimately relieving osteoporotic bone destruction in diseased cells. (A-D) (B) ICA promoted the osteogenic viability of BMSCs by restoring autophagy according to the results of the osteogenic viability assay and the qualitative and quantitative results of ALP staining after 3 and 7 days of incubation with ICA, respectively (n = 3). (C) TEM observation of autophagosomes (white dashed line) and mitochondria (yellow arrows) in BMSCs after incubation with ICA for 3 days. (D) Quantification of the mitochondrial number and individual mitochondrial area in the different groups. Adapted with permission from , copyright 2023. (E, F) TNF-α-induced necroptosis and apoptosis of MLO-Y4 cells. TEM images of osteocytes pretreated for 30 min with DMSO (1%), Nec-1 (30 mmol/L), zVAD (25 mmol/L), or Nec-1 (30 mmol/L) + zVAD (25 mmol/L) and then treated with TNF-α (100 ng/ml) for 24 h. Adapted with permission from , copyright 2021.
Figure 4
Figure 4
(A) Osteoblast pyroptosis affects the development of osteoporosis by interfering with the release of immune factors. (B-G) Bone morphogenetic protein-7 (BMP-2) administration reduces the cellular cascade markers of cellular pyroptosis caspase1, IL-1β, and IL-18. (B, C) caspase-1, (D, E) IL-1β, (F, G) IL-18. Adapted with permission from , copyright 2021. (H) Neurosecretory agents act on neurons and OBs during osteoporosis development. Created with BioRender.com. (I-L) Cyp40 is critical in promoting neurogenesis in bone tissue repair. (I, J) Scoring of TRAP staining of OBs and TRAP-positive multinucleated cells with ≥3 nuclei per well (n=3). (K, L) Resorptive activity was measured by planking BMMC on fluorescent calcium phosphate-coated plates. Adapted with permission from , copyright 2023.
Figure 5
Figure 5
Advances in the study of cellular senescence and local tissue vascularization. (A) Mechanisms of skeletal senescence and potential therapeutic options. (B-C) (B) Cadmium exposure induces cellular senescence and impairs osteogenic and adipogenic homeostasis in primary BMSCs. Primary BMMSCs were cultured in the presence or absence of 10 μM Cd for 24 h. Cellular senescence was detected by β-galactosidase (SA-β-Gal) staining, and cell proliferative capacity was analyzed by EdU staining. Scale bar = 50 μm. (C) Cd exposure increased SASP-related cytokine production and activated the NF-κB pathway in BMSCs. BMSCs were cultured for 3 hr with or without Cd exposure, and qPCR was performed to detect the gene expression levels of several SASP markers (IL-1α, IL-1β, TGF-β, CXCL-1, and VEGF). Adapted with permission from , copyright 2021. (D) Vessel formation was promoted by drug intervention, as shown by immunofluorescence. (E) Effects of BSTLD on angiogenesis and osteoclast activation in the epiphysis of OVX rats and immunostaining for vascular endothelial growth factor A (VEGF-A) and calcitonin receptor (CALCR) in the femoral epiphysis at twelve weeks postsurgery. Adapted with permission from , copyright 2022. Created with BioRender.com.
Figure 6
Figure 6
Lipids accumulate in the bone marrow, influence osteogenesis and osteoblastogenesis, and have multiple functions. Created with BioRender.com.
Figure 7
Figure 7
Stiffness, modulus of elasticity and surface roughness. (A) Schematic representation of refracture due to endplate cortical disruption. The presence of endplate cortical disruption is shown. Adapted with permission from , copyright 2021. (B) Effect of material surface stiffness on stem cell differentiation tendency. (C-D) (C) Representative histologic photographs of Van-Gieson-stained bone defect areas (black areas represent titanium alloy, red areas represent bone). (D) Osseointegration was assessed by tensile biomechanical testing 3 months after implantation (*p < 0.05, **p < 0.01). Adapted with permission from , copyright 2020. (E) Surface characterization of Ti, AHT and AHT-Sr surfaces, including representative SEM images (scale bar: 500 nm), EDS spectra and mapping. (F, G) Surface physicochemical properties of Ti, AHT and AHT-Sr, including the water contact angle (n = 3) and protein adsorption test results for various specimens. Adapted with permission from , copyright 2022.
Figure 8
Figure 8
Two or three dimensions of the surface. (A) FE-SEM image of Ti and TiO2-NT arrays constructed on Ti by electrochemical anodizing. Adapted with permission from , copyright 2019. (B) Schematic diagram of the processes of inductively coupled plasma (ICP) etching and anodizing for the preparation of microscale grooves and nanotubes on the surface of titanium (Ti), respectively. Adapted with permission from , copyright 2019. (C) Osteogenic differentiation of hMSCs was promoted on the UV-patterned surface. (D) In vivo osseointegration was enhanced on the UV-patterned surface. Representative methylene blue images of hard tissue sections at four and eight weeks postsurgery; the area indicated by the white pentagram is the TiO2 matrix implant, and the red dashed box is the magnified area. Adapted with permission from , copyright 2023. (E-H) (E) Characterization of collagen-based cell-loaded porous constructs (CMS, CFS, CFS-1, and CFS-2) via live/dead cell assays and DAPI/ghost pen cyclic peptide staining. (F) Crosstalk-induced osteogenesis and angiogenesis between hASCs and ECs in porous cell constructs. Immunofluorescence images stained with an OPN antibody and stained with a CD31 antibody after two weeks of culture. (G) Histological analysis six weeks after implantation. Histological images showing hematoxylin and eosin (H&E) staining and cross-sections of the spinal fusion after Masson trichrome staining in the exfoliated, CMS, CFS, CFS-1, and CFS-2 groups. Adapted with permission from , copyright 2022.
Figure 9
Figure 9
Advances in sonic stimulation in osteoporosis treatment. (A) Schematic representation of the mechanism of the effect of acoustic stimulation on cell behavior. (B) After mechanical stimulation with LIPUS, EphrinB2/EphB4 was found to be involved in regulating the migration and osteogenesis of BMSC-derived OBs in a coculture system. (C) LIPUS combined with EphrinB2-Fc-mimicked positive signaling enhances osteogenic differentiation. Adapted with permission from , copyright 2023. Representative images of ALP and ARS staining of each group at 7 and 21 days after osteogenic induction, respectively. LIPUS attenuates H2O2-induced oxidative stress, and intracellular ROS levels were measured by (F) DCFH-DA staining (scale bar = 400 μm) and (D) DCFH-DA fluorescence intensity. (E) The MDA content of PDLCs was measured using an MDA assay kit. Adapted with permission from , copyright 2020. (G) Immunohistochemical staining for Mac-2 in the control group and LIPUS group on days 3, 5, 7, 10 and 14 after surgery. Adapted with permission from , copyright 2019. Created with BioRender.com.
Figure 10
Figure 10
Advances in the study of electrical and magnetic stimulation in the treatment of osteoporosis. (A) Morphologic changes in epiphyseal defects in osteoporotic rats in response to electrical stimulation. Adapted with permission from , copyright 2021. (B) Magnetic drive-in cells and strategies used for differentiation and regeneration. (C-F) (C) Morphology and proliferation of MC3T3-E1 cells. The relative numbers of attached MC3T3-E1 cells after 1, 3, and 6 h of stimulation were 44.68%, 72.76%, and 22.22% greater than those in the no-treatment group, respectively. (*p < 0.05, n = 10). (D) Relative total attachment area of MC3T3-E1 cells after 1, 3, and 6 hours of stimulation. 78.37%, 29.05%, and 3.06% greater in the EF-treated group than in the control group (**p < 0.01, n = 10). (E) Comparison of cell proliferation between the fractionated and unfractionated groups after 1 and 3 days of stimulation. (F) MTT results showing that MC3T3-E1 cells proliferated after 1, 3, and 5 days of EF stimulation after distillation. Adapted with permission from , copyright 2019. The proliferation rate of the MC3T3-E1 cells was 23.82% and 15.18% greater than that of the control group after 3 d and 5 d of stimulation, respectively. Two-sample t tests were used to analyze the data, and the significance levels were ×*p < 0.05 and **p < 0.01; n = 4. (G, H) Antimicrobial properties of FMS in vitro. Adapted with permission from , copyright 2023. Created with BioRender.com.
Figure 11
Figure 11
Effect of photothermal stimulation on pathological changes in osteoporosis. (A) Schematic diagram of the mechanism of action of photothermal stimulation. (B) ALP/ARS staining of osteogenically differentiated MSCs induced by different treatments. (C) Micro-CT analysis of bone indices in OP rats after different treatments. (D) Immunohistochemical staining of H&E, Masson trichrome, and femoral end sections of rats given different treatments for assessing regeneration of bone defects after eight weeks of treatment. H&E staining of femoral end sections from different treatment groups. (E) Masson trichrome staining of femoral end sections from mice given different treatments. The improvement in bone structure in the UCNP/ICA+NIR group was similar to that in the normal group and greater than that in the UCNP+ICA and UCNP/ICA groups. Note: New bone. (F) Immunohistochemical staining showing OPN and (G) OCN protein expression in terminal femoral sections from mice subjected to different treatments. Adapted with permission from , copyright 2022. Created with BioRender.com.
Figure 12
Figure 12
Advances in bioactive functional groups and ion-related research. (A-F) (A) 3D model of N3-FEP-4T. (B) Synthetic route of N3-FEP-4T and FEP-4T. (C) Photostability of N3-FEP-4T, FEP-4T, ICG in 1× PBS, N3-FEP-4T in NMS (normal mouse serum), and ICG in NMS under continuous 808 nm exposure for 1 h at a power density of 0.102 W cm-2. (D) Calcium-binding fluorescence image of N3-FEP-4T and FEP-4T. (E) Cell binding fluorescence image of N3-FEP-4T and FEP-4T. Adapted with permission from , copyright 2021. (F) Mineral ion dose ranges. (G) Effect of calcium ions on bone activity and fracture incidence. Adapted with permission from , copyright 2023. (H) Immunohistochemical staining of BMP-2 in typical newly formed bone tissue (red arrows) and immunohistochemical staining of the osteogenic markers OPN (arrowheads) and OCN (arrowheads). Scale bar = 100 μm. Adapted with permission from , copyright 2020.
Figure 13
Figure 13
Application and research progress of bioactive macromolecules in osteoporosis treatment. (A) SEM images of microspheres and hydrogels. (B) ALP activity in rMSC cultures. (C) Representative images of cross-sections at the level of critical-size defects in the skull of non-OP and OP rats showing the repair response of different experimental groups at the level of the defects at 12 weeks after implantation. Adapted with permission from , copyright 2019. (D) Morphology of the MBG scaffolds and PDA-MBG scaffolds at different scales determined by camera and SEM; scale bars are 200 μm and 1 μm, respectively. (E) ALP activity of BMSCs at different platforms after 7 d and 14 d; scale bars are 1 mm. **p < 0.01, ***p < 0.001. (F) Coronal views of femurs of sham and OVX rats. Micro-CT 3D reconstructed images of defect sites after 4 and 8 weeks of regeneration; scale bar is 1 mm. (G) Micro-CT 2D images of coronary (i), sagittal (ii), and transaxial (iii) slices of the defective region with surrounding tissue after 4 and 8 weeks of regeneration; the scale bar is 1 mm. Adapted with permission from , copyright 2023.

Similar articles

Cited by

References

    1. Ebeling PR, Nguyen HH, Aleksova J, Vincent AJ, Wong P, Milat F. Secondary Osteoporosis. Endocr Rev. 2022;43:240–313. - PubMed
    1. Curtis EM, van der Velde R, Moon RJ, van den Bergh JP, Geusens P, de Vries F. et al. Epidemiology of fractures in the United Kingdom 1988-2012: Variation with age, sex, geography, ethnicity and socioeconomic status. Bone. 2016;87:19–26. - PMC - PubMed
    1. Clynes MA, Harvey NC, Curtis EM, Fuggle NR, Dennison EM, Cooper C. The epidemiology of osteoporosis. Br Med Bull. 2020;133:105–17. - PMC - PubMed
    1. Goulding A, Jones IE, Taylor RW, Manning PJ, Williams SM. More broken bones: a 4-year double cohort study of young girls with and without distal forearm fractures. J Bone Miner Res. 2000;15:2011–8. - PubMed
    1. European Prospective Osteoporosis Study G, Felsenberg D, Silman AJ, Lunt M, Armbrecht G, Ismail AA. et al. Incidence of vertebral fracture in europe: results from the European Prospective Osteoporosis Study (EPOS) J Bone Miner Res. 2002;17:716–24. - PubMed

Publication types

Substances