. 2024 Jul 2;14(10):4107-4126.
doi: 10.7150/thno.93473. eCollection 2024.

The CEBPB+ glioblastoma subcluster specifically drives the formation of M2 tumor-associated macrophages to promote malignancy growth

Affiliations

The CEBPB+ glioblastoma subcluster specifically drives the formation of M2 tumor-associated macrophages to promote malignancy growth

Yongchang Yang et al. Theranostics. .

Abstract

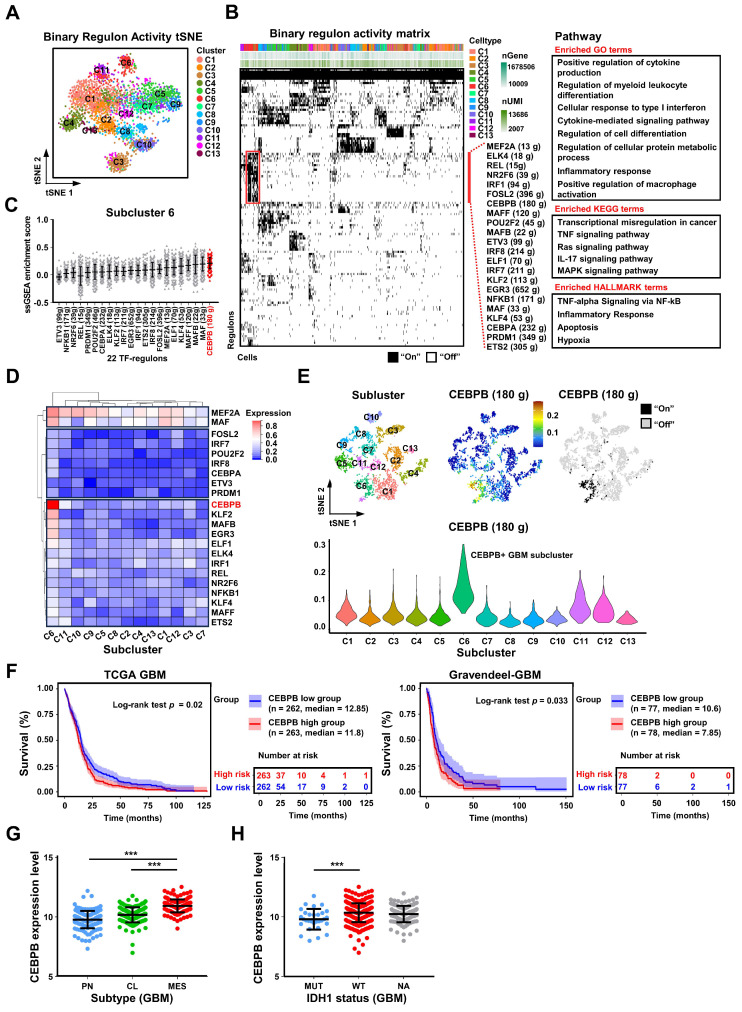
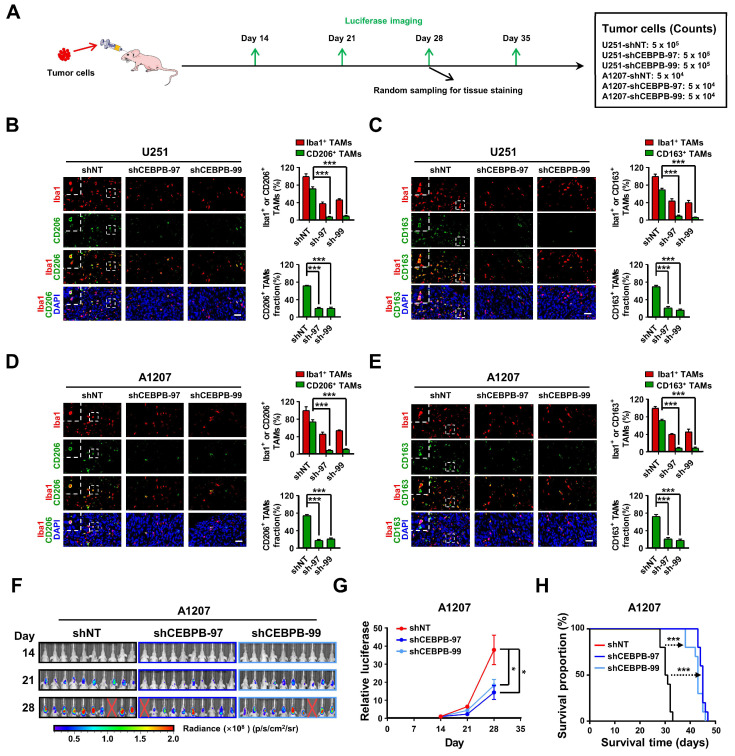
Rationale: The heterogeneity of tumor cells within the glioblastoma (GBM) microenvironment presents a complex challenge in curbing GBM progression. Understanding the specific mechanisms of interaction between different GBM cell subclusters and non-tumor cells is crucial. Methods: In this study, we utilized a comprehensive approach integrating glioma single-cell and spatial transcriptomics. This allowed us to examine the molecular interactions and spatial localization within GBM, focusing on a specific tumor cell subcluster, GBM subcluster 6, and M2-type tumor-associated macrophages (M2 TAMs). Results: Our analysis revealed a significant correlation between a specific tumor cell subcluster, GBM cluster 6, and M2-type TAMs. Further in vitro and in vivo experiments demonstrated the specific regulatory role of the CEBPB transcriptional network in GBM subcluster 6, which governs its tumorigenicity, recruitment of M2 TAMs, and polarization. This regulation involves molecules such as MCP1 for macrophage recruitment and the SPP1-Integrin αvβ1-Akt signaling pathway for M2 polarization. Conclusion: Our findings not only deepen our understanding of the formation of M2 TAMs, particularly highlighting the differential roles played by heterogeneous cells within GBM in this process, but also provided new insights for effectively controlling the malignant progression of GBM.

Keywords: CEBPB+ glioblastoma subcluster; Glioblastoma microenvironment; M2 Tumor-associated macrophages; SPP1-Integrin αvβ1-Akt axis; Single cell sequencing; Spatial transcriptome.


Conflict of interest statement

Competing Interests: The authors have declared that no competing interest exists.

Figures

Figure 1
Figure 1
High-grade gliomas demonstrate significant M2 TAM density. (A) t-SNE representation of the Gliomap. The corner insets depict the cluster (marker), patient, grade, as well as further subdivisions of non-tumor subclusters and glioma subclusters. The axis outside the circular plot shows the log scale of the total cell number for each cell type (level-3 annotation). (B) The pie chart illustrates the distribution of non-tumor cells in different glioma patients (WHO IV, n = 8; Gliosarcoma, n = 1; WHO III->IV, n = 1; WHO II, n = 3; lung cancer metastases, n = 1). (C) Histogram shows the percentage (%) of M2 TAMs among all non-tumor cells in 14 glioma patients, colored by different grades. *p < 0.05, two-tailed unpaired t-test. (D) The Kaplan-Meier survival curves show that M2 macrophage infiltration scores are associated with malignant progression of glioma in TCGA GBMLGG database. Based on the median value of M2 macrophage score, we divided the patients into high group and low groups. P values were determined by log-rank test. Immune infiltration scores are calculated by the CIBERSORT package based on the TCGA GBMLGG expression matrix.
Figure 2
Figure 2
The GBM subcluster 6 and M2 TAMs exhibit a high correlation in distribution. (A) All glioma cells were analyzed using t-SNE, and 13 significant cell clusters are color-coded and labeled as indicated. (B) The heatmap shows the expression patterns of all marker genes for the 13 glioma subclusters. The boxes (left) contain the top 2 specific markers for each glioma cluster, with the colors indicating the respective glioma subclusters. (C) A scatter plot demonstrates the Spearman's rank correlation between the proportions of different glioma subclusters (%) and M2 TAMs (%) across 51 tumor regions, colored by -log10 (p value). The x-axis and y-axis represent the correlation coefficient and -log10 (p value), respectively. The significance level threshold is set at p < 0.05. A correlation coefficient > 0 indicates a positive correlation, while a correlation coefficient < 0 indicates a negative correlation. (D) The pie chart displays the proportion of cluster 6 cells in 14 glioma patients. The colors represent different grades of glioma patients. (E) The figure is a schematic diagram of the MIA analysis. (F) shows spatial transcriptomic analysis of 3 GBM tissues, with the top row showing tissue H&E staining, and the bottom row showing clustering of spatial transcriptomic data. (G) The volcano plot displays the spearman correlation between the M2 score and glioma subcluster enrichment score in different regions of the 3 tissues, colored by -log10 (p value). (H) shows the ssGSEA enrichment score of M2 macrophages, Glioma 6, and Glioma 1 in various regions across the 3 GBM tissues.
Figure 3
Figure 3
The biological characteristics of GBM subcluster 6. (A) Heatmap shows the mean of top50 marker genes of clusters. The line graph represents the differential expression of the mean of these marker genes in all clusters, and on the right side are displayed the ligands associated with M2 macrophage polarization or chemotaxis in subcluster C6. The bar chart represents the functional enrichment of GO (BP, Biological Process; CC, Cellular Component; MF, Molecular Function), KEGG and Hallmark pathways for marker genes in glioma subcluster 6. The x-axis and y-axis represent -log10 (p value) and pathways. (B) Expression of monocyte chemoattractant protein (MCPs: MCP-1, MCP-2, MCP-4) in different glioma clusters. Data are shown as means ± s.e.m. (C) Developmental inference analysis shows the dynamic shift in cell state, with the arrow indicating the direction of cell state transition. (D) Feature plot displays represented marker genes for subcluster 9 (PDGFRA, OLIG1), subcluster 1 (SEC61G, TNFRSF12A) and subcluster 6 (SPP1, FCER1G) across all glioma cells. (E) The trajectory analysis of all glioma cells is depicted in the first line, with color-coded representation based on glioma clusters, status and pseudotime. The second row displays a trajectory of root, subcluster 1, and subcluster 6. (F) Heatmap represents the expression patterns of genes during the developmental process from root to subcluster 1 and subcluster 6. The partial signature genes for each pattern are displayed on the right. (G) shows functional enrichment analysis of GO BP (red), GO CC (blue), and GO MF (green) for the gene module of cluster 6.
Figure 4
Figure 4
Single-cell sequencing revealed that CEBPB is a specific TF-regulon of GBM cluster 6. (A) New t-SNE analysis based on binary regulon activity, analyzed by SCENIC, is color-coded by glioma clusters. (B) Binary regulon activity matrix identifies the master TF-regulons in different glioma clusters. On the right, the primary TF-regulons of GBM cluster 6 are listed, along with the number of genes they regulate. Additionally, functional enrichment of GO, KEGG, and HALLMARK pathways associated with these regulons is provided. The pathways shown in the figure have a significance level of p < 0.05. (C) The scatter plot displays the ssGSEA enrichment scores of 22 TF-regulons in subcluster 6, arranged in ascending order based on their mean values. (D) The heatmap displays the relative mRNA expression levels of 22 transcription factors across 13 glioma subclusters. (E) The expression distribution of CEBPB-regulons on the original t-SNE coordinates of 13 glioma clusters. The violin plot represents the expression of CEBPB in 13 glioma clusters. (F) Kaplan-Meier curves of patient survival stratified by the median of CEBPB expression level from TCGA GBM and Gravendeel-GBM databases. P values were determined by log-rank. (G) CEBPB expression in subtype (n = 162, PN; n = 198, CL; n = 165, MES) from the TCGA GBM database. Black bars indicate mean ± s.d. ***p < 0.001; one-way ANOVA with Tukey's method for multiple comparisons. (H) shows CEBPB expression in GBM patients with IDH1 status (n = 30, IDH1 mutation (MUT); n = 372, IDH1 wild type (WT); n = 123, unknown (NA)) in the TCGA GBM database. Data are represented as means ± s.d. ***p < 0.001; two-tailed unpaired t-test.
Figure 5
Figure 5
CEBPB can recruit TAMs and polarize them towards the M2 phenotype in vitro. (A) The bar graph shows the relative mRNA expression levels of CEBPB in normal tissues, GBM cell lines and primary GBM by qPCR. Data are represented as means ± s.e.m. n = 3 independent experiments. (B) Immunoblot analysis of CEBPB expression in GBM cells (U251, A1207, GBM727-Vector, GBM727-CEBPB-overexpression (CEBPB-OE)) (top) and GBM cells (U251 and A1207) transduced with non-targeting shRNA (shNT) or CEBPB shRNA (shCEBPB) through lentiviral infection (bottom). (C) Relative mRNA expression of CCL2 (MCP-1) expression in GBM cells (U251 and A1207) transduced with non-targeting shRNA (shNT) or CEBPB shRNA (shCEBPB) through lentiviral infection and GBM727- Vector, GBM727-CEBPB-OE. Data are represented as means ± s.e.m. n = 3 independent experiments. ***p < 0.001. Statistical significance was determined by one-way ANOVA analysis. (D) A schematic diagram for migration experiment of M0 macrophages (U937-derived) in vitro. (E) Representative images show M0 macrophages (U937 differentiated into macrophages after treatment with 100 nM PMA) that migrated towards GBM conditional media. Scale bar, 100 µm. (F) Graphical analysis of (E) displays a significant reduction of macrophages that migrated towards GBM conditioned media expressing shCEBPB. **p < 0.01, ***p < 0.001 (n = 5 fields); mean ± s.e.m; two-tailed unpaired t-test. (G) A schematic diagram for M2 polarization of macrophages (U937-derived) in vitro. (H) Western blotting and (I) qPCR were used to detect the expression of M2 markers (CD206, CD163 and ARG1) and the total macrophage marker IBA1 in M0 macrophage (U937 differentiated into macrophages after treatment with 100nM PMA) treated with GBM conditional media for 72 h. α-tubulin was blotted as the loading control. Data are represented as means ± s.e.m. n = 3 independent experiments. **p < 0.01, ***p < 0.001. Statistical significance was determined by one-way ANOVA analysis.
Figure 6
Figure 6
CEBPB triggers M2 polarization of TAMs to promote malignancy growth in vivo. (A) Experimental design to assess CEBPB triggers M2 polarization of TAMs in vivo. (B)-(E) Immunofluorescent staining of the M2 TAM Marker (CD206 and CD163) (green) and the pan-macrophage marker Iba1 (red) in GBM xenografts derived from U251 and A1207 expressing shNT control or shCEBPB. Boxed areas are further magnified. Scale Bar, 40 μM. Histogram show the quantitation of M2 TAM density and the fraction of M2 TAMs in xenografts derived from U251 and A1207 expressing shNT or shCEBPB. N = 5 (shNT, shCEBPB-97 or shCEBPB-99) biological independent tumor samples. The M2 TAM fraction was determined by the percentage of M2 TAMs within TAMs in shNT or shCEBPB xenografts, respectively. Data are represented as means ± s.e.m. ***p <0.001, two-tailed unpaired t-test. (F)-(H) Left, representative images on day 14, 21, 28 post transplantation are shown; bioluminescence is measured in p/s/cm2/sr. Middle, quantification of relative luciferase signals during 28 days. A1207: shNT (n = 9), shCEBPB-97 (n = 9), shCEBPB-99 (n = 9); Data are represented as means ± s.e.m. *p < 0.05, one-way ANOVA with Tukey's method for multiple comparisons. Right, Kaplan-Meier survival curves of mice bearing A1207-derived xenografts expressing shNT or shCEBPB. ***p < 0.001, log-rank test. A1207: shNT (n = 10), shCEBPB-97 (n = 10), shCEBPB-99 (n = 10).
Figure 7
Figure 7
Intercellular communications show that SPP1 secreted by CEBPB+ GBM subcluster may regulate M2 TAMs. (A) A summary of cell communication between M2 TAMs and 13 glioma clusters. The Number of interactions indicates the quantity of distinct signaling pathways between each pair of clusters. The Interactions Weights/strength reflects the intensity or significance of these interactions, which might be calculated based on the expression levels of signaling molecules or other metrics. (B) Bubble plot shows the potential ligand-receptor interactions between CEBPB+ GBM subcluster and M2 TAMs. The dot color and size represent the calculated communication probability and p values. P values are computed from one-sided permutation test. (C) The inferred SPP1 signaling pathway network and SPP1 - (ITGAV+ITGB1) interaction network. Circle sizes are proportional to the number of cells in each cell cluster and edge width represents the communication probability. (D) The expression distribution of SPP1 on t-SNE coordinates and (E) their expression in various glioma clusters. (F) Kaplan-Meier curves of patient survival stratified by the median of SPP1 expression level from TCGA GBM and CGGA-GBM databases. P values were determined by log-rank. (G) SPP1 expression in subtype (n = 162, PN; n = 198, CL; n = 165, MES) from the TCGA GBM database. Black bars indicate mean ± s.d. ***p < 0.001; one-way ANOVA with Tukey's method for multiple comparisons. (H) shows SPP1 expression in GBM patients with IDH1 status (n = 30, MUT; n = 372, WT; n = 123, NA) in the TCGA GBM database. Data are represented as means ± s.d. **p < 0.01; two-tailed unpaired t-test.
Figure 8
Figure 8
GBM cluster 6 induce M2 polarization of TAMs through SPP1-Integrin αvβ1-Akt axis. (A) The radar chart shows the Spearman's rank correlation between CEBPB and SPP1 expression in 13 GBM databases. (B) IGV visualization shows ATAC-seq (Data range: 0-100) of different grade gliomas (GBM, red; LGG, blue) and ChIP-seq (Data range: 0-5) of CEBPB in different cell lines (green) at the SPP1 promoter region. The red box below indicates the predicted binding site of CEBPB motif in the promoter region of SPP1. (C) Predicted CEBPB motif in the promoter region of SPP1. CUT&RUN-qPCR and gel electrophoresis show transcription factor CEBPB binds directly to promoter regions of SPP1. Cross-linked chromatin was prepared from U251 and A1207. P values were calculated using the 2-tailed 2-sample t test. Data are shown as means ± s.e.m. n = 3 independent experiments. **p < 0.01, ***p < 0.001. (D) qPCR shows the mRNA expression level of SPP1 in U251(shNT, shCEBPB), A1207 (shNT, shCEBPB) and GBM727 (Vector, CEBPB-OE). Data are shown as means ± s.e.m. n = 3 independent experiments. Statistical significance was determined by one-way ANOVA analysis. (E) Analysis of the changes in SPP1 production in U251(shNT, shCEBPB), A1207 (shNT, shCEBPB) and GBM727 (Vector, CEBPB-OE) at 48 h using ELISA (cells were seeded at 0.5 × 10⁶/ml as a starting culture density). P values were calculated using the 2-tailed 2-sample t test. Data indicate mean ± s.e.m and are representative of 3 independent experiments. ***p < 0.001. (F) Immunoblot analysis of M2 macrophages markers (CD206, CD163 and ARG1) in M0 macrophages (primed-U937 cells) treated with A1207 GBM CM and 200ng/ml rSPP1 protein for 72 h. α-tubulin were blotted as the loading control. (G) The spatial transcriptomics data demonstrated the co-localization of the CEBPB-SPP1-Integrin αvβ1-M2 axis. (H) Immunoblot analysis of M2 macrophages marker and Akt phosphorylation (Ser473) in M0 macrophages (primed-U937 cells) expressing si-Integrin αv or si-Integrin β1. These cells were then treated with a concentration of 200 ng/mL of the recombinant SPP1 (rSPP1) protein for 72 h. (I) Immunoblot analysis of M2 macrophages marker in M0 macrophages (primed-U937 cells) treated with GBM CM (GBM737-NT CM and GBM737-CEBPB-OE CM) and ASK8007. (J) Top, representative images on day 7, 14, 21 post transplantation are shown; bioluminescence is measured in p/s/cm2/sr. Bottom, quantification of relative luciferase signals during 21 days. GBM727: Control (n = 3), CEBPB-OE (n = 3), CEBPB-OE + shSPP1 (n = 3); Data are represented as means ± s.e.m. *p < 0.05; ns, p > 0.05, one-way ANOVA with Tukey's method for multiple comparisons. (K) Kaplan-Meier survival curves of mice bearing GBM727-derived xenografts (Control, CEBPB-OE, CEBPB-OE + shSPP1). **p < 0.01, log-rank test. GBM727: Control (n = 5), CEBPB-OE (n = 5), CEBPB-OE + shSPP1 (n = 5). Representative images from multiplex immunofluorescence (L) and statistical data (M) show the relative cell number of SPP1+ Integrin avβ1+ CD163+ P-Akt+ M2 TAMs in GBM727 (Control, n = 5; CEBPB-OE, n = 5; CEBPB-OE + shSPP1, n = 5). Boxed areas are further magnified. Scale Bar, 200uM or 40μM. P values were calculated using the 2-tailed 2-sample t test. Data are shown as means ± sem. **p < 0.01, ***p < 0.001. (N) The differences in the infiltration score (%) of M2 macrophages among the different groups (HH: CEBPB-SPP1high Integrin αvβ1high, LL: CEBPB-SPP1low Integrin αvβ1low, Other) in the CGGA-GBM database. P values were calculated using the 2-tailed 2-sample t test. Data are shown as means ± sd. **p < 0.01. (O) Kaplan-Meier survival analysis of 3 defined groups (CEBPB-SPP1high Integrin αvβ1high, CEBPB-SPP1low Integrin αvβ1low, Other) in the CGGA-GBM, and Gravendeel-GBM databases. P values were determined by log-rank. *p < 0.05, ***p < 0.001, ns: p > 0.05.

Similar articles

Cited by

References

    1. Alexander BM, Cloughesy TF. Adult Glioblastoma. J Clin Oncol. 2017;35:2402–9. - PubMed
    1. Stupp R, Hegi ME, Mason WP, van den Bent MJ, Taphoorn MJB, Janzer RC. et al. Effects of radiotherapy with concomitant and adjuvant temozolomide versus radiotherapy alone on survival in glioblastoma in a randomised phase III study: 5-year analysis of the EORTC-NCIC trial. Lancet Oncol. 2009;10:459–66. - PubMed
    1. Wen PY, Kesari S. Malignant gliomas in adults. N Engl J Med. 2008;359:492–507. - PubMed
    1. Jin X, Kim LJY, Wu Q, Wallace LC, Prager BC, Sanvoranart T. et al. Targeting glioma stem cells through combined BMI1 and EZH2 inhibition. Nat Med. 2017;23:1352–61. - PMC - PubMed
    1. Wang Q, Hu B, Hu X, Kim H, Squatrito M, Scarpace L. et al. Tumor Evolution of Glioma-Intrinsic Gene Expression Subtypes Associates with Immunological Changes in the Microenvironment. Cancer Cell. 2017;32:42–56. - PMC - PubMed

Publication types

MeSH terms

Substances